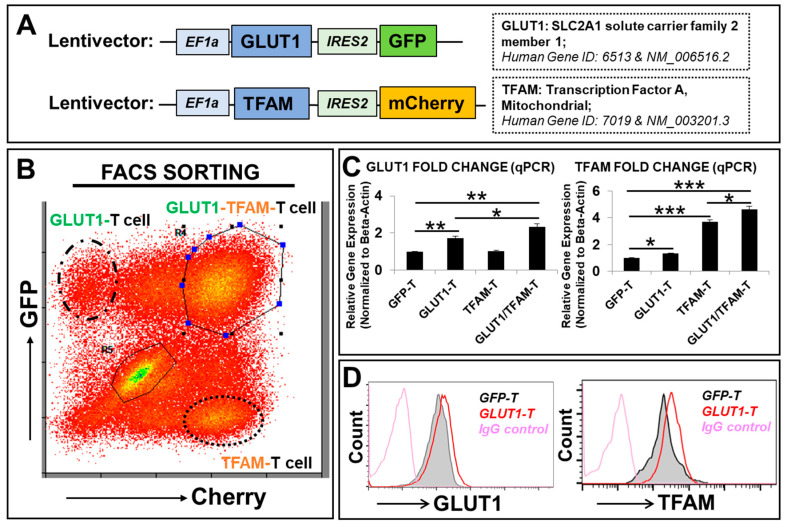
Figure 2.
Generation of transgenic T-cell lines overexpressing transgenes of SLC2A1 (GLUT1) and/or TFAM in vitro. (A) Schematic diagram of lentiviral expression construct containing human GLUT1 or TFAM open-reading frames and GFP or Cherry reporters, with promoters EF1a and IRES2, respectively; (B) a representative FC plot shows GFP and/or Cherry expression in GLUT1-T, TFAM-T, and GLUT1/TFAM-T cells (FACS-sorted, see Materials and Methods); (C) overexpressed gene expression of GLUT1 and TFAM was analyzed by qPCR. Data of mRNA expressions show the fold change (normalized to β-actin) of genes encoding GLUT1 and TFAM in new T-cell lines; (D) representative FC histograms show GLUT1 and TFAM expression in GLUT1-T (red line plots) versus vector control (GFP-T cells, the filled grey line) and IgG-fluorescent control (pink line plots); Where applicable, data are means ± SEM. * p < 0.05, ** p < 0.01, *** p < 0.005, n = 3.

