Figure 3.
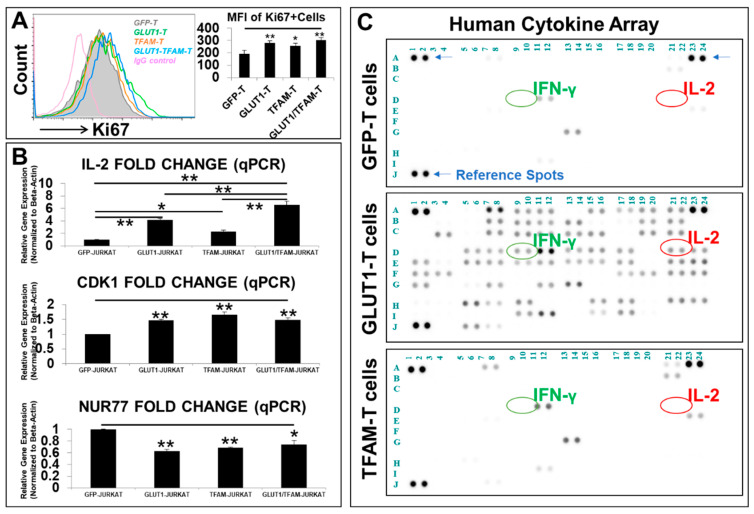
Phenotypic characterizations of metabolism-engineered T-cell lines in vitro. (A) A representative FC histogram (left panel) shows the expression of Ki67 in new transgenic T-cell lines, including GLUT1-T (green line plot), TFAM-T (orange line plot), GLUT1/TFAM-T (blue line plot), versus GFP-T cells (the filled grey line), and IgG-fluorescent control (pink line plot); cumulative data (right panel) of the mean fluorescence intensity (MFI) levels of Ki67 expression in the new T-cell lines; (B) qPCR analysis of the gene expression of different cytokines and biomarkers for cell divisions, inhibitory signals, and exhaustion. Data of mRNA expressions show the fold change (normalized to β-actin) of genes encoding IL-2, CDK1, and NUR77 in new T-cell lines; (C) image of blot films, with reference spots (blue arrows), interferon-gamma (IFN-γ, IFNG) (green circle), and interleukin-2 (IL-2) (red circle), developed for proteomic analyses of cell-free supernatants from new T-cell lines, including GLUT1-T and TFAM-T versus GFP-T cells; where applicable, data are means ± SEM. * p < 0.05, ** p < 0.01, n = 3.

