Figure 4.
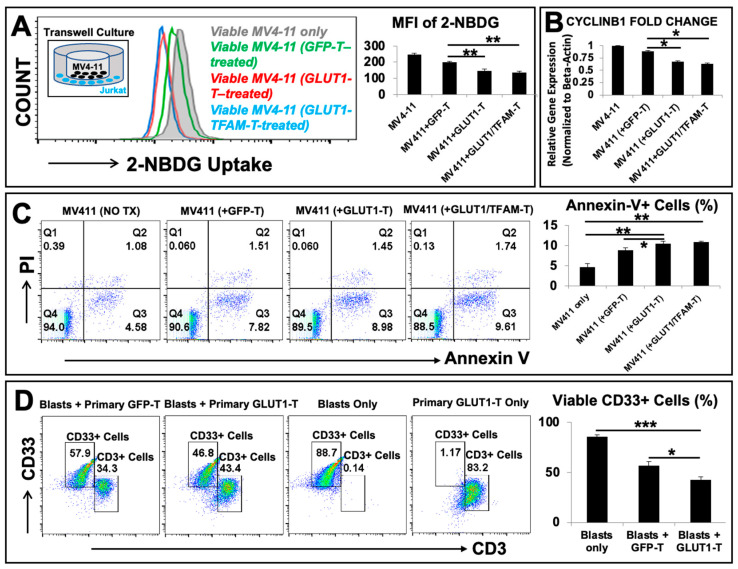
GLUT1-T or GLUT1/TFAM-T cells performed anti-leukemia effects through advanced glucose-uptake capability in vitro. (A) Left panel: Representative FC histograms show the 2-NBDG uptake in viable MV4-11 co-cultured with GLUT1-T (red line plots) and GLUT1/TFAM-T (blue line plots) versus vector control (GFP-T cells, green line) and viable MV4-11 alone (the filled grey line plots); a visual diagram of the transwell culture (inset) with MV4-11 cells (black) and engineered Jurkat T cells (blue); Right panel: mean fluorescence intensity (MFI) levels of 2-NBDG uptake in different experimental groups; (B) gene expression of CYCLIN B1 (CCNB1 gene), a biomarker for mitosis in the cell cycle was analyzed by qPCR. Data of mRNA expressions show the fold change (normalized to β-actin) of CYCLIN B1 gene in MV4-11 alone or MV4-11 co-cultured with different engineered T-cell lines in transwell; (C) representative FC plots show the expression of an Annexin V/PI apoptosis and necrosis assay in transwell co-cultures, including GLUT1-T co-culturing with MV4-11 versus GFP-T co-culturing with MV4-11 and MV4-11 only in vitro; Right panel: cumulative FC percentage data of Annexin V+ cells in the different experimental groups; (D) representative FC plots show the expression of CD33, a biomarker for primary AML blasts and CD3 in different cytotoxic co-cultures, including GLUT1-engineered primary T cells (GLUT1-T) co-culturing with primary CD33+ blasts versus GFP-T cells (vector control) co-culturing with CD33+ blasts, CD33+ blasts only and GLUT1-T only in vitro; Right panel: cumulative FC percentage data of viable CD33+ cells in different experimental groups; where applicable, data are means ± SEM. * p < 0.05, ** p< 0.01, *** p < 0.005, n = 3.

