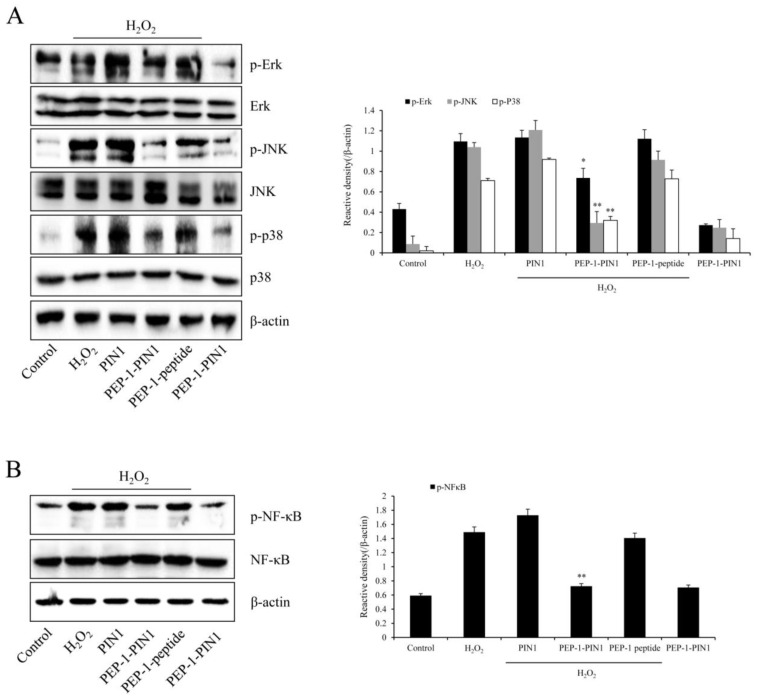
Figure 5.
Effects of delivered PEP-1–PIN1 against H2O2-induced MAPK and NF-κB expression in HT-22 cells. The cells were treated with PEP-1–PIN1 (5 μM) for 3 h before being exposed to H2O2 (1 mM) for 60 min or 30 min, respectively. The expression levels of MAPKs (A) and NF-κB (B) were analyzed by Western blotting. The intensity of the bands was measured by a densitometer. Data are represented as mean ± SEM (n = 3). * p < 0.05 and ** p < 0.01 compared with H2O2 treated cells.

