Abstract
Cells tend to align and move by following anisotropic topographical cues, namely the phenomenon known as contact guidance—an essential step in cell alignment, adhesion, and migration. The effect of topographical cues on individual cells has been investigated extensively, but that on cell aggregates still remains to be fully understood. Considering the high surface sensitivity of electrochemiluminescence (ECL) microscopy, it was used in this work to explore the impact of surface topography on cell behaviors. First, we studied the variations of cell–matrix adhesions of cells cultured on different topographical features. Both fibroblast-like and epithelial cells plated on microgrooved electrodes exhibited obvious contact guidance behavior. Then, the effect of surface topography on cellular collective migration was investigated. Topographic cues would be a barrier for cell migration if the orientation of microgrooves was perpendicular to the direction of migration; otherwise, it would be a helper. Finally, it was found that relaxation of cytoskeleton contractility or reduction in adhesion density could weaken the directed migration of leading cells, because the alteration of migration directionality was retarded. In contrast, such interactions were lost on the contact guidance response of follower cells, as they still aligned by following the topographic cues.
Keywords: extracellular microenvironment, topography, contact guidance, cell−matrix adhesions, collective cell migration, electrochemiluminescence microscopy
Introduction
The natural extracellular matrix (ECM) microenvironment, a highly cross-linking network, is compositionally, structurally, and mechanically complex.1−3 It contains numerous physical signals, including stiffness, geometric confinement, surface topography, and spatiotemporal variations of these factors.4,5 In particular, the topographic texture of the local microenvironment can influence cell responses, such as cell spreading,6,7 differentiation,8 and migration.9,10 The tendency of cells to adjust their orientations and migration behaviors in accordance with local anisotropic topographical features is referred to as contact guidance,11,12 which is of vital importance in tissue engineering13,14 and can influence cell coordination and invasiveness.15 Moreover, it is also an important parameter in the design of implanted medical devices as tailored topography can mimic a certain level of cellular control in vivo. Although the contact guidance response of a single cell to different topological signals has been extensively investigated,16−18 details about the responses of aggregation of cells to topographic cues remain less understood. For example, cellular collective migration is a fundamental phenomenon widely found in a large number of biological processes, such as embryo development,19 tissue regeneration,20,21 wound repair,22 and cancer metastasis,23 where cells move as a cohesive group in the form of sheets, streams, or clusters rather than individually.20 In these processes, the effect and role of topographic cues in the mechanical cooperation among cells are worthy of study.
Up to now, there are multiple imaging techniques that have been developed to investigate the effect of topography on cells. Bright field (BF) microscopy is easy of use and can realize dynamic imaging of cell migration without any pretreatment.24,25 However, the contrast of BF images is insufficient, which may result in overlooking detailed information. Fluorescence microscopy is widely used for cell imaging, and specific proteins that are important in cell alignment and migration, like vinculin26 and F-actin fiber,25 can be imaged to elucidate the variation of adhesion or cytoskeleton. But immunofluorescent tagging is usually required for fluorescence imaging. Given its advantage of high spatial resolution, scanning electron microscopy (SEM) is also frequently applied in cell imaging,16,27,28 but it is limited to dead cells.
Electrochemiluminescence (ECL) refers to luminescence that is triggered by electrochemical stimulation.29,30 It has manifested itself as a powerful approach in sensing and imaging by virtue of its advantages of high spatiotemporal resolution, high surface sensitivity, and near-zero background.31 Recently, ECL microscopy has shown great potential in cell analysis. Small molecules,32−34 proteins,35−37 and nucleic acids38 can be analyzed by ECL microscopy. Moreover, as a surface-sensitive tool, ECL microscopy is suitable for single entity imaging, such as single cells,39 bacteria,40 and even subcellular structures, like organelles,41,42 cell–matrix adhesions,43 and cell–cell junctions.44 Since ECL microscopy lends itself to living cell imaging, it can be applied to analyze single molecule movement on membranes,45 cell apoptosis,46 and migration.43
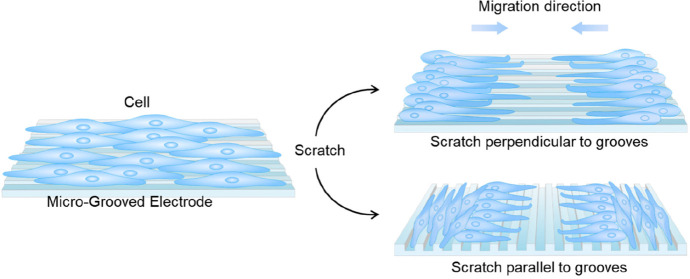
In this work, ECL microscopy was employed to elucidate the impact of the topography of the local environment on cell behaviors (Scheme 1). Due to its elaborate and reproducible control over structural properties,47 a typical 2D microgrooved surface was introduced. Different microgrooved (MG) electrodes with equally spaced ridges and grooves of ∼3 and 6 μm in width were fabricated; meanwhile, the flat electrodes were used as the control group. The variations of cell–matrix adhesions were imaged by ECL microscopy. We then investigated the collective responses of cohorts of cells to topographic cues. It was found that cell sheet also oriented along the microgrooves. The microgrooves could be a booster or an obstacle depending on the relative directions of the microgrooves and directed movement. Finally, drug stimulation experiments were conducted to explore the function of the cytoskeleton and cell–matrix adhesions on contact guidance and directed migration. It was found that either the cytoskeleton or adhesions can affect the speed and region of leading cells to adjust their orientations toward directional migration, while they have no influence on the alignment of follower cells.
Scheme 1. Schematic Illustration of Imaging Collective Cell Migration on the Surface of Microgrooved Electrode by ECL Microscopy.
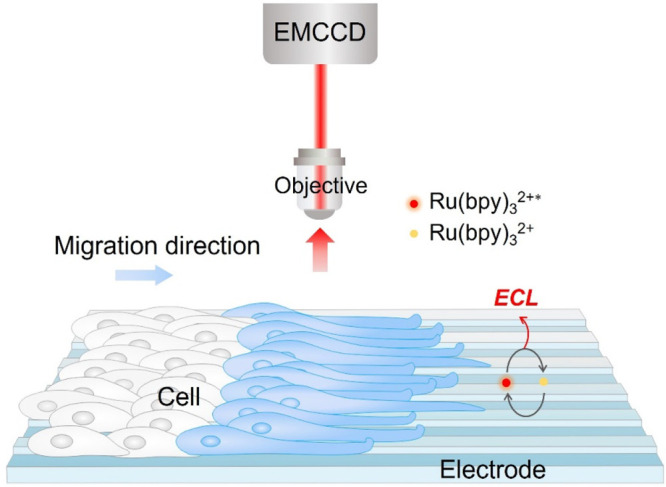
ECL generation from the electrode regions beneath cells is inhibited and that from nonadhesion domains is unlimited, thus realizing negative imaging of cell migration.
Experimental Section
Chemicals and Reagents
All chemicals were used as received without further purification. Tris(2,2′-bipyridyl)ruthenium(II) hexahydrate (Ru(bpy)3Cl2·6H2O, 98%), blebbistatin, N-(2-hydroxyethyl)piperazine-N′-2-ethanesulfonic acid (HEPES), and Dulbecco’s modified Eagle’s medium (DMEM) were obtained from Sigma-Aldrich. Fetal bovine serum (FBS) was ordered from Gibco. RPMI 1640 medium was bought from Genom. Arg-Gly-Asp peptide (RGD, ≥97%) was purchased from Macklin. Phosphate buffered saline (PBS, 0.01 M), normal goat serum, and trypsin–EDTA solution (0.25%, without phenol red) were bought from Solarbio. Paraformaldehyde (PFA, 4%) solution and penicillin–streptomycin (PS) were obtained from Beyotime. ITO coated glasses (surface resistivity <1 Ω/square, thickness 1200 ± 20 nm) were purchased from South China Science & Technology Co. Ltd. Prior to use, the ITO glasses were sequentially cleaned in 1 M NaOH/ethanol, acetone, ethanol, and ultrapure water under ultrasonication.
Fabrication of Microgrooved Electrodes
Microgrooved electrodes with microscale ridges and grooves of ∼3 or ∼6 μm in width and ∼100 nm in depth were fabricated by laser direct writing lithography (DWL, HEIDELBERG DWL66+). Briefly, an AR-P 5350 positive resist was spin-coated onto the ITO electrode for 60 s at 4000 rpm, resulting in a thin layer of photoresist with a thickness of ∼1 μm. The photoresist was soft-baked on a hotplate at 105 °C for 2 min. Subsequently, a focused laser was used to directly write the designed pattern onto the photoresist film. The photoresist was developed by immersion in developer for 1 min. Then, the areas exposed to laser were washed off whereas the rest stayed on the film, thus creating a grating pattern. Finally, the patterned electrode was etched in 6 M HCl for 40 min and then treated with ultrasonication in acetone, ethanol, and ultrapure water in sequence, followed by drying under a nitrogen stream.
Cell Culture for Imaging
PC12 cells were purchased from BeNa Culture Collection and cultured in DMEM with 10% FBS and 1% PS at 37 °C in a 5% CO2 environment. A549 cells were kindly provided by the group of Prof. Qun Fang (Zhejiang University). For single cell imaging, cells in the exponential growth phase were detached from a Petri dish using 0.25% (w/v) trypsin/EDTA, seeded on the electrodes, and incubated for 12 h. In the experiment of single cell alignment, ECL imaging was performed in PBS containing 25 mM HEPES and 100 μM Ru(bpy)3Cl2. The exposure time of the electron multiplying charge coupled device (EMCCD) camera was 5 s.
Collective Cell Migration
PC12 cells were grown to confluency on either flat or microgrooved ITO electrodes, as described above. Then, a wound healing assay was performed to evaluate the in vitro behavior of wound gap healing on different electrodes. “Wounds” were created by scraping with the tip of a sterile pipet across the electrode surface. Cell debris was washed away, and then the culture medium was replaced with DMEM supplemented with 2% FBS. The wounded cell sheets were incubated for a certain time. At different time intervals, the images of different electrodes were captured under ECL microscopy. The concentration of HEPES was raised to 50 mM in the imaging of cell migration and the exposure time of EMCCD was increased to 10 s, while other conditions were the same as in single cell imaging.
In drug stimulation experiments, cells were preincubated with RGD (100 μM) for 10 min to competitively occupy adhesion sites, plated to electrodes, and incubated for another 12 h, followed by the wound healing assay. In order to inhibit cell cytoskeleton contractility, after the scratch, the culture medium was replaced with DMEM supplemented with 2% FBS containing blebbistatin (100 μM).
Measurements and Instrumentation
Scanning electron microscopy (SEM) images were obtained on a SU8010 field emission scanning electron microscope (Hitachi, Japan) at an accelerating voltage of 5.0 kV. Atomic force microscopy (AFM) was used to measure the height of microridges. The measurement was performed using a Dimension Icon (Veeco Corp., USA) atomic force microscope in the contact mode in air. Topographic images were recorded at the fundamental resonance frequency of the cantilever, with a typical scan rate of 1 Hz and a resolution of 256 samples per line.
For all imaging measurement, an upright microscope (Nikon, ECLIPSE LV100ND) equipped with a water immersion objective (Nikon, CFI Apo 40×, N.A. 0.8) and an electron multiplying charge coupled device (EMCCD) camera (Andor, iXon Ultra 897) was used. A homemade polydimethylsiloxane (PDMS) electrochemical cell containing 100 μM Ru(bpy)3Cl2 and 25 mM HEPES in PBS was used in a three-electrode configuration, in which a prepared electrode, a silver/silver chloride (Ag/AgCl) wire, and a platinum wire acted as the working, reference, and counter electrodes, respectively. A constant potential of 1.3 V (vs Ag/AgCl) was applied to the working electrode for ECL imaging. All images were processed by ImageJ software.
Results and Discussion
Fabrication and Characterizations of Microgrooved Electrodes
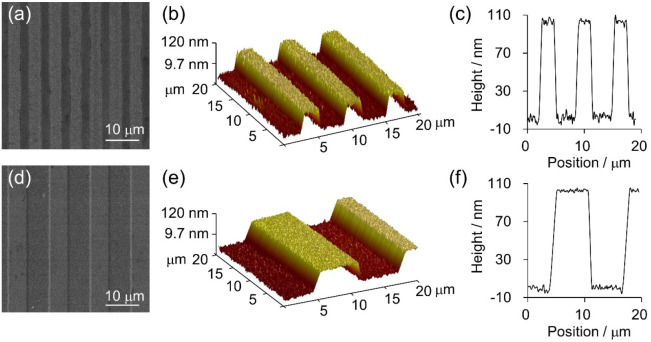
The microgrooved (MG) electrodes were prepared by laser direct writing lithography, where ridges and grooves with equal line widths of 3 or 6 μm were designed, correspondingly termed as MG3 and MG6 electrodes, respectively, for simplicity. As shown in Figure 1a,d, the surfaces of the electrodes are clean and almost free of impurity particles. The feature sizes of the MG3 electrode were 2.5 and 3.5 μm for ridge and groove widths, respectively. As for the MG6 electrode, the microgroove features are in good accordance with the design (ridge width, 5.8 μm; groove width, 6.2 μm). The heights of ridges can be controlled by the etching time, and they are approximately 100 nm as measured by atomic force microscopy (AFM; Figure 1b,c,e,f). The roughness of the fabricated electrodes is about 9 nm, which is one-tenth the height; hence the impact of roughness on cells can be ignored. Moreover, the flat electrodes were used as a control group. The surfaces of fabricated MG electrodes can provide anisotropic guidance to cells, while those of flat electrodes are isotropic and thus unable to provide guidance.
Figure 1.
(a, d) Top-view scanning electron microscopy (SEM) images of MG3 (a) and MG6 (d) electrodes. The scale bar is 10 μm. AFM 3D images (b, e) and 2D profiles (c, f) of MG3 (b, c) and MG6 (e, f) electrodes.
ECL Imaging Analysis of Contact Guidance by Grooves
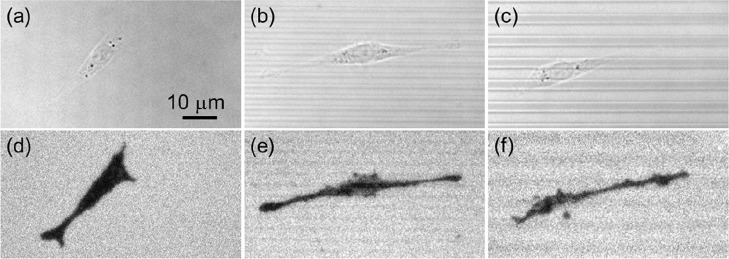
PC12 and A549 cells were selected to assess the effect of grooved topography on cell–matrix adhesions of both fibroblast-like and epithelial cells. Figure 2 and Figure S1 compare the bright field (BF) and ECL images of PC12 and A549 cells on flat, MG3, and MG6 electrodes, respectively. PC12 cells on the flat electrode display a characteristic polarized morphology without preferential orientation (Figure 2a,d). Although PC12 cells on microgrooved electrodes also show a multipolar morphology similar to those on the flat electrode, they preferentially orient along the direction of microgrooves and become more elongated than those on the flat electrode (Figure 2b,c,e,f). A549 cells on the flat electrode exhibit a round shape (Figure S1a,d), while those on microgrooved electrodes display a bipolar appearance and are obviously elongated (Figure S1b,c,e,f). A549 cells also orient apparently along the microgrooves on both MG3 and MG6 electrodes. That is, the distribution of cell–matrix adhesions is regulated by topographic signals, and both fibroblast-like and epithelial cells exhibit contact guidance on prepared electrodes.
Figure 2.
BF (a–c) and corresponding ECL images (d–f) of PC12 cells on the surface of flat (a, d), MG3 (b, e), and MG6 (c, f) electrodes. The scale bar is 10 μm. ECL images were recorded in 0.01 M PBS (pH 7.4) containing 100 μM Ru(bpy)32+ as luminophore and 25 mM HEPES as coreactant. A constant voltage of +1.3 V (vs Ag/AgCl) was applied.
To quantitatively comprehend the effect of topography on cells, we fitted the contour of each cell to an ellipse and further characterized the angle (θ) between the long axis of the cell and the microgrooves, as well as the aspect ratio (AR) defined as the ratio of the long axis to the short axis of the fitted ellipse (Figure 3a). Cells that orient parallel to the microgrooves are regarded to possess an orientation angle of 0°, and those perpendicular to the microgrooves possess an angle of +90 or −90°.
Figure 3.
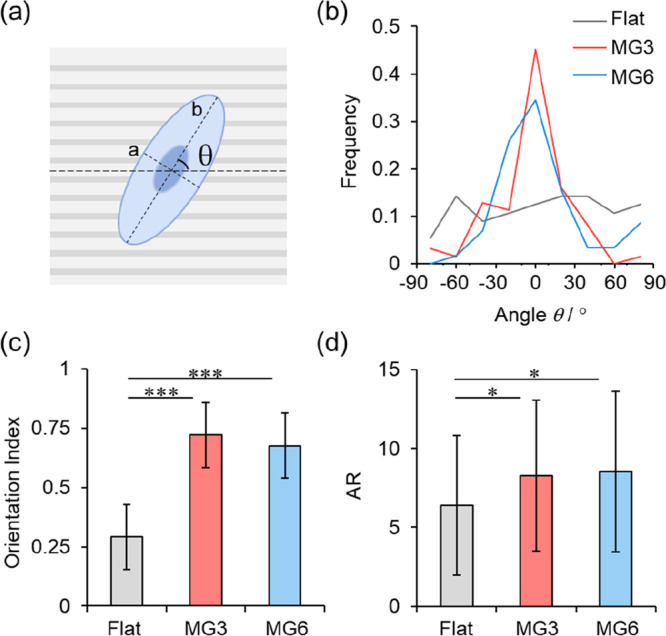
(a) Schematic illustration of definitions of orientation angle θ, long axis, and short axis of a fitted ellipse. (b–d) Distributions of orientation angle (b), orientation index (c), and AR (d) of cells on flat, MG3, and MG6 electrodes. ∗, p < 0.05; ∗∗∗, p < 0.001.
As shown in Figure 3b, PC12 cells tend to align parallel to the direction of grooves on the surface of MG electrodes, showing a large peak between −30 and +30° in the distribution of cell alignment angles. It should be noted that the full width at half-maximum (FMHM) of the angle distribution of cells on MG6 electrodes is wider than that on MG3 electrodes. In terms of MG electrodes with the same depth of grooves, a larger groove width allows alignment of cells more randomly, thus leading to a wider angle distribution on MG6 electrodes than that on MG3 electrodes. In order to quantify the degree of cell alignment, we calculated the orientation index F (eq 1) by examining the average of the second Legendre polynomial, a commonly used formula in measuring the preferential directionality in liquid crystals:48
| 1 |
The orientation index will be close to 1 if there is a strong uniformity between the direction of grooves and the cell alignment. It will be −0.5 when cells are perpendicular to the microgrooves. For a random alignment, it will approach 0. In Figure 3c, cells on microgrooved electrodes give a higher orientation index, with average orientation indexes of 0.72 and 0.68 on MG3 and MG6 electrodes, respectively. For cells on flat electrodes, the average orientation index is only 0.29.
We then compared the average of the ARs of cells on flat and microgrooved electrodes. A larger AR means that the cell tends to display a more elongated shape. The ARs of cells on MG3 and MG6 electrodes with averages of 8.27 and 8.53, respectively, are obviously larger than that on control electrodes (6.39) (Figure 3d). The adhesion area of cells on microgrooved electrodes is smaller than that on flat electrodes (Figure S2), which can be ascribed to the restriction of the microgrooves to the spreading of cells. Quantitative results of A549 cells are shown in Figure S3. A549 cells display a random orientation on the flat electrode but a directional alignment on microgrooved electrodes (Figure S3a,b). Moreover, A549 cells are obviously stretched on microgrooved electrodes as the ARs of cells increase remarkably (Figure S3c). No significant difference on cell contact guidance is found between cells cultured on MG3 and MG6 electrodes, so the following experiments are conducted on MG3 electrodes.
Collective Cell Migration on Microgrooved Electrodes
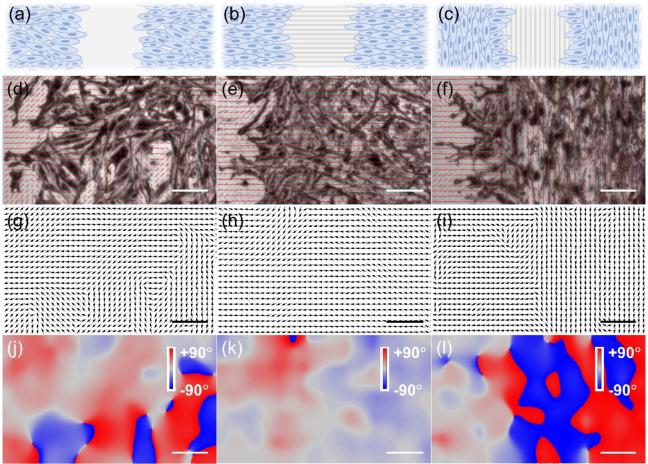
To better understand the impact of topographic cues on collective cell migration, we further investigate whether migration signals can propagate from the leading edge of cell sheet to the far side. To do this, classical wound healing assays were conducted on a continuous confluent cell sheet, which was plated on flat or microgrooved electrodes. Three experiment conditions were comparatively considered: a control group with a scratch on the flat electrode (left panels of Figure 4 and Figures S4–S8), one with a scratch perpendicular to the grooves (perpendicular condition, middle panels of Figure 4 and Figures S4–S8), and one with a scratch along the grooves (parallel condition, right panels of Figure 4 and Figures S4–S8). Under different conditions, ECL images of the whole cell sheet at different time intervals during the collective migration were recorded. Furthermore, to intuitively distinguish the orientations of cell–matrix adhesions, the vector fields overlaid in ECL images were extracted and represented as black arrows (Figure 4g–i, Figures S4d–f to S8d–f). The distribution of directions was further coded in the form of a colormap (Figure 4j–l, Figures S4g–i to S8g–i). As displayed by the color bar, red or blue in the colormap stands for the direction approaching +90 or −90°, respectively; namely, the cell orientation in this situation is parallel to the wound. Light red or light blue represents an orientation close to 0°, indicating that the cell is perpendicular to the wound; in other words, the cell migrates toward the wound.
Figure 4.
(a–c) Schematic illustration of the orientation of the wound relative to electrode topographical features. (d–f) ECL images of the monolayer of PC12 cells captured after migration for 4 h. Red short lines overlaid in ECL images show local orientations of cells, which are also shown as black arrows (g–l) and color code graphs (j–l). The left panel (d, g, j) is obtained on the flat electrode, the middle panel (e, h, k) represents the case where the orientation of the wound is perpendicular to grooves, and the right panel (f, i, l) stands for the condition in which the orientation of the wound is parallel to grooves. The scale bar in all graphs is 50 μm.
At the very beginning of migration, the orientations of cell–matrix adhesions are solely under the influence of topographic cues (Figure S4). After migration for 2 h, the leading cells on flat electrodes and those under the parallel condition have already adjusted the orientations of cell–matrix adhesions and started to migrate toward the wound. The microgrooves can facilitate the collective migration of cells under the perpendicular condition, so the cells move along the grooves directly and do not need to adjust their orientations (Figure S5).
As can be seen in Figure 4, after the scratch for 4 h, cells under three conditions all invade the region of the wound (Figure 4d–f). In particular on the flat electrode and under the parallel condition, cells in front of the cellular sheet have already turned their direction perpendicular to the wound, indicating that cells have emerged in a preferential orientation and migrated toward the wound, as displayed in the vector field (Figure 4g,i) and colormap (Figure 4j,l). As shown in Figure 4k, the color in the colormap is almost light red or light blue, meaning that the bulk of the cells under the perpendicular condition indeed orient perpendicularly to the wound. The migration processes of cells under three conditions at 8, 12, and 24 h were also recorded and analyzed (see more details in Figures S6–S8).
To determine where the transition from directed migration to contact guidance occurs, local cell orientations (represented by arrows or color codes in Figure 4) ranging from −45 to +45° are termed as preferential orientations (see the inset in Figure 5a). It implies that cells with preferential orientations have a propensity to migrate toward the wound. We then calculated the proportion of preferential orientations in the total at different positions and scaled the value between 0 (fully parallel to wound) and 100% (guided movement) (Figure 5a and Figure S9). After 4 h of migration on the flat electrode, a plateau is developed in the leading edge (gray line in Figure 5a), meaning that over 85% of cells have the tendency to move toward the wound. Almost all cells under the perpendicular condition orient toward the wound; that is, cells migrate along the microgrooves within the region of the sheet (red line in Figure 5a). As for cells under the parallel condition, the proportion of cells at the leading edge that have the propensity for directional migration approaches 100%. As the distance from the wound increases, the percentage declines rapidly to nearly 0, indicating that only leading cells have the tendency to migrate toward the wound and follower cells are still subject to microgrooves (blue line in Figure 5a).
Figure 5.
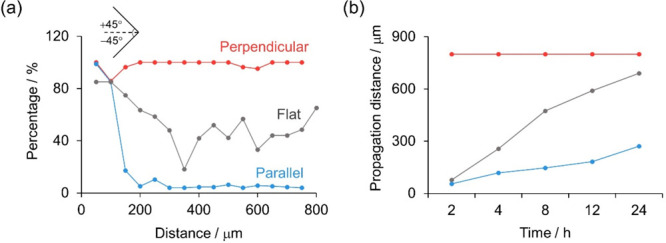
(a) Quantification of the percentage of cells that have preferential orientations toward the scratch as a function of distance from the leading edge of cell sheet after migration for 4 h. Orientations ranging from −45 to +45° are considered as preferential orientations. The percentage of preferential orientations at other times is displayed in Figure S9. (b) Time evolution of propagation distance from the leading edge of cells on flat electrodes (gray line) and cells under perpendicular (red line) and parallel (blue line) conditions. The propagation distances are quantified as the distance at which the curves in (a) and in Figure S9 reach 60%.
We define the distance at which the proportion drops to 60% as the propagation distance. The time evolution of the propagation distance of cells on different electrodes is shown in Figure 5b. Apparently, the propagation distances of cells in the control group (gray line) and parallel condition (blue line) expand with time. Nevertheless, in the parallel condition, a much smaller slope was obtained. Given the obstacle of grooved topography for cells to adjust their orientations, the directional region of cells in the parallel condition broadened more slowly than that of the control group. The propagation distance of cells under the perpendicular condition maintains 800 μm during the time of the experiment.
Actin polymerization and cell–matrix adhesions are believed to play important roles in orchestrating anisotropic traction stresses and thus driving cell alignment and directional migration.6,49 To further verify the function of the cytoskeleton and cell–matrix adhesions in both cell migration and contact guidance, we partially inhibit cytoskeleton contractility via blebbistatin (a specific inhibitor of myosin II activity) and integrin-mediated adhesions via the competitive binding of RGD (a widely used adhesion motif) to integrins. The morphological variations of cells under blebbistatin or RGD treatment are displayed in Figure S10. It can be seen that PC12 cells changed obviously into a dendritic-like shape in the presence of blebbistatin, which could reduce cell spreading, stress fiber density, and lamellipodia formation50 (Figure S10b,e). No noticeable variation of cell shape is observed after RGD treatment (Figure S10c,f). The comparisons of cell–matrix adhesion orientations are shown in Figures S11–S13 (see more details in the Supporting Information).
We further quantified the percentages of cells having the tendency of directional migration in the absence or presence of blebbistatin or RGD, as shown in Figure 6. In comparison with cells without drug treatment (Figure 5a), the percentage of preferential orientations of leading cells under blebbistatin or RGD treatment drops (Figure 6a,b), indicating that blebbistatin or RGD blunts the speed of orientation adjustment of cells. The inhibition effect is more intuitively identified in Figure 6c, as the propagation distance decreases apparently. In terms of cells cultured on the flat electrode or cells under the parallel condition, the propagation distance of cells treated with drugs drops to approximately half of that without treatment. Also, the propagation distance of cells under the perpendicular condition remains unchanged. However, blebbistatin or RGD has little effect in disrupting contact guidance of the cell monolayer. As shown in Figure S13, under the parallel condition, such inhibition allows cells at the far side of the wound to maintain parallel to the wound, meaning that those cells still follow topographic alignment. These findings prove that actin polymerization and cell–matrix adhesions play important roles in altering cell directionality and therefore affecting oriented migration but not contact guidance of fibroblast-like cells.
Figure 6.
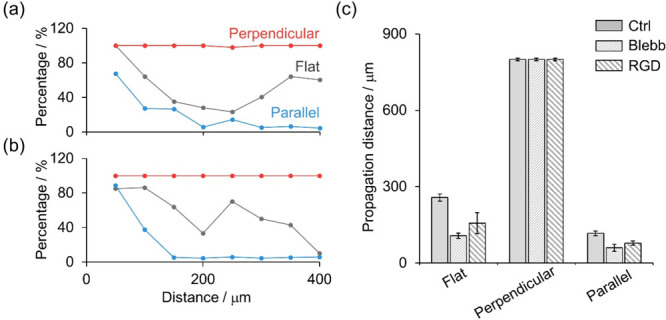
(a) Quantification of the percentage of cells that have preferential orientations as a function of the distance from the leading edge of cell sheet on flat electrodes (gray line) and under perpendicular (red line) and parallel (blue line) conditions with blebbistatin (Blebb) treatment. The percentage was calculated after migration for 4 h. (b) All conditions are the same as those in (a), except that cells were treated by RGD. (c) Comparison of propagation distances of cells with and without blebbistatin or RGD treatment.
Conclusions
In summary, the effect of topographical cues on cell–matrix adhesions and collective cell migration was studied by surface-sensitive ECL microscopy. By introducing microgrooved electrodes into the system, we first examined the guidance of topography on cell–matrix adhesions and then investigated the influence of grooves on collective cell migration and the function of the cytoskeleton and adhesions in both alignment and migration. The results showed that cell–matrix adhesions of both fibroblast-like and epithelial cells behaved in a microtopography-type dependent manner. Moreover, the microtopography could hinder cells from adjusting their orientations when the direction of grooves was perpendicular to that of directional migration, thus regulating collective cell movement, while it could accelerate cell movement if the direction of grooves was consistent with migration. Under the treatment of blebbistatin or RGD, we found that inhibiting cytoskeleton contractility or cell–matrix adhesions could attenuate the speed and region of forming preferential orientations, but had no influence on contact guidance of follower cells. This work provides insight into the effect of ECM topography in regulating cell behaviors and holds promise, as a new method, to continue to appraise the role of other physical signals in in vitro cell culture models and thus provide theoretical support for the design of implanted medical devices and tissue engineering.
Acknowledgments
This work was supported by the National Natural Science Foundation of China (Grant Nos. 22125405 and 22074131).
Supporting Information Available
The Supporting Information is available free of charge at https://pubs.acs.org/doi/10.1021/cbmi.3c00066.
BF and ECL images of A549 cells on different electrodes; area of PC12 cells quantified from ECL images; quantitative analysis of A549 cells on different electrodes; imaging collective cell migration right after the scratch and 2, 8, 12, and 24 h after the scratch; percentage of cells having preferential orientations towards the scratch at different time intervals; morphological change of cells under drug treatment; collective cell migration on flat electrodes, under perpendicular condition, and under parallel condition with drug treatment (PDF)
The authors declare no competing financial interest.
Supplementary Material
References
- Hynes R. O. The Extracellular Matrix: Not Just Pretty Fibrils. Science 2009, 326, 1216–1219. 10.1126/science.1176009. [DOI] [PMC free article] [PubMed] [Google Scholar]
- Ozbek S.; Balasubramanian P. G.; Chiquet-Ehrismann R.; Tucker R. P.; Adams J. C. The Evolution of Extracellular Matrix. Mol. Biol. Cell 2010, 21, 4300–4305. 10.1091/mbc.e10-03-0251. [DOI] [PMC free article] [PubMed] [Google Scholar]
- Watt F. M.; Huck W. T. Role of the Extracellular Matrix in Regulating Stem Cell Fate. Nat. Rev. Mol. Cell Biol. 2013, 14, 467–473. 10.1038/nrm3620. [DOI] [PubMed] [Google Scholar]
- Charras G.; Sahai E. Physical Influences of the Extracellular Environment on Cell Migration. Nat. Rev. Mol. Cell Biol. 2014, 15, 813–824. 10.1038/nrm3897. [DOI] [PubMed] [Google Scholar]
- Huang G.; Li F.; Zhao X.; Ma Y.; Li Y.; Lin M.; Jin G.; Lu T. J.; Genin G. M.; Xu F. Functional and Biomimetic Materials for Engineering of the Three-Dimensional Cell Microenvironment. Chem. Rev. 2017, 117, 12764–12850. 10.1021/acs.chemrev.7b00094. [DOI] [PMC free article] [PubMed] [Google Scholar]
- Bettinger C. J.; Langer R.; Borenstein J. T. Engineering Substrate Topography at the Micro- and Nanoscale to Control Cell Function. Angew. Chem., Int. Ed. 2009, 48, 5406–5415. 10.1002/anie.200805179. [DOI] [PMC free article] [PubMed] [Google Scholar]
- Chen C. S.; Mrksich M.; Huang S.; Whitesides G. M.; Ingber D. E. Geometric Control of Cell Life and Death. Science 1997, 276, 1425–1428. 10.1126/science.276.5317.1425. [DOI] [PubMed] [Google Scholar]
- Wang K.; Man K.; Liu J.; Meckes B.; Yang Y. Dissecting Physical and Biochemical Effects in Nanotopographical Regulation of Cell Behavior. ACS Nano 2023, 17, 2124–2133. 10.1021/acsnano.2c08075. [DOI] [PubMed] [Google Scholar]
- Driscoll M. K.; Sun X.; Guven C.; Fourkas J. T.; Losert W. Cellular Contact Guidance through Dynamic Sensing of Nanotopography. ACS Nano 2014, 8, 3546–3555. 10.1021/nn406637c. [DOI] [PMC free article] [PubMed] [Google Scholar]
- Caballero D.; Palacios L.; Freitas P. P.; Samitier J. An Interplay between Matrix Anisotropy and Actomyosin Contractility Regulates 3D-Directed Cell Migration. Adv. Funct. Mater. 2017, 27, 1702322. 10.1002/adfm.201702322. [DOI] [Google Scholar]
- Weiss P.; Garber B. Shape and Movement of Mesenchyme Cells as Functions of the Physical Structure of the Medium: Contributions to a Quantitative Morphology. Proc. Natl. Acad. Sci. 1952, 38, 264–280. 10.1073/pnas.38.3.264. [DOI] [PMC free article] [PubMed] [Google Scholar]
- Thrivikraman G.; Jagiello A.; Lai V. K.; Johnson S. L.; Keating M.; Nelson A.; Schultz B.; Wang C. M.; Levine A. J.; Botvinick E. L.; Tranquillo R. T. Cell Contact Guidance via Sensing Anisotropy of Network Mechanical Resistance. Proc. Natl. Acad. Sci. U. S. A. 2021, 118, e2024942118. 10.1073/pnas.2024942118. [DOI] [PMC free article] [PubMed] [Google Scholar]
- Barocas V. H.; Tranquillo R. T. An Anisotropic Biphasic Theory of Tissue-Equivalent Mechanics: the Interplay among Cell Traction, Fibrillar Network Deformation, Fibril Alignment, and Cell Contact Guidance. J. Biomech. Eng. 1997, 119, 137–145. 10.1115/1.2796072. [DOI] [PubMed] [Google Scholar]
- Li Y.; Xiao Y.; Liu C. The Horizon of Materiobiology: A Perspective on Material-Guided Cell Behaviors and Tissue Engineering. Chem. Rev. 2017, 117, 4376–4421. 10.1021/acs.chemrev.6b00654. [DOI] [PubMed] [Google Scholar]
- Vedula S. R.; Leong M. C.; Lai T. L.; Hersen P.; Kabla A. J.; Lim C. T.; Ladoux B. Emerging Modes of Collective Cell Migration Induced by Geometrical Constraints. Proc. Natl. Acad. Sci. 2012, 109, 12974–12979. 10.1073/pnas.1119313109. [DOI] [PMC free article] [PubMed] [Google Scholar]
- Teixeira A. I.; Abrams G. A.; Bertics P. J.; Murphy C. J.; Nealey P. F. Epithelial Contact Guidance on Well-Defined Micro- and Nanostructured Substrates. J. Cell Sci. 2003, 116, 1881–1892. 10.1242/jcs.00383. [DOI] [PMC free article] [PubMed] [Google Scholar]
- Ray A.; Lee O.; Win Z.; Edwards R. M.; Alford P. W.; Kim D. H.; Provenzano P. P. Anisotropic Forces from Spatially Constrained Focal Adhesions Mediate Contact Guidance Directed Cell Migration. Nat. Commun. 2017, 8, 14923. 10.1038/ncomms14923. [DOI] [PMC free article] [PubMed] [Google Scholar]
- Ning D.; Duong B.; Thomas G.; Qiao Y.; Ma L.; Wen Q.; Su M. Mechanical and Morphological Analysis of Cancer Cells on Nanostructured Substrates. Langmuir 2016, 32, 2718–2723. 10.1021/acs.langmuir.5b04469. [DOI] [PubMed] [Google Scholar]
- McMahon A.; Reeves G. T.; Supatto W.; Stathopoulos A. Mesoderm Migration in Drosophila is a Multi-Step Process Requiring FGF Signaling and Integrin Activity. Development 2010, 137, 2167–2175. 10.1242/dev.051573. [DOI] [PMC free article] [PubMed] [Google Scholar]
- Friedl P.; Gilmour D. Collective Cell Migration in Morphogenesis, Regeneration and Cancer. Nat. Rev. Mol. Cell Biol. 2009, 10, 445–457. 10.1038/nrm2720. [DOI] [PubMed] [Google Scholar]
- Downing T. L.; Soto J.; Morez C.; Houssin T.; Fritz A.; Yuan F.; Chu J.; Patel S.; Schaffer D. V.; Li S. Biophysical Regulation of Epigenetic State and Cell Reprogramming. Nat. Mater. 2013, 12, 1154–1162. 10.1038/nmat3777. [DOI] [PMC free article] [PubMed] [Google Scholar]
- Brugues A.; Anon E.; Conte V.; Veldhuis J. H.; Gupta M.; Colombelli J.; Munoz J. J.; Brodland G. W.; Ladoux B.; Trepat X. Forces Driving Epithelial Wound Healing. Nat. Phys. 2014, 10, 683–690. 10.1038/nphys3040. [DOI] [PMC free article] [PubMed] [Google Scholar]
- Wirtz D.; Konstantopoulos K.; Searson P. C. The Physics of Cancer: The Role of Physical Interactions and Mechanical Forces in Metastasis. Nat. Rev. Cancer 2011, 11, 512–522. 10.1038/nrc3080. [DOI] [PMC free article] [PubMed] [Google Scholar]
- Fedele C.; Mantyla E.; Belardi B.; Hamkins-Indik T.; Cavalli S.; Netti P. A.; Fletcher D. A.; Nymark S.; Priimagi A.; Ihalainen T. O. Azobenzene-Based Sinusoidal Surface Topography Drives Focal Adhesion Confinement and Guides Collective Migration of Epithelial Cells. Sci. Rep. 2020, 10, 15329. 10.1038/s41598-020-71567-w. [DOI] [PMC free article] [PubMed] [Google Scholar]
- Caballero D.; Samitier J. Topological Control of Extracellular Matrix Growth: A Native-Like Model for Cell Morphodynamics Studies. ACS Appl. Mater. Interfaces 2017, 9, 4159–4170. 10.1021/acsami.6b13063. [DOI] [PubMed] [Google Scholar]
- Kwon C.; Kim Y.; Jeon H. Collective Migration of Lens Epithelial Cell Induced by Differential Microscale Groove Patterns. J. Funct. Biomater. 2017, 8 (3), 34. 10.3390/jfb8030034. [DOI] [PMC free article] [PubMed] [Google Scholar]
- Teixeira A. I.; McKie G. A.; Foley J. D.; Bertics P. J.; Nealey P. F.; Murphy C. J. The Effect of Environmental Factors on the Response of Human Corneal Epithelial Cells to Nanoscale Substrate Topography. Biomaterials 2006, 27, 3945–3954. 10.1016/j.biomaterials.2006.01.044. [DOI] [PMC free article] [PubMed] [Google Scholar]
- Brunette D. M. Spreading and Orientation of Epithelial Cells on Grooved Substrata. Exp. Cell Res. 1986, 167, 203–217. 10.1016/0014-4827(86)90217-X. [DOI] [PubMed] [Google Scholar]
- Richter M. M. Electrochemiluminescence (ECL). Chem. Rev. 2004, 104, 3003–3036. 10.1021/cr020373d. [DOI] [PubMed] [Google Scholar]
- Miao W. Electrogenerated Chemiluminescence and its Biorelated Applications. Chem. Rev. 2008, 108, 2506–2553. 10.1021/cr068083a. [DOI] [PubMed] [Google Scholar]
- Guo W.; Liu Y.; Cao Z.; Su B. Imaging Analysis Based on Electrogenerated Chemiluminescence. J. Anal. Test. 2017, 1, 14. 10.1007/s41664-017-0013-9. [DOI] [Google Scholar]
- Zhou J.; Ma G.; Chen Y.; Fang D.; Jiang D.; Chen H. Y. Electrochemiluminescence Imaging for Parallel Single-Cell Analysis of Active Membrane Cholesterol. Anal. Chem. 2015, 87, 8138–8143. 10.1021/acs.analchem.5b00542. [DOI] [PubMed] [Google Scholar]
- Xu J. J.; Huang P. Y.; Qin Y.; Jiang D. C.; Chen H. Y. Analysis of Intracellular Glucose at Single Cells Using Electrochemiluminescence Imaging. Anal. Chem. 2016, 88, 4609–4612. 10.1021/acs.analchem.6b01073. [DOI] [PubMed] [Google Scholar]
- He R.; Tang H.; Jiang D.; Chen H. Y. Electrochemical Visualization of Intracellular Hydrogen Peroxide at Single Cells. Anal. Chem. 2016, 88, 2006–2009. 10.1021/acs.analchem.6b00150. [DOI] [PubMed] [Google Scholar]
- Zhang J.; Jin R.; Jiang D.; Chen H. Y. Electrochemiluminescence-Based Capacitance Microscopy for Label-Free Imaging of Antigens on the Cellular Plasma Membrane. J. Am. Chem. Soc. 2019, 141, 10294–10299. 10.1021/jacs.9b03007. [DOI] [PubMed] [Google Scholar]
- Cao J. T.; Wang Y. L.; Zhang J. J.; Dong Y. X.; Liu F. R.; Ren S. W.; Liu Y. M. Immuno-Electrochemiluminescent Imaging of a Single Cell Based on Functional Nanoprobes of Heterogeneous Ru(bpy)32+@SiO2/Au Nanoparticles. Anal. Chem. 2018, 90, 10334–10339. 10.1021/acs.analchem.8b02141. [DOI] [PubMed] [Google Scholar]
- Wang N.; Gao H.; Li Y.; Li G.; Chen W.; Jin Z.; Lei J.; Wei Q.; Ju H. Dual Intramolecular Electron Transfer for in Situ Coreactant-Embedded Electrochemiluminescence Microimaging of Membrane Protein. Angew. Chem., Int. Ed. 2021, 60, 197–201. 10.1002/anie.202011176. [DOI] [PubMed] [Google Scholar]
- Zhang H.; Gao W.; Liu Y.; Sun Y.; Jiang Y.; Zhang S. Electrochemiluminescence-Microscopy for Microrna Imaging in Single Cancer Cell Combined with Chemotherapy-Photothermal Therapy. Anal. Chem. 2019, 91, 12581–12586. 10.1021/acs.analchem.9b03694. [DOI] [PubMed] [Google Scholar]
- Valenti G.; Scarabino S.; Goudeau B.; Lesch A.; Jovic M.; Villani E.; Sentic M.; Rapino S.; Arbault S.; Paolucci F.; Sojic N. Single Cell Electrochemiluminescence Imaging: From the Proof-of-Concept to Disposable Device-Based Analysis. J. Am. Chem. Soc. 2017, 139, 16830–16837. 10.1021/jacs.7b09260. [DOI] [PubMed] [Google Scholar]
- Zhou Y.; Dong J.; Zhao P.; Zhang J.; Zheng M.; Feng J. Imaging of Single Bacteria with Electrochemiluminescence Microscopy. J. Am. Chem. Soc. 2023, 145, 8947–8953. 10.1021/jacs.2c13369. [DOI] [PubMed] [Google Scholar]
- Ma C.; Wu S.; Zhou Y.; Wei H. F.; Zhang J.; Chen Z.; Zhu J. J.; Lin Y.; Zhu W. Bio-Coreactant-Enhanced Electrochemiluminescence Microscopy of Intracellular Structure and Transport. Angew. Chem., Int. Ed. 2021, 60, 4907–4914. 10.1002/anie.202012171. [DOI] [PubMed] [Google Scholar]
- Ma Y.; Colin C.; Descamps J.; Arbault S.; Sojic N. Shadow Electrochemiluminescence Microscopy of Single Mitochondria. Angew. Chem., Int. Ed. 2021, 60, 18742–18749. 10.1002/anie.202105867. [DOI] [PubMed] [Google Scholar]
- Ding H.; Guo W.; Su B. Imaging Cell-Matrix Adhesions and Collective Migration of Living Cells by Electrochemiluminescence Microscopy. Angew. Chem., Int. Ed. 2020, 59, 449–456. 10.1002/anie.201911190. [DOI] [PubMed] [Google Scholar]
- Ding H.; Zhou P.; Fu W.; Ding L.; Guo W.; Su B. Spatially Selective Imaging of Cell-Matrix and Cell-Cell Junctions by Electrochemiluminescence. Angew. Chem., Int. Ed. 2021, 60, 11769–11773. 10.1002/anie.202101467. [DOI] [PubMed] [Google Scholar]
- Li B.; Huang X.; Lu Y.; Fan Z.; Li B.; Jiang D.; Sojic N.; Liu B. High Electrochemiluminescence from Ru(bpy)32+ Embedded Metal-Organic Frameworks to Visualize Single Molecule Movement at the Cellular Membrane. Adv. Sci. 2022, 9, 2204715. 10.1002/advs.202204715. [DOI] [PMC free article] [PubMed] [Google Scholar]
- Chen M. M.; Xu C. H.; Zhao W.; Chen H. Y.; Xu J. J. Single Cell Imaging of Electrochemiluminescence-Driven Photodynamic Therapy. Angew. Chem., Int. Ed. 2022, 61, e202117401. 10.1002/anie.202117401. [DOI] [PubMed] [Google Scholar]
- Nuhn J. A. M.; Perez A. M.; Schneider I. C. Contact Guidance Diversity in Rotationally Aligned Collagen Matrices. Acta Biomater. 2018, 66, 248–257. 10.1016/j.actbio.2017.11.039. [DOI] [PMC free article] [PubMed] [Google Scholar]
- Leclerc A.; Tremblay D.; Hadjiantoniou S.; Bukoreshtliev N. V.; Rogowski J. L.; Godin M.; Pelling A. E. Three Dimensional Spatial Separation of Cells in Response to Microtopography. Biomaterials 2013, 34, 8097–8104. 10.1016/j.biomaterials.2013.07.047. [DOI] [PubMed] [Google Scholar]
- Ladoux B.; Mege R. M. Mechanobiology of Collective Cell Behaviours. Nat. Rev. Mol. Cell Biol. 2017, 18, 743–757. 10.1038/nrm.2017.98. [DOI] [PubMed] [Google Scholar]
- Liu Z.; van Grunsven L. A.; Van Rossen E.; Schroyen B.; Timmermans J. P.; Geerts A.; Reynaert H. Blebbistatin Inhibits Contraction and Accelerates Migration in Mouse Hepatic Stellate Cells. Br. J. Pharmacol. 2010, 159, 304–315. 10.1111/j.1476-5381.2009.00477.x. [DOI] [PMC free article] [PubMed] [Google Scholar]
Associated Data
This section collects any data citations, data availability statements, or supplementary materials included in this article.


