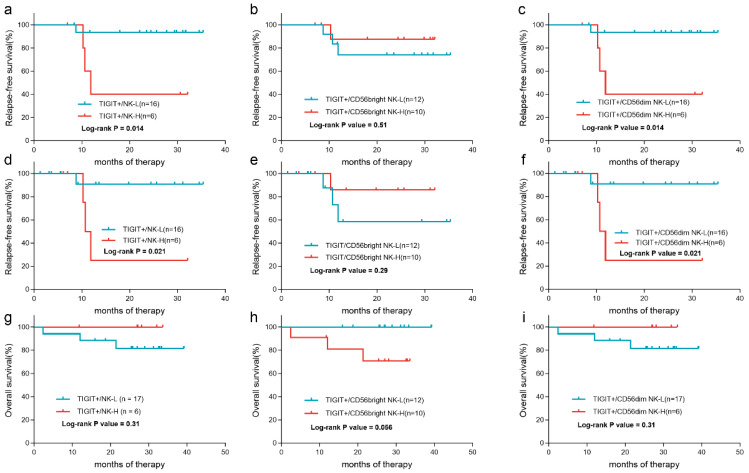
Figure 6.
The impact of the expression of TIGIT on NK cells on patient outcomes. The RFS curves of patients grouped by the frequencies of TIGIT+ cells in total NK cells (a), CD56bright NK cells (b), and CD56dim NK cells (c). The RFS curves of patients censoring at the time of allo-HSCT grouped by the frequencies of TIGIT+ cells in total NK cells (d), CD56bright NK cells (e), and CD56dim NK cells (f). The OS curves of patients grouped by the frequencies of TIGIT+ cells in total NK cells (g), CD56bright NK cells (h), and CD56dim NK cells (i).

