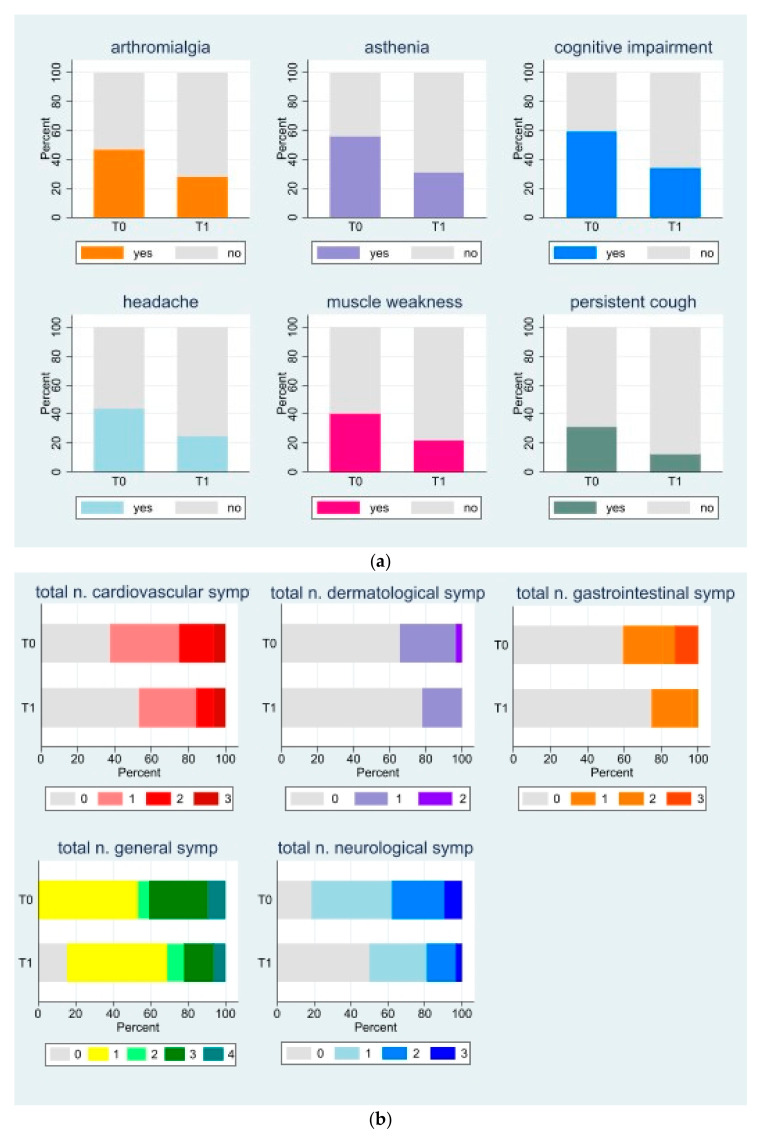
Figure 3.
(a). Stacked bar graph of long-COVID symptoms, which significantly decreased from T0 to T1. For complete results, see Supplementary Table S2. (b). Stacked bar graph of total number of long-COVID symptoms by system/apparatus at T0 and T1. See Supplementary Table S3 for full results.

