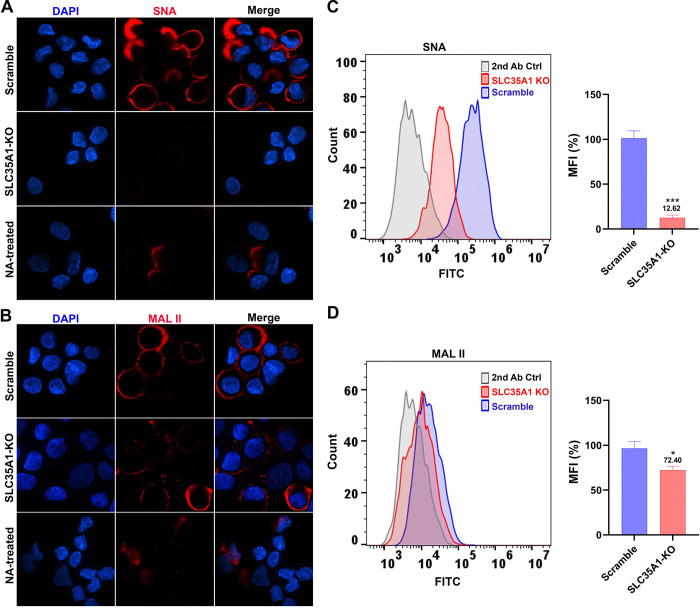
Figure 4. SIA expression in HAE-ALI cultures differentiated from SLC35A1 KO cells.
(A&B) Confocal microscopy. SNA (A) and MALII (B) lectins were used to stain glycan expression in HAE-ALISLC35A1-KO cultures. NA-treated cultures served as a positive control to show the removal of sialic acids. DyLight 649-conjugated streptavidin was used to visualize the staining under a confocal microscope at × 60 (CSU-W1 SoRa). (C&D) Flow cytometry of lection-stained cells dissociated from ALI cultures. (C) biotinylated SNA and (D) MAL II lectins were used to stain the cell surface, followed by FITC-conjugated streptavidin for detection. The histograms show the intensity of the FITC staining on the x-axis and the number of cells at each intensity level on the y-axis. The mean fluorescence intensity (MFI) values were calculated, normalized to the WT HEK293 cells. And the percentages (%) are shown with a mean and SD from three replicates. P values as indicated were determined by using the Student’s t-test.

