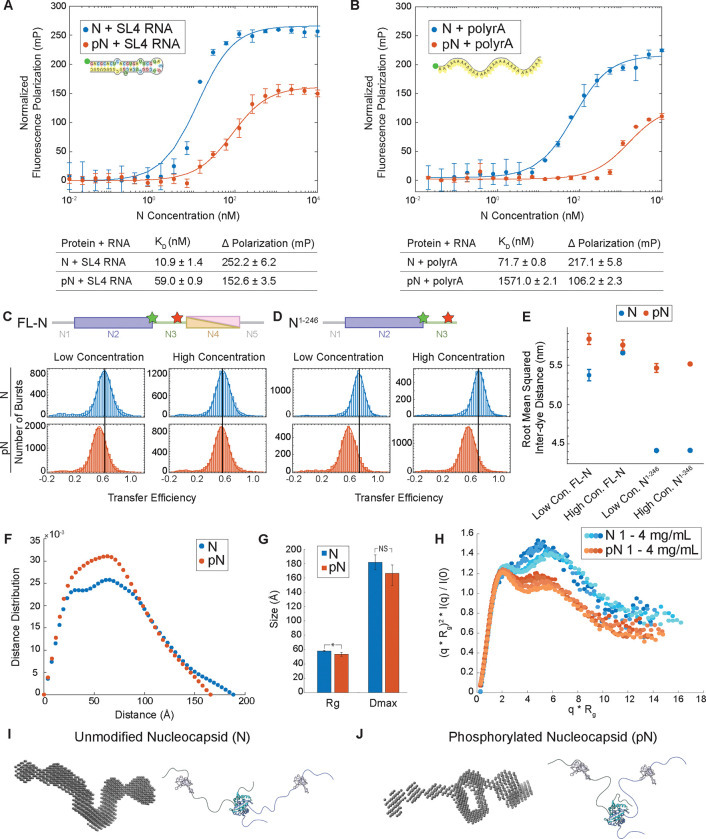
Figure 5: N protein phosphorylation weakens RNA binding affinity due to change in protein conformation.
A) Quantification of binding affinity between N vs. pN and the viral stem loop 4 RNA (SL4) based on a change in normalized fluorescence polarization (minimum polarization set to 0). n = 3 independent trials. B) Quantification of binding affinity between N vs. pN and unstructured 30 base polyrA from normalized fluorescence polarization. n = 3 independent trials. C) Representative distributions of transfer efficiency for full-length N (top) and pN (bottom) at low concentration (100 pM labeled protein) and high concentration (100 pM labeled protein + 1 μM unlabeled protein) with fluorescent dyes flanking the linker region at residues 172 and 245. D) Representative distributions of transfer efficiency for N1−246 (top) and pN1−246 (bottom) at low concentration (100 pM labeled protein) and high concentration (100 pM labeled protein + 4 μM unlabeled protein) with fluorescent dyes flanking the linker region at residues 172 and 245. E) Root mean squared inter-dye distance obtained from the mean transfer efficiencies for unmodified and phosphorylated full-length N and N1–246. F) Representative pairwise interatomic distance distribution P(r) derived from SAXS for N and pN. N or pN concentration = 3 mg /mL. G) The maximum distance (Dmax) and radius of gyration (Rg) for N and pN derived from the pair distance distributions. p values were determined using two-sided student’s t-test; asterisk indicates p < 0.05. H) Normalized Kratky plot comparing the scattering of N vs. pN, indicating a structural change has occurred due to phosphorylation. Concentrations shown for N or pN are 1, 1.5, 3, and 4 mg/mL from lighter to darker. I) Bead model representation for the N dimer developed from SAXS results (left) and hypothesized conformation of N (right). J) Bead model representation for the pN dimer developed from SAXS results (left) and hypothesized conformation of pN highlighting new intermolecular interactions (right). Error bars represent one standard deviation (±1 s.d.).

