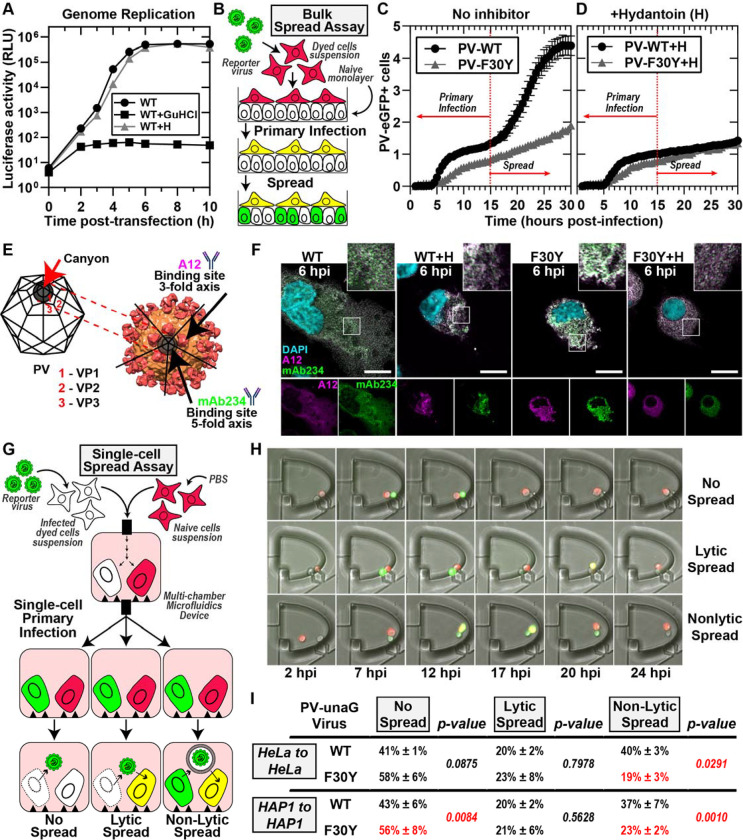
Figure 2. PV 3CD contributes to virion morphogenesis and non-lytic spread.
(A) PV genome replication in the presence of GuHCl and hydantoin. PV sub-genomic replicon luciferase assay. HeLa cells were transfected with a WT PV replicon. in the presence and absence of 3mM GuHCl or 50 μg/mL hydantoin. Luciferase activity was measured as a surrogate for genome replication by relative light unit (RLU) from the collected lysates at the stated times/conditions. (B) Bulk spread assay schematic. HeLa cells in suspension were stained using a membrane dye and infected with a green fluorescence PVeGFPpv reporter variant. MOI of 5-infected dyed cells (red) were washed and seeded on top of a naïve HeLa cell monolayer. Fluorescence is monitored over time to detect both primary and secondary infections. Primary infected cells were observed and depicted in yellow when green (eGFP expression) and red signal (cell dye) colocalized. Spread was detected when a secondary wave of PV green fluorescence signal (green only) originating from the newly infected monolayer of unstained cells was observed. (C) PV eGFPpv and F30Y PV eGFPpv bulk spread. The graph depicts the number of eGFP-positive cells in a bulk spread assay performed as described in panel (B). Using WT virus, the initial infection led to a spread event that increased the number of eGFP-positive cells (originating from secondary infections) observed after 15 hpi when the naive monolayer expressed eGFP signal (spread). F30Y PV eGFPpv inhibited spread, as observed from a lack of a secondary wave eGFP signal. The data was normalized for the respective WT and F30Y eGFP infectivities. (D) Bulk spread assay assessing the impact of hydantoin on PV spread. The graph depicts the number of eGFP-positive cells in a bulk spread assay performed in the presence of 50 μg/mL hydantoin. (E) PV structure and A12/mAb234 antibody illustrations. WT PV icosahedron (left) and structure (right) illustrations indicate A12 and mAb234 antibodies-specific binding. A12 binds at the denoted 3-fold axis at the intersection of VP1, VP2, and VP3. MAb234 binds at the 5-fold axis where the canonical “canyon” is located. (F) Confocal immunofluorescence imaging of A12 and MAb234 in PV-infected HeLa cells. Images illustrate representative immunofluorescence image fields of WT- and F30Y-infected HeLa cells (MOI of 10) in the presence and absence of hydantoin. Cells were fixed and immunostained under the labeled conditions 6 hours post-infection (hpi). Fixed cells were immunostained using specific A12 (magenta) and mAb234 (green) antibodies. DAPI-stained nuclei are shown (cyan). The top panels show A12, mAb234, and DAPI fluorescence overlays. The bottom single panels show A12 and mAb234 fluorescence separately. (G) Single-cell spread assay schematic. Cells in suspension infected with a reporter PV-unaGpv virus variant (green). Infected cells were paired with stained uninfected cells (red) in isolated chambers of a multi-chamber microfluidics polyvinylidene fluoride (PVDF) device. In this study, this device was modified to harbor cell pairs. Fluorescence is monitored over time to detect an initial wave of infected cells expressing green fluorescence., yielding a yellow fluorescence overlay (see yellow cells). Spread was detected when a secondary wave of green fluorescence signal was observed in red-dyed cells, producing a colocalized yellow signal. Spread events were further extrapolated into no-spread, lytic spread, and non-lytic spread. In no spread, no secondary infection signal was detected after a primary cell green fluorescence signal. In lytic spread, the secondary infection signal arose after losing the primary cell green fluorescence (lysis). In non-lytic spread, the secondary infection signal was detected while green fluorescence was still present in the primary infected cell. (H) Epifluorescence imaging of single-cell pairs. Representative fluorescence images of chambers harboring cell pairs in a single-cell spread assay. The panels describe each spread scenario described in (G). (I) WT and F30Y unaGpv single cell spread assay. In this single-cell spread assay, HeLa or HAP1 cells were infected with either WT or F30YunaGpv at an MOI of 5 and paired with uninfected stained cells (red). No spread, lytic, and non-lytic events are quantified as percentages of the total number of events. The values are represented as mean ± standard error (SEM) from an n=3. Significant differences between conditions were noted based on a student’s t-test with p-values below 0.05.

