Abstract
IA-2 is an enzymatically inactive member of the transmembrane protein tyrosine phosphate family located in dense core secretory vesicles and a major autoantigen in type 1 diabetes. Recent studies showed that targeted disruption of the IA-2 gene in mice resulted in impairment of insulin secretion and glucose intolerance. Insulin homeostasis, however, is a complex process involving a cascade of regulatory factors, and IA-2 is widely expressed in neuroendocrine cells throughout the body. Consequently, it is uncertain whether the impairment of insulin secretion in IA-2 knockout mice is a direct result of the knockout of IA-2 in beta cells or to counter regulatory alterations resulting from IA-2 knockout in other neuroendocrine cells. To define the function of IA-2, we studied the secretion of insulin in a single cell type, MIN-6, by overexpressing and knocking down IA-2. Our experiments showed that overexpression of IA-2 resulted in a 6-fold increase in glucose- or K+-induced insulin secretion and a ≈3-fold increase in the number of secretory vesicles and the insulin content of cells. In contrast, knockdown of endogenous IA-2 by short interfering RNA resulted in nearly a complete loss of glucose-induced insulin secretion and a 50% decrease in basal insulin release. The half-life of insulin in cells overexpressing IA-2 was nearly twice as great as that in mock-transfected cells, suggesting that IA-2 was stabilizing the insulin-containing vesicles. From these results we conclude that in beta cells, IA-2 is an important regulator of dense core vesicle number and glucose-induced and basal insulin secretion.
Keywords: beta cells, MIN-6 cells, short interfering RNA, glucose
The transmembrane protein tyrosine phosphatase (PTP) molecule IA-2 is located on chromosome 2q35 (1, 2). Because of two amino acid substitutions in the conserved PTP core domain, IA-2 is enzymatically inactive with known PTP substrates. The protein is 979 aa in length and consists of an extracellular (intraluminal) domain (amino acids 27-576), transmembrane region (amino acids 577-600), and intracellular domain (amino acids 601-979). Immunofluorescence and EM studies showed that IA-2 is present in neuroendocrine cells throughout the body and is an integral component of dense core secretory vesicles (3). IA-2 belongs to an ancient gene family dating back 500 million years with homologs in Drosophila and Caenorhabditis elegans showing 58% and 46% identity, respectively, to human IA-2 (4). In mice the IA-2 homolog is 97% identical to human IA-2 (5).
IA-2 has been of particular interest at the human level because it is a major autoantigen in type 1 diabetes. Up to 70% of newly diagnosed patients have autoantibodies to IA-2 (6-12). These autoantibodies appear years before the development of clinical disease, and in individuals with autoantibodies to both IA-2 and glutamic acid decarboxylase (GAD65), the likelihood of developing type 1 diabetes within 5 years is 50% or more. Thus, autoantibodies to IA-2 in combination with autoantibodies to GAD65 are being widely used as predictive markers to enter high-risk subjects into therapeutic intervention trials (13).
The function of IA-2, however, has remained unclear. Although recent studies have shown that the targeted deletion of the IA-2 gene results in mild impairment of both insulin secretion and glucose tolerance tests (14), the widespread distribution of IA-2 in many different neuroendocrine cells throughout the body has made it difficult to determine whether these abnormalities are the direct or indirect result of IA-2 knockout in beta cells. In the current experiments, to define the role of IA-2 we used the glucose-sensitive cloned mouse beta cell line, MIN-6, in which we overexpressed and knocked down the different IA-2 domains, measured glucose- and K+-induced insulin secretion, and determined the number and content of insulin vesicles in the beta cells.
Materials and Methods
Reagents. Cell culture reagents were purchased from BioSource International (Camarillo, CA). pCMV-Tag3 mammalian expression vector with G418 resistance gene was from Stratagene; a mouse insulin ELISA kit was from ALPCO Diagnostic (Windham, NH); Effectene transfection reagent and TransMessenger transfection reagent were from Qiagen (Santa Clarita, CA); mouse IA-2 mAb was from LAD (Berlin); anti-IA-2β polyclonal Ab was from GenWay (San Diego); mouse α-tubulin mAb was from Sigma; anti-cMyc mAb was from Cell Signaling Technology (Beverly, MA); antiinsulin polyclonal Ab was from Abcam (Cambridge, MA); and antisynaptotagmin mAb and anti-VAMP2 polyclonal Ab were from QED Bioscience (San Diego).
Plasmids. Primers for IA-2 cDNA were synthesized by Integrated DNA Technology (Coralville, IA). The forward and reverse primer sequences used were: for IA-2EC, 5′-GGAATTCAGCAGCCGCCCGGGGGGC-3′ and 5′-CCGCTCGAGCAAGATTTGGAGCCCTGT-3′; for IA-2IC, 5′-GGAATTCGTGCGGCAGCATGCGCGG-3′ and 5′-CCGCTCGAGTCACTGGGGCAGGGCCTT-3′; and for IA-2F, 5′-GGAATTCAGCAGCCGCCCGGGGGGC-3′ and 5′-CCGCTCGAGTCACTGGGGCAGGGCCTT-3′. PCRs were performed as described (15). PCR products were inserted into pCMV-Tag3 vectors at EcoRI and XhoI sites. All IA-2-inserted plasmids were sequenced, and no mutations were found.
Establishment of Stable Cell Lines. MIN-6 cells were maintained in DMEM containing 25 mM d-glucose (high glucose), supplemented with 15% heat-inactivated FBS, 100 units/ml penicillin, and 100 μg/ml streptomycin at 37°C in 95% air and 5% CO2. The extracellular domain (IA-2EC) (amino acids 27-550), the intracellular domain (IA-2IC) (amino acids 600-979), and the full length of IA-2 (IA-2F) (amino acids 1-979) were subcloned into pCMV-Tag3 vectors and introduced into MIN-6 cells by using Effectene transfection reagent. After 6-8 wk in culture, stably transfected cells were selected in high glucose (25 mM) medium containing 500 μg/ml G418. G418-resistant single clones were obtained by limiting dilution, and IA-2 expression was confirmed by Western blot. pCMV-Tag3 vector itself (mock) also was transfected into MIN-6 cells, and single clones were selected by the same method.
Construction of Short Interfering RNAs (siRNAs) and Transfection. IA-2 siRNA and nonsilencing siRNA were prepared by Qiagen. Target sequences were derived from the cDNA sequences of human and mouse IA-2: 5′-AAGTCTGTATTCAGGATGGCTT-3′, corresponding to nucleotides 152-173 of human IA-2 mRNA and nucleotides 206-227 of mouse mRNA. Nonsilencing siRNA target (random sequence) was 5′-AATTCTCCGAACGTGTCACGTT-3′. All primers sequences were subjected to blast searches to ensure that there were no matches with known sequence of other genes. A total of 6 × 10⁵ nontransfected MIN-6 cells, MIN-6 mock-transfected cells, and MIN-6 IA2F-transfected cells were seeded in six-well culture plates 24 h before transfection with 2 μg of IA-2 siRNA or 2 μg of nonsilencing siRNA by TransMessenger transfection reagent.
Western Blot. Cells were washed twice with PBS, detached from plates with trypsin-EDTA, collected, washed two more times with ice-cold PBS, and then sonicated in lysis buffer. Equivalent amounts of protein were resolved by SDS/PAGE on 4-12% acrylamide gels (Invitrogen) and transferred to poly(vinylidene difluoride) membranes, followed by immunoblotting with antibodies to IA-2, α-tubulin, and c-Myc.
Insulin Secretion Test. Glucose and potassium (K+) induced insulin secretion (16, 17). MIN-6 cells were seeded in 96-well culture plates at a density of 3 × 10⁴ cells per well and cultured for 3 days. The attached cells were washed twice with 3 mM glucose or 5.6 mM K+ Krebs-Ringer's solution bicarbonate Hepes (KRBH) buffer (124 mM NaCl/5.6 mM KCl/2.5 mM CaCl2/20 mM Hepes at pH 7.4). The cells then were incubated at 37°C for 60 min in KRBH buffer, washed, and incubated again for 60 min in KRBH at low concentrations of glucose (3 mM) or K+ (5.6 mM). Supernatant was collected and insulin release was measured with an ELISA kit (ALPCO Diagnostics). The cells then were incubated at 25 mM glucose or 50 mM of K+ in KRBH for 60 min, and the amount of insulin released was measured again.
Insulin Content. Cells were seeded in six-well culture plates at a density of 1 × 10⁶ cells per well and cultured for 3 days in 25 mM glucose. Media then were removed and replaced again with 25 mM glucose. The cells were incubated for 16 h, and the insulin content was determined by ELISA (18).
EM. Cells were cultured in 25 mM glucose for 3 days. The culture media then were replaced with 3 mM low glucose containing media or 25 mM high glucose containing media for 16 h. Cells were washed with PBS three times and fixed with 2.5% glutaraldehyde in 0.1 M phosphate buffer, pH 7.4, and used for EM study as described (19, 20).
Quantification of Insulin Vesicles per Cytoplasmic Area. Ten cells were selected at random, and the images were taken at 8K magnification. The number of vesicles per cytoplasmic area was quantified with the operator blind to status. Approximately 18 cytoplasmic areas were estimated.
Insulin Half-Life. Insulin half-life was determined as described (21, 22) with slight modification. MIN-6 cells were seeded in six-well culture plates and incubated for 2 days in 25 mM high glucose to obtain a steady state. The cells then were washed with KRBH buffer and incubated in 25 mM high glucose-leucine-free media with [3H]leucine (Amersham Pharmacia) for 24 h. The media then was changed to 3 mM low glucose without [3H]leucine for a 48-h chase. The cells and supernatant were collected at different times, and the cells were lysed by repeated freezing and thawing. The cell lysates and supernatants were incubated at 4°C for 2 h in the presence of antiinsulin antibody. Antibody-antigen complexes then were precipitated by adding 5 mg of protein A-Sepharose in 100 μl of glycine/BSA/Nonidet P-40 buffer. After mixing at 4°C for 2 h, the immunoreactive material bound to the protein A-Sepharose was separated from unbound material in the supernatant by centrifugation (8,000 × g, 30 s). After washing the precipitates twice with 250 μl of glycine/BSA/Nonidet P-40, the precipitants were suspended in 250 μl of 1 M acetic acid and 2.5 mg/ml of BSA. The suspended precipitates were added to liquid scintillation vials, the activity ratios were measured, and the insulin half-life was determined. Incorporation of [3H]leucine into total protein under high glucose over 24 h was determined by precipitation with trichloroacetic acid (TCA). The data are expressed as the ratio of radiolabeled insulin/TCA-precipitated protein.
FACS Analysis. Cells incubated for 3 days at the high glucose concentration (25 mM) in six-well culture plates were collected and washed twice with ice-cold PBS. The average cell size of mock- and IA-2F-transfected MIN-6 cells then were analyzed by FACS (Becton Dickinson) as described (23).
Statistical Analysis. All data are expressed as mean ± standard error. The Student t test was used to determine statistical significance.
Results
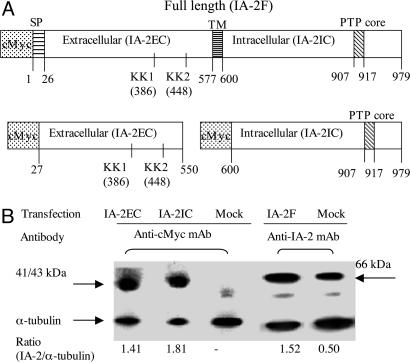
IA-2 Overexpression in MIN-6 Cells. The full length of IA-2 (IA-2F) (amino acids 1-979), the extracellular (intraluminal) domain of IA-2 (IA-2EC) (amino acids 27-550), or the intracellular domain of IA-2 (IA-2IC) (amino acids 600-979) (Fig. 1A) were transfected into MIN-6 beta cells. G418 selection and limiting dilution resulted in the establishment of stable cell lines. Western blot analysis with antibody to c-Myc showed that cells transfected with IA-2EC or IA-2IC expressed the expected 41- and 43-kDa proteins, respectively. Mock-transfected cells did not stain with antibody to c-Myc (Fig. 1B). In beta cells, IA-2 is cleaved immediately after the signal peptide (amino acid 26), resulting in the loss of c-Myc, and after the first KK site (amino acid 386), resulting in a 66-kDa protein (Fig. 1B) (24, 25). For this reason a mAb to the 66-kDa protein was used to detect overexpressed IA-2F and endogenous IA-2 (mock-transfected) rather than an antibody to c-Myc.
Fig. 1.
IA-2 overexpression in MIN-6 cells. (A) IA-2 vector constructs: full length (IA-2F), extracellular domain (IA-2EC), and intracellular domain (IA-2IC). SP, signal peptides; TM, transmembrane domain; PTP, PTP core domain. (B) Western blot analysis showing overexpression of IA-2EC, IA-2IC, and IA-2F proteins.
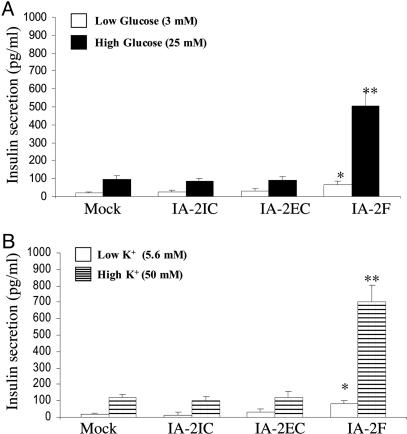
Effect of High Concentration of Glucose or K+ on Insulin Secretion from IA-2F-Transfected MIN-6 Cells. To determine whether overexpression of IA-2F or its different domains influenced insulin secretion, MIN-6 cells were stimulated with a high concentration of glucose or by depolarization with K+. Cells transfected with IA-2F secreted five to six times more insulin than mock-, IA-2IC-, or IA-2EC-transfected cells (P < 0.01) when stimulated with a high concentration of glucose (Fig. 2A). Similarly, MIN-6 cells transfected with IA-2F secreted about six times more insulin than mock-, IA-2IC-, or IA-2EC-transfected cells (P < 0.01) when stimulated with a high concentration of K+ (Fig. 2B). The basal level of insulin secretion also was somewhat higher in MIN-6 cells transfected with IA-2F and kept at a low concentration of glucose or K+ than mock-transfected cells (P < 0.05) (Fig. 2). No difference, however, was found in the amount of insulin secreted by MIN-6 cells transfected with IA-2IC or IA-2EC as compared with mock-transfected MIN-6 cells at either a low or high concentration of glucose or K+.
Fig. 2.
Effect of high concentration of glucose (A) or K+ (B) on insulin secretion in mock- and I17-2-transfected cells. *, P < 0.05; **, P < 0.01. Mean ± SEM of three separate experiments.
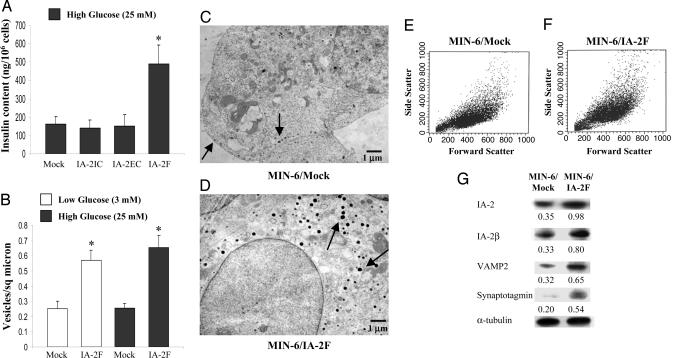
IA-2 Increases Insulin Content and Number of Insulin-Containing Vesicles in MIN-6 Cells. To determine whether the increase in insulin secretion was related to an increase in the insulin content of the cells, MIN-6 cells were lysed and the insulin content was quantified. The insulin content of IA-2F-transfected cells was nearly three times greater than that of the mock-transfected cells, whereas the insulin content of the IA-2IC- and IA-2EC-transfected cells did not differ from that of the mock-transfected cells (Fig. 3A). EM revealed substantially greater numbers of dense core vesicles in the IA-2F-transfected cells as compared with the mock-transfected cells at both low and high glucose concentrations (Fig. 3 B-D). Although the insulin-containing vesicles in IA-2F-transfected cells appeared somewhat larger than the sparse vesicles in the mock-transfected cells, FACS analysis failed to show any significant difference in the size of the cells (Fig. 3 E and F). Corresponding to the increase in the number of vesicles, several vesicle-related proteins (i.e., IA-2β, VAMP2, synaptotagmin) also were increased in IA-2F-transfected MIN-6 cells (Fig. 3G).
Fig. 3.
Insulin content and vesicle number in MIN-6 cells. (A) The insulin content as determined by ELISA in MIN-6 mock-, IA-2IC-, IA-2EC-, and IA-2F-transfected cells. Mean ± SEM of three separate experiments (*, P < 0.01). (B) Vesicles per square μm as determined by EM in mock- and IA-2F-transfected MIN-6 cells. Mean ± SEM of 18 fields (*, P < 0.01). (C and D) EM pictures: arrows point to insulin-containing vesicles. (E and F) FACS analysis: cell size as evaluated by forward scatter of mock-transfected (E) and IA-2F-transfected (F) MIN-6 cells. (G) Expression of integral (IA-2, IA-2β, VAMP2, and synaptotagmin) vesicle proteins.
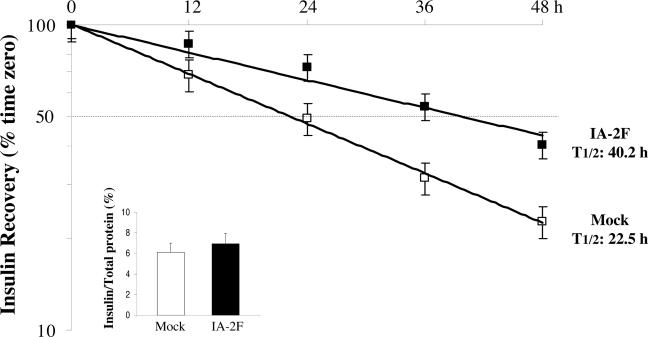
IA-2 Influences Stabilization of Insulin-Containing Vesicles. To investigate the possibility that the increase in the number of insulin-containing vesicles in IA-2F-transfected MIN-6 cells was caused by stabilization of the vesicles, insulin half-life experiments were performed. Mock- and IA-2F-transfected MIN-6 cells were cultured with [3H]leucine, and the labeled insulin was chased for 48 h. As seen in Fig. 4, the half-life of insulin in the IA-2F-transfected cells was 40.2 h compared with 22.5 h in the mock-transfected cells. No difference was found in the biosynthesis of insulin in the two cell lines (Fig. 4 Inset). From these studies we conclude that the overexpression of IA-2 stabilizes dense core vesicles, thereby increasing their number within cells.
Fig. 4.
Insulin biosynthesis (Inset) and half-life in MIN-6/IA-2F- and MIN-6/mock-transfected cells.
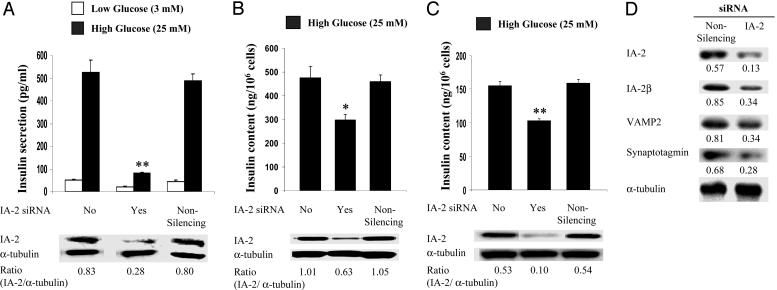
MIN-6 Cells Treated with IA-2 siRNA Decreases Insulin Secretion and Insulin Content. Further support for the idea that the overexpression of IA-2F was responsible for the increase in insulin content and secretion comes from treating IA-2F-transfected cells with IA-2 siRNA. IA-2 siRNA treatment resulted in a marked decrease in the expression of IA-2F protein and insulin secretion (Fig. 5A). An irrelevant nonsilencing siRNA had no effect. Similarly, IA-2 siRNA, but not irrelevant siRNA, produced a significant decrease in the insulin content of the cells (Fig. 5B). IA-2 siRNA also decreased by ≈40% the insulin content in nontransfected MIN-6 cells (Fig. 5C) and the expression of vesicle-related proteins (Fig. 5D).
Fig. 5.
Treatment of MIN-6 cells with IA-2 siRNA. (A and B) IA-2 siRNA treatment decreased glucose-induced insulin secretion (A) and insulin content (B) of IA-2F-transfected MIN-6 cells. (C) IA-2 siRNA treatment decreased the insulin content of nontransfected MIN-6 cells. Nonsilencing siRNA had no effect. (D) Treatment of nontransfected MIN-6 cells with IA-2 siRNA decreased the expression of vesicle-related proteins. IA-2 and α-tubulin expression was determined by Western blot analysis. Mean ± SEM of three separate experiments. *, P < 0.05; **, P < 0.01.
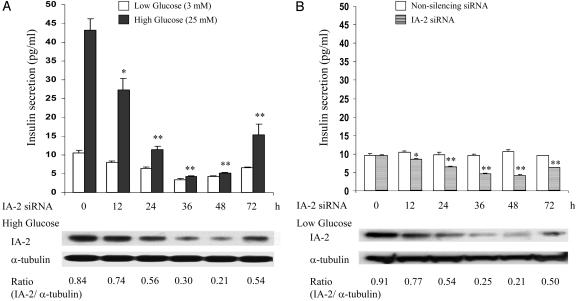
MIN-6 (Nontransfected) Cells Treated with IA-2 siRNA Knocks Down Endogenous IA-2 Expression and Decreases both Regulated and Basal Insulin Secretion. The demonstration that the knockdown of IA-2 protein in IA-2F-transfected cells decreased insulin secretion raised the possibility that endogenous IA-2 also might influence insulin secretion. To test this possibility, MIN-6 cells (nontransfected) were treated with IA-2 siRNA and then stimulated with low or high concentrations of glucose. The expression of endogenous IA-2 protein in cells stimulated with high glucose decreased by ≈75% over 48 h with a parallel decrease of close to 90% in insulin secretion (Fig. 6A). Similarly, there was a substantial decrease in insulin secretion in IA-2 siRNA-treated cells stimulated with low glucose (Fig. 6A). To see whether this decrease at low glucose also was related to the knockdown of endogenous IA-2, MIN-6 cells (nontransfected), kept at low glucose (3 mM), were treated with IA-2 siRNA or nonsilencing siRNA. The expression of endogenous IA-2 protein in these cells decreased by ≈75% over 48 h with a parallel decrease of ≈50% in the basal level of insulin secretion (Fig. 6B). There was no decrease in the secretion of insulin from cells treated with nonsilencing siRNA.
Fig. 6.
Treatment of MIN-6 cells (nontransfected) with IA-2 siRNA. (A) Cells treated with IA-2 siRNA were stimulated with low (3 mM) or high (25 mM) glucose, and insulin secretion was measured. IA-2 and α-tubulin expression, determined by Western blot, in cells treated with high glucose is shown. (B) Cells kept at a low concentration of glucose (3 mM) were treated with IA-2 siRNA or nonsilencing siRNA, and insulin secretion was measured. IA-2 and α-tubulin expression, determined by Western blot, in cells treated with IA-2 siRNA is shown. Mean ± SEM of three separate experiments. *, P < 0.05; **, P < 0.01.
Discussion
Past attempts to establish stable IA-2-transfected cell lines have been unsuccessful. The explanation for this failure is still unclear, but recent experiments in our laboratory (S.-i.H. and A.L.N., unpublished data) suggest that this failure may be the result of apoptosis induced by substantial overexpression of IA-2. In the current experiments, we succeeded in establishing stable cell lines and showed that IA-2F, but not IA-2EC or IA-2IC, enhanced glucose- and K+-induced insulin secretion. The IA-2F construct has a signal peptide and transmembrane region, whereas neither of these regions, which are required for insertion of IA-2 into secretory vesicles, were present in the IA-2EC or IA-2IC constructs. This difference could explain why these latter constructs had no effect on insulin secretion.
Our findings with MIN-6 cells suggest that the glucose intolerance and the impairment of insulin secretion observed in IA-2 knockout mice could be explained solely on the basis of IA-2 as a regulator of insulin vesicle number and secretion in beta cells and does not require an explanation based on the knockout of IA-2 in other neuroendocrine cells. However, the magnitude of the decrease in glucose-induced insulin secretion to basal levels in cell culture brought about by IA-2 siRNA is far greater than the decrease observed by the knockout of IA-2 in mice. These findings suggest that in knockout mice counter regulatory mechanisms actually may be compensating for the loss of IA-2 function.
The secretion of insulin is a complex process involving many different steps. Disruption of any one of these steps could result in partial or near-complete loss of secretory function. The near-complete loss of glucose-induced insulin secretion by treatment with IA-2 siRNA suggests that IA-2 interacts in one or more of the steps in the regulatory pathway. Several possible mechanisms have been proposed. Yeast two-hybrid studies and pull-down experiments have revealed several proteins (i.e., β2-syntrophin, βIV spectrin, neuronal nitric oxide synthase, receptor PTPα) with which IA-2 interacts (26-28). Based on these interactions, one possibility is that the binding of IA-2 to β2-syntrophin links secretory vesicles expressing IA-2 with the cytoskeleton system, thereby affecting the trafficking of secretory vesicles. A second possibility is that the cytoplasmic domain of IA-2 might heterodimerize with other PTPs (e.g., receptor PTPα) and thus influence signaling pathways involved in secretion (28). The present study points to still a third possible way by which IA-2 might modulate insulin secretion, and that is by increasing the number of insulin-containing vesicles and the insulin content of the cell. Such an increase could result from either increased biogenesis or decreased degradation (e.g., stabilization) of insulin-containing vesicles. Our experiments showed that the half-life of insulin, which reflects vesicle stability (21, 22), was markedly increased in IA-2-overexpressed cells (40.2 h) as compared with mock-transfected cells (22.5 h). Although perhaps not the only mechanism involved, stabilization of vesicles is at least a partial explanation for the increase in vesicle number and insulin secretion. These findings raise the possibility that identifying means to up-regulate IA-2 gene expression in the residual beta cells of patients with type 1 diabetes or the inadequately responding beta cells of patients with type 2 diabetes might represent a novel, although still distant, therapeutic approach for increasing insulin secretion by enhancing the number of dense core vesicles. In this context it is of interest that Lobner et al. (25) showed that insulin itself or glucose-induced insulin secretion could enhance the expression of IA-2. Conversely, in the present study we show that enhancement of IA-2 expression could increase glucose-induced insulin secretion. Thus, there appears to be a regulatory insulin/IA-2 feedback loop.
In conclusion, our studies provide strong evidence that IA-2 influences both regulated (glucose-induced) and constitutive (basal glucose) insulin secretion by increasing, presumably through stabilization, the number of insulin-containing dense core vesicles. Because IA-2 is broadly expressed in dense core secretory vesicles of many different neuroendocrine cells, it is quite likely that IA-2 also may have a regulatory role in the secretory pathways of other neuroendocrine cells.
Acknowledgments
We thank Carolyn Richardson for quantifying the insulin-containing vesicles.
Author contributions: S.-i.H. and A.L.N. designed research; S.-i.H., A.C., and M.R.C. performed research; S.-i.H., A.C., and M.R.C. analyzed data; and S.-i.H. and A.L.N. wrote the paper.
This paper was submitted directly (Track II) to the PNAS office.
Abbreviations: PTP, protein tyrosine phosphatase; siRNA, short interfering RNA; KRBH, Krebs-Ringer's solution bicarbonate Hepes.
References
- 1.Lan, M. S., Lu, J., Goto, Y. & Notkins, A. L. (1994) DNA Cell Biol. 13, 505-514. [DOI] [PubMed] [Google Scholar]
- 2.Xie, J., Zhang, B., Lan, M. S. & Notkins, A. L. (1998) Genomics 54, 338-343. [DOI] [PubMed] [Google Scholar]
- 3.Solimena, M., Dirkx, R., Jr., Hermel, J. M., Pleasic-Williams, S., Shapiro, J. A., Caron, L. & Rabin, D. U. (1996) EMBO J. 15, 2102-2114. [PMC free article] [PubMed] [Google Scholar]
- 4.Cai, T., Krause, M. W., Odenwald, W. F., Toyama, R. & Notkins, A. L. (2001) Diabetologia 44, 81-88. [DOI] [PubMed] [Google Scholar]
- 5.Lu, J., Notkins, A. L. & Lan, M. S. (1994) Biochem. Biophys. Res. Commun. 204, 930-936. [DOI] [PubMed] [Google Scholar]
- 6.Payton, M. A., Hawkes, C. J. & Christie, M. R. (1995) J. Clin. Invest. 96, 1506-1511. [DOI] [PMC free article] [PubMed] [Google Scholar]
- 7.Lan, M. S., Wasserfall, C., Maclaren, N. K. & Notkins, A. L. (1996) Proc. Natl. Acad. Sci. USA 93, 6367-6370. [DOI] [PMC free article] [PubMed] [Google Scholar]
- 8.Verge, C. F., Gianani R., Kawasaki, E., Yu, L., Pietropaolo, M., Jackson, R. A., Chase, H. P. & Eisenbarth, G. S. (1996) Diabetes 45, 926-933. [DOI] [PubMed] [Google Scholar]
- 9.Gorus, F. K. (1997) Diabetes Metab. Rev. 13, 247-274. [DOI] [PubMed] [Google Scholar]
- 10.Hawa, M., Rowe, R., Lan, M. S., Notkins, A. L., Pozzilli, P., Christie, M. R. & Leslie, R. D. (1997) Diabetes 46, 1270-1275. [DOI] [PubMed] [Google Scholar]
- 11.Bingley, P. J., Bonifacio, E., Williams, A. J., Genovese, S., Bottazzo, G. F. & Gale, E. A. (1997) Diabetes 46, 1701-1710. [DOI] [PubMed] [Google Scholar]
- 12.Kulmala, P., Savola, K., Petersen, J. S., Vahasalo, P., Karjalainen, J., Lopponen, T., Dyrberg, T., Akerblom, H. K. & Knip, M. (1998) J. Clin. Invest. 101, 327-336. [DOI] [PMC free article] [PubMed] [Google Scholar]
- 13.Maclaren, N., Lan, M., Coutant, R., Schatz, D., Silverstein, J., Muir, A., Clare-Salzer, M., She, J. X., Malone, J., Crockett, S., et al. (1999) J. Autoimmun. 12, 279-287. [DOI] [PubMed] [Google Scholar]
- 14.Saeki, K., Zhu, M., Kubosaki, A., Xie, J., Lan, M. S. & Notkins, A. L. (2002) Diabetes 51, 1842-1850. [DOI] [PubMed] [Google Scholar]
- 15.Harashima, S., Tsukamoto, T. & Horiuchi, T. (2004) Rheumatology 43, 396-397. [DOI] [PubMed] [Google Scholar]
- 16.Katsuta, H., Ozawa, S., Ninomiya, T., Shimoyama, T., Ito, E., Tanaka, T., Yamaguchi, S., Katahira, H., Nagamatsu, S., Horie, M., et al. (2003) Biochem. Biophys. Res. Commun. 311, 660-664. [DOI] [PubMed] [Google Scholar]
- 17.Zhao, C. & Rutter, G. A. (1998) FEBS Lett. 430, 213-216. [DOI] [PubMed] [Google Scholar]
- 18.Sakurai, T., Satake, A., Sumi, S., Inoune, K. & Miyakoshi, J. (2004) Bioelectromagnetics 25, 160-166. [DOI] [PubMed] [Google Scholar]
- 19.Higham, C. E., Jaikaran, E. T., Fraser, P. E., Gross, M. & Clark, A. (2000) FEBS Lett. 470, 55-60. [DOI] [PubMed] [Google Scholar]
- 20.Jaikaran, E. T., Nilsson, M. R. & Clark, A. (2004) Biochem. J. 377, 709-716. [DOI] [PMC free article] [PubMed] [Google Scholar]
- 21.Halban, P. E. & Wollheim, C. B. (1980) J. Biol. Chem. 255, 6003-6006. [PubMed] [Google Scholar]
- 22.Nagamatsu, S. & Steiner, D. F. (1992) Endocrinology 130, 748-754. [DOI] [PubMed] [Google Scholar]
- 23.Harashima, S., Horiuchi, T., Hatta, N., Morita, C., Higuchi, M., Sawabe, T., Tsukamoto, H., Tahira, T., Hayashi, K., Fujita, S., et al. (2001) J. Immunol. 166, 130-136. [DOI] [PubMed] [Google Scholar]
- 24.Xie, H., Deng, Y. J., Notkins, A. L. & Lan, M. S. (1998) Clin. Exp. Immunol. 113, 367-372. [DOI] [PMC free article] [PubMed] [Google Scholar]
- 25.Lobner, K., Steinbrenner, H., Roberts, G. A., Ling, Z., Huang, G. C., Piquer, S., Pipeleers, D. G., Seissler, J. & Christie, M. R. (2002) Diabetes 51, 2982-2988. [DOI] [PubMed] [Google Scholar]
- 26.Ort, T., Maksimova, E., Dirkx, R., Kachinsky, A. M., Berghs, S., Froehner, S. C. & Solimena, M. (2000) Eur. J. Cell Biol. 79, 621-630. [DOI] [PubMed] [Google Scholar]
- 27.Berghs, S., Aggujaro, D., Dirkx, R., Jr., Maksimova, E., Stabach, P., Hermel, J. M., Zhang, J. P., Philbrick, W., Slepnev, V., Ort, T., et al. (2000) J. Cell Biol. 27, 985-1002. [DOI] [PMC free article] [PubMed] [Google Scholar]
- 28.Gross, S., Blanchetot, C., Schepens, J., Albet, S., Lammers, R., den Hertog, J. & Hendriks, W. (2002) J. Biol. Chem. 277, 48139-48145. [DOI] [PubMed] [Google Scholar]


