Abstract
The adaptability of insects to hosts has long been a focal point in the study of insect-plant interactions. The pea aphid (Acythosiphon pisum), a significant pest of numerous leguminous crops, not only inflicts direct economic losses but also disseminates various plant viruses. To understand how pea aphids adapt to diverse alfalfa varieties. We analyzed the differentially expressed genes (DEGs) of pea aphids in distinct alfalfa varieties using transcriptome sequencing, and subsequently conducted functional validation of these genes. Comparative analysis between pea aphids feeding on susceptible and resistant strains revealed that DEGs in aphids feeding on resistant strains were primarily associated with transcriptional enrichment in the sugar, amino acid, protein, and lipid metabolism pathways. Fourteen DEGs related to adaptation of the pea aphid to alfalfa were chosen, including five carboxylesterases (CarE), four cytochrome P450s, three glutathione S-transferases, and two peroxidases (POD). RT-qPCR results indicated significant up-regulation of two carboxylesterase genes and two peroxidase genes after 24 h of feeding resistant alfalfa (Gannong 5, GN5) compared to the susceptible varieties (Hunter River, LRH), particularly highlighting the high expression levels of ApCarE4 and ApPOD3. Simultaneously, RNAi-induced knockdown of ApCarE4 and ApPOD3 led to a higher mortality of pea aphids in the alfalfa Hunter River. These results indicate that ApPOD3 and ApCarE4 are involved in the detoxification of metabolic functions in the adaptation of pea aphids to host switching. These findings contribute to the understanding of pea aphid adaptation to host plants and lay a foundation for further exploration of the physiological roles of carboxylesterase and peroxidase genes in pea aphids.
Supplementary Information
The online version contains supplementary material available at 10.1038/s41598-024-76192-5.
Keywords: Pea aphid, Alfalfa, Host switching, Transcriptome, RNAi
Subject terms: Transcriptomics, Entomology
Introduction
The pea aphid (Acythosiphon pisum) is a pest worldwide, and its host range includes at least 15 host races that specialize in different leguminous plants, such as pea, alfalfa, broad bean, and other leguminous plants1. It displays distinctive morphological, physiological, and behavioral differences across various host plants, forming distinct biotypes and genotypes2. The original host plant, broad bean, exhibited the highest reproduction and survival rates compared to other hosts. Genetic differentiation and reproductive isolation between red clover and alfalfa populations is evident3,4.
Alfalfa (Medicago sativa) is a common perennial, herbaceous plant. Among the different varieties, susceptible alfalfa Hunter River (LRH) and resistant alfalfa Gannong 5 (GN5) are notable. LRH exhibits strong adaptability to pea aphids, whereas GN5 possesses strong resistance to pea aphids, making it suitable for growth under dry and cold conditions. According to a previous report, the survival rate of pea aphids on GN5 was approximately 66%, with a developmental period of 8 days and a reproductive span of 10 days5. In contrast, for LRH, the survival rate was 78%, with a longer reproductive period of approximately 12 d. However, the mechanism of its adaptation to different alfalfa varieties remains unclear.
Plants and herbivorous insects share intimate and co-evolved relationships marked by ongoing competition6,7. Plants defend themselves against herbivores using physical barriers (such as trichomes, spines, and thickened leaves) or by producing toxins, while herbivorous insects have evolved parallel adaptation mechanisms8.
Plant metabolites, such as gossypol, tannin, nicotine, and insecticidal substances, such as pyrethrin, can activate insect detoxification ability and induce detoxification mechanisms9–14. Metabolic adaptation plays an important role in the adaptation of insects to plants15. Insects possess at least two molecular mechanisms for adaptation to plants. Firstly, insects express sophisticated metabolic adaptations to detoxify ingested plant chemicals. The overall detoxification process is traditionally divided into three phases that differentially affect ingested toxins: direct metabolism (phase I), conjugation (phase II), and translocation (phase III)16. Direct metabolism reduces the biological activity of various substrates by oxidative reduction or hydrolysis of enzymes such as cytochrome P450 monooxygenases (P450s) and carboxylesterases (CarEs)17,18. Glutathione S-transferases (GSTs) and UDP-glucuronosyltransferases (UGTs) conjugate and convert chemicals into water-soluble compounds in Phase II by interacting with enzymes in Phase I7,9. In Phase III, ATP-binding cassette (ABC) transporters translocate conjugated compounds for storage19. Molecular studies have shown that herbivorous insects adapt to different host plant transfers by extensively rearranging their xenobiotic metabolism through differential expression of genes encoding P450s, CarEs, GSTs, UGTs, and other related proteins that metabolize, bind, or translocate toxins20,21.
Simultaneously, ROS, as a vital signaling molecule and defensive armament within plants, can be rapidly generated upon insect infestation, triggering a cascade of defensive responses22. When insects feed on plants that contain elevated levels of ROS, their antioxidant enzyme activity, such as POD and SOD, may increase, thereby safeguarding cells from oxidative stress-induced damage and maintaining normal cellular physiological functions23. For instance, a comparative analysis of Mayetiola destructor larvae feeding on resistant wheat versus those feeding on susceptible wheat demonstrated increased expression levels of all antioxidant genes, with the exception of MdesSOD-1 and MdesSOD-2, in the larvae reared on the resistant variety24. Therefore, an increase in antioxidant enzymes may be one of the reasons why insects can successfully feed on plants.
To determine pea aphid adaptive alterations at the molecular level, we scrutinized and assessed the transcriptomes of pea aphids fed GN5 and LRH. We compared the expression profiles of metabolism-related genes. Additionally, we validated the functions of candidate genes via RNAi technology and observed the mortality of pea aphids after silencing relevant genes. The results showed that the two candidate genes play a significant role in aphid development in different host plants. Overall, our findings offer molecular insights into host plant adaptation, thereby offering a pathway to devise effective resistance management strategies for the pea aphid A. pisum.
Results
Transcriptome assembly and annotation
Transcriptome data of A. pisum were uploaded to NCBI (https://www.ncbi.nlm.nih.gov/) (PRJNA892899). After filtering the raw reads, clean data were obtained, 5.87 GB of clean data for each sample was sequenced. Full-length sequences were identified by primer sequences at both ends of the reads, and the number of full-length sequences obtained for each sample ranged from 5,566,119 to 7,911,428. The full-length sequences were polished to obtain the consensus isoform, and all the consensus isoform sequences were compared to the reference genome using the software minimap2. The redundant reads were then removed, resulting in 35,192 transcript sequences per sample (Supplementary). The transcriptomes that were removed were annotated with the Nr, Swissprot, GO, KOG, COG, Pfam, and KEGG databases. The number of new isoforms obtained was 1,794 (COG), 6,570 (GO), 6,135 (KEGG), 4,830 (KOG), 5,103 (Pfam), 3,915 (Swissprot), and 8,359 (Nr) (Supplementary).
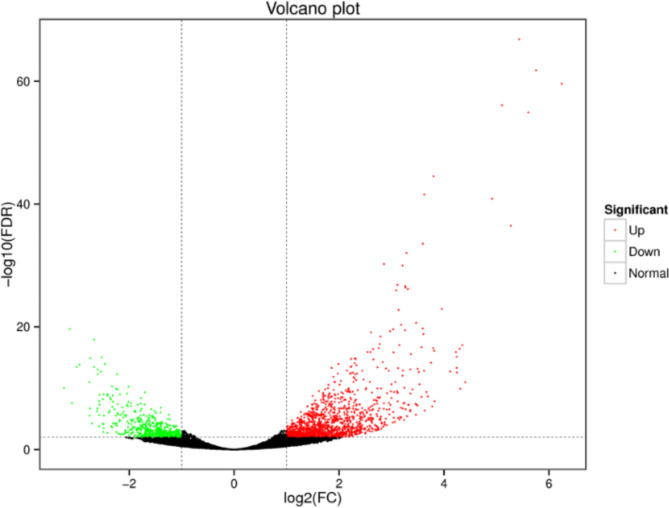
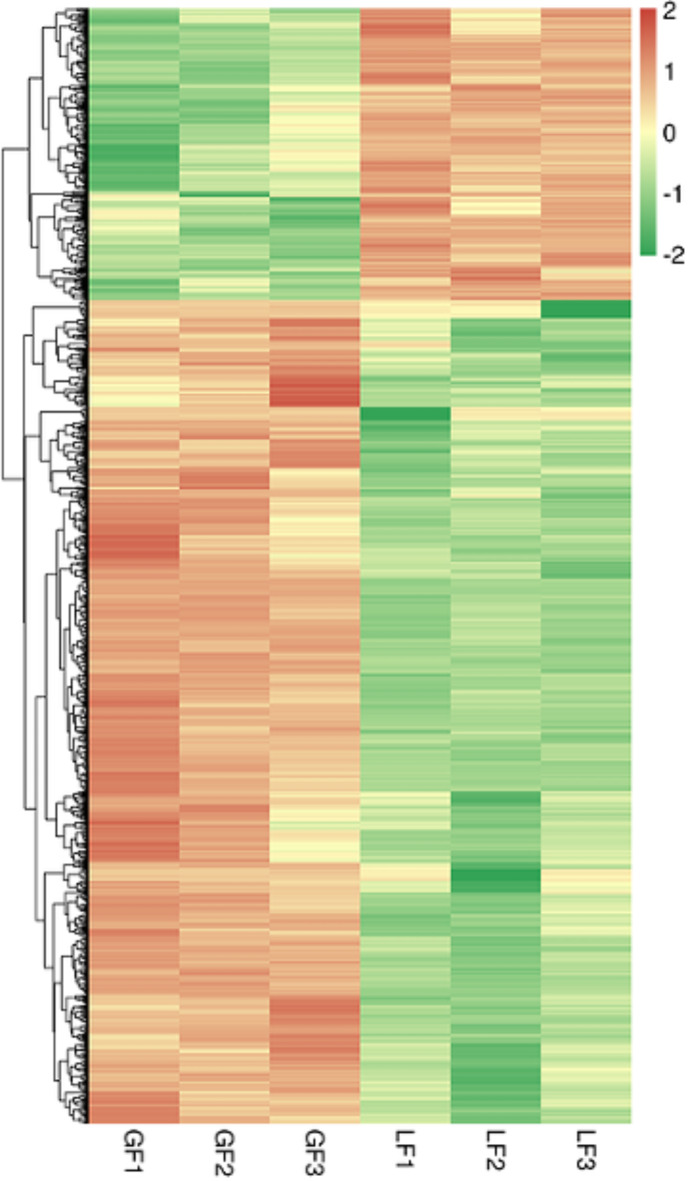
In the transcriptome, differentially expressed genes (DEGs; P < 0.01) were divided into upregulated and downregulated transcripts according to their expression levels between the two groups. A total of 1,873 DEGs were found in the transcriptome, including the upregulation of 1,322 and downregulation of 551 (Supplementary). The difference in the expression levels and statistical significance were clearly observed in the Volcano Plot (Fig. 1). A total of 1,695 (90.50%) unigenes were annotated. Cluster analysis was performed on the selected transcripts with different expression levels, and transcripts with the same or similar expression patterns were clustered (Fig. 2).
Fig. 1.
Volcano Plot of DETs. Each point in the differential volcano plot represents a transcript, the ventral axis represents the logarithmic value of the multiplicity of difference in expression of the transcript in two samples; the two samples are A. pisum feeding on two varieties of alfalfa. A. pisum fed on LRH are presented as LF aphids and the pea aphids fed on GN5 are presented as the GF aphids, and the vertical axis represents the negative logarithmic value of the statistical significance of the change in transcript expression. The larger the absolute value of the ventral coordinate, the greater the fold difference in expression between the two samples. The larger the value of the vertical coordinate, the more significant the differential expression and the more reliable the differentially expressed transcripts. Green dots in the graph represent down-regulated differentially expressed transcripts, red dots represent up-regulated differentially expressed transcripts, and black dots represent no differentially expressed transcripts.
Fig. 2.
Clustering map of DETs. The X-axis presents sample name and the clustering result of samples. The Y-axis presents the DETs and the clustering result of transcripts. Different columns stand for different samples while different rows stand for different transcripts. The color stands for the log2(CPM+1e−6) of expression level of transcripts.
Functional enrichment analysis by GO and KEGG
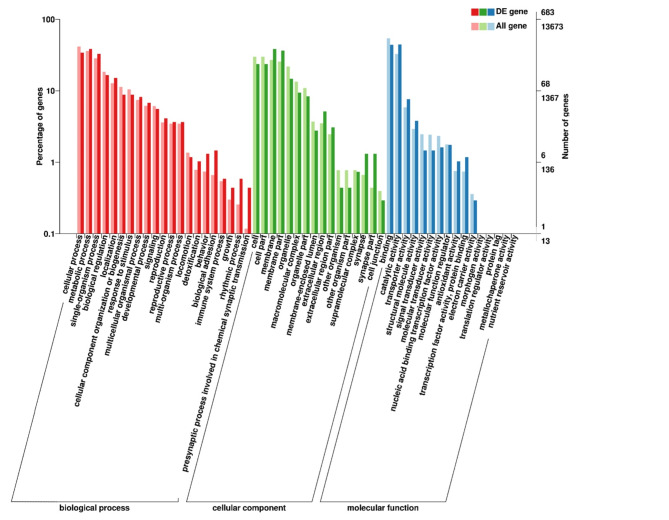
Gene Ontology (GO) enrichment analysis of the differentially expressed genes (DEGs) was implemented by the GO-seq R packages, which can adjust for gene length bias in DEGs. 1,873 DEGs were compared with the protein sequences in the GO database. The results showed that 1,298 unigenes were identified in the GO database, accounting for 76.58% of all unigenes. Annotated genes are mainly distributed in biological process, cellular component and molecular function. In the biological process category, 296 unigenes were involved in biological regulation, 217 unigenes were involved in cellular processes, and 193 were involved in metabolic processes. Moreover, in molecular function, 301, 299 and 156 unigenes were involved in binding, catalytic activity, and heterocyclic compound binding, respectively (Fig. 3).
Fig. 3.
GO annotation and classification of DETs.
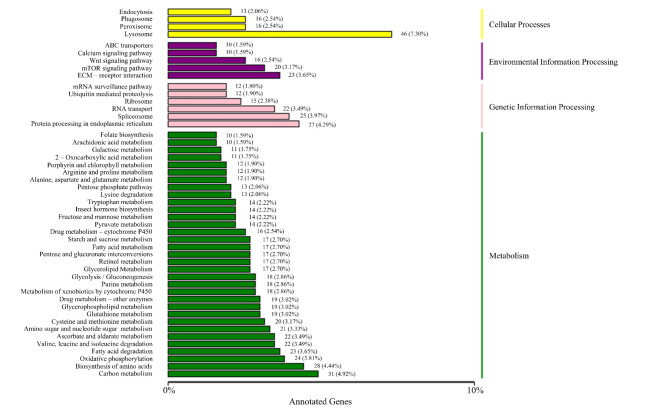
KEGG25–28 is a database resource for understanding high-level functions and utilities of biological systems, such as cells, organisms, and ecosystems, from molecular-level information, especially large-scale molecular datasets generated by genome sequencing and other high-throughput experimental technologies (http://www.genome.jp/kegg/). We used the KOBAS software to test the statistical enrichment of DEGs in KEGG pathways. In total, 640 unigenes were annotated using KEGG pathways. Annotated genes are mainly involved in cellular processes, environmental information processing, genetic information processing, and metabolism. In the amino acid metabolism and synthesis pathway, 53 unigenes took part, 16 unigenes were involved in peroxisome and glutathione metabolism pathways, and 15 unigenes were involved in the metabolism of xenobiotics by cytochrome (Fig. 4).
Fig. 4.
KEGG classification figure of DETs. The X-axis presents the number of transcripts annotated to the pathway and the proportion of the annotated transcripts number to the total transcripts number. The Y-axis presents the names of KEGG metabolic pathway.
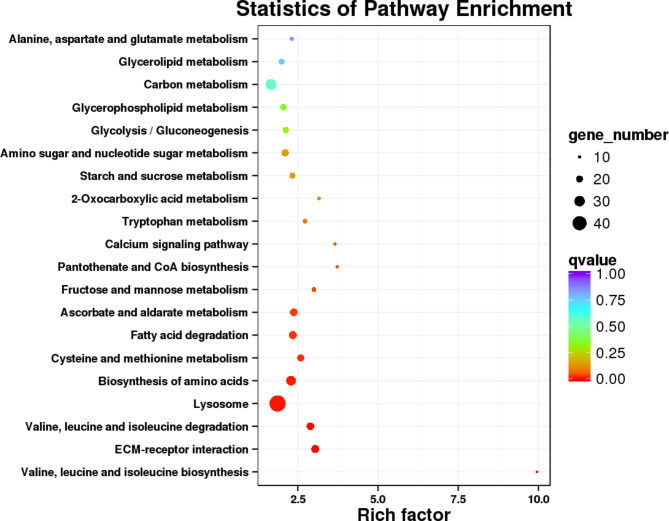
The top 20 significantly enriched KEGG pathways are presented (Fig. 5). Of these, 11 pathways were involved in nutrient metabolism, such as sugar metabolism, amino acid-related metabolism, lipid metabolism, and vitamin-related metabolism.
Fig. 5.
Scatter plot of KEGG pathway enrichment of DETs of A. pisum fed on different varieties alfalfa. Each circle in the figure represents a KEGG pathway, the ordinate represents the pathway name, and the abscissa represents the Enrichment Factor, which represents the ratio of the transcript proportion annotated to a pathway in the differential transcript to the transcript proportion annotated to the pathway in all transcripts. The greater the enrichment factor, the more significant the enrichment level of differentially expressed transcripts in this pathway. The color of the circle represents q-value, which is P value after multiple hypothesis testing and correction. The q-value is the P value after multiple hypothesis testing and correction. The smaller the q-value, the more reliable the enrichment significance of differentially expressed transcripts in the pathway. The size of the circle indicates the number of transcripts enriched in the pathway, and the larger the circle indicates the more transcripts.
DEGs analysis of detoxification metabolism and nutrition metabolism
There were 38 unigenes of detoxification metabolism from DEGs, such as seven CarE genes (all up-regulated), sixteen P450 genes, three GSTs genes, six POD genes, three UGT genes and three ABC transporter genes (Table 1).
Table 1.
Detoxification metabolism DETs number counts.
| DET group | DET number | DET number of up-regulated |
|---|---|---|
| Carboxylesterase CarE | 7 | 7 |
| Cytochrome P450s | 16 | 15 |
| Udp-Glucuronosyltransferases | 3 | 3 |
| Glutathione-S-transferase, GST | 3 | 3 |
| Peroxidase, POD | 6 | 5 |
| ATP-binding cassette transporters ABC | 3 | 3 |
Note: DET: Differentially expressed transcripts.
In addition, we found that 168 DEGs were involved in nutrition metabolism from 1,695 DEGs. Based on the functional categories, 168 DEGs were grouped into sugar metabolism, amino acids and proteins, and lipid metabolism. 36 DEGs were associated with sugar metabolism, of which only four were down-regulated. There were 93 DEGs were associated with amino acids and proteins. For amino acid and protein-related metabolism, 56 of 66 amino acid metabolism genes and 9 of 11 trypsin metabolism genes were up-regulated. In addition, 2 lipase genes, 6 carboxypeptidase genes and 8 aminopeptidase genes were all up-regulated. Moreover, we also found 38 DEGs associated with lipid metabolism, of which four DEGs were down-regulated (Table 2).
Table 2.
Nutrition metabolism DETs number counts.
| DET group | DET number | DET number of up-regulated |
|---|---|---|
| Sugar metabolism | 36 | 32 |
| Amino acid metabolism | 66 | 56 |
| Lipase | 2 | 2 |
| Trypsin | 11 | 9 |
| Carboxypeptidase | 6 | 6 |
| Aminopeptidase | 8 | 8 |
| Lipid metabolism | 38 | 34 |
Validation of transcriptome DEGs by RT-qPCR and analysis of key enzyme genes regulation in A. pisum
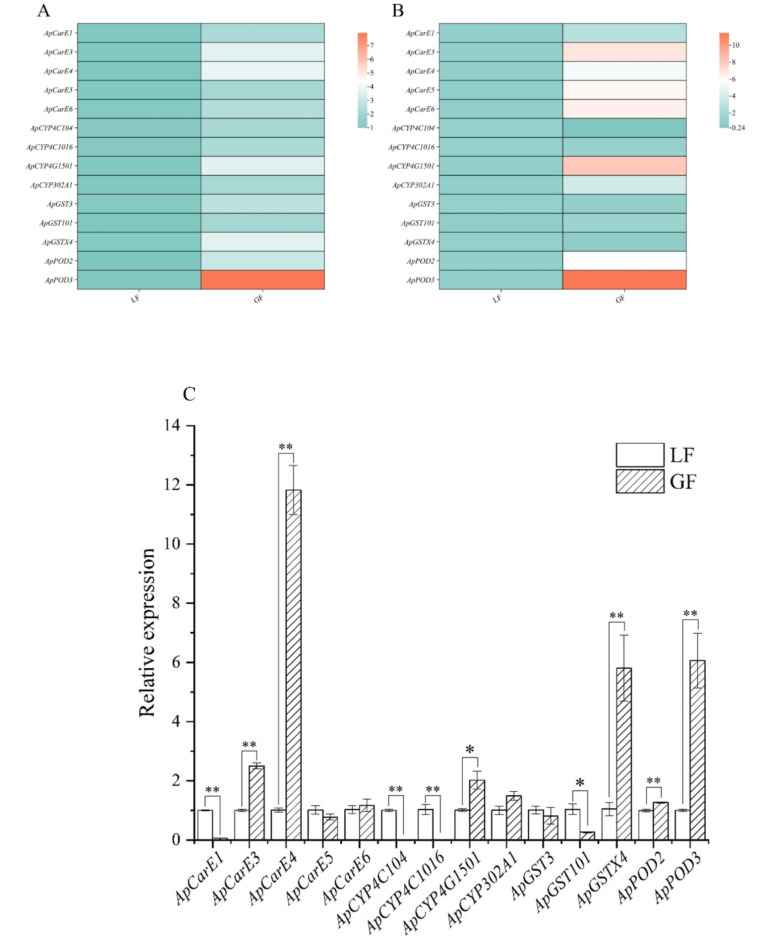
DEGs in the transcriptome were verified using RT-qPCR, and the results were reliable (Fig. 6A and B). In a previous study, we found that the enzymatic activities of the protective and detoxifying enzymes POD, CarE, GST and P450, were high after 24 h of aphids fed on two strains of alfalfas. Therefore, we analyzed the transcript abundance of genes which includes four P450 genes, five CarE genes, three GST genes, and two POD genes in response to alfalfa at 24 h. The relative expression levels of these genes were measured using RT-qPCR. Our results demonstrated that ApCarE3 and ApCarE4 were significantly overexpressed (P < 0.01) 24 h after exposure to GN5 alfalfa compared to LF. The expression levels of ApCarE3 and ApCarE4 were 11- and 2.5-fold higher, respectively. However, the expression levels of ApCarE1 and ApCarE5 in GF began to decrease after 24 h (Fig. 6-C). This shows that ApCarE4 may play an important role in the regulation 24 h after GF. Among the four P450 genes, ApCYP4C104 and ApCYP4C1016 were significantly downregulated 24 h after exposure to GN5 alfalfa compared to LF. ApCYP4G1501 and ApCYP302A1 increased up to 2- and 1.5-fold, respectively, at 24 h.
Fig. 6.
Relative expression levels of differentially expressed genes involved in A. pisum adaptation to different varieties of alfalfa; (A) RNA-seq for related genes; (B) Verify the relative expression levels of the related genes at 12 h of A. pisum; (C) Relative expression levels of related genes at 24 h of A. pisum fed on different varieties alfalfa. * and ** indicates that the differences between two groups were significant (P<0.05) or extremely significant (P<0.01), n = 3.
Otherwise, the expression levels of three GSTs were lower than those of other enzymes in GF. For example, ApGST101 was down-regulated at 24 h and ApGSTX4 was up to 5.8-fold at 24 h. Besides, ApGST3 was down-regulated at 24 h. According to qPCR analysis, GSTs genes functions normally at 24 h (Fig. 6-C). The levels of ApPOD2 and ApPOD3 were significantly up-regulated at 24 h (P < 0.01). Especially ApPOD3 was up to 6-fold (Fig. 6-C). The result indicated that ApPOD3 affected regulatory function at 24 h.
Functional analysis of ApPOD3and ApCarE4in the feeding process of A. pisum
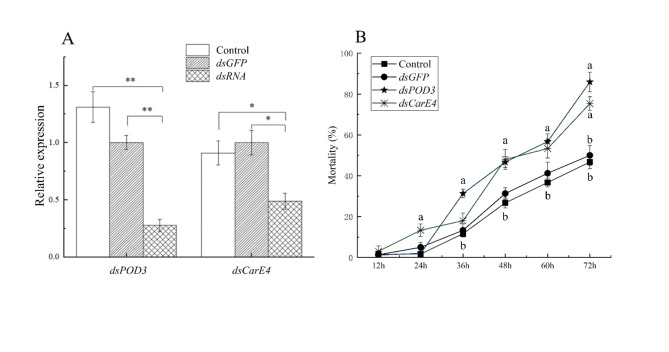
In order to investigate whether there was silencing of related genes after introduction of dsRNA into the pea aphid, we selected two genes involved in detoxification and metabolic pathways, ApPOD3 and ApCarE4, and analyzed their expression after feeding on dsRNA. Compared with the control group, the silencing efficiencies of ApPOD3 and ApCarE4 were 73.90% (P < 0.01) and 51.37%, respectively (Fig. 7).
Fig. 7.
(A) Changes of ApPOD3 and ApCarE4 gene expression levels in pea aphid after 48 h interference. (B) The mortality of pea aphid after RNA interference which transferred to LRH. * and ** indicates that the differences between target gene and control after interference were significant (P<0.05) or extremely significant (P<0.01), n = 3.
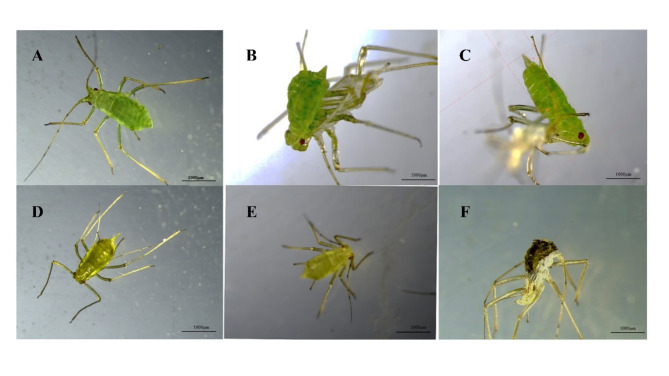
After treatment of pea aphids with dsApPOD3 and dsApCarE4, pea aphids were transferred to the LRH. The mortalities rate in the dsApPOD3 feed groups were dramatically higher than those of the dsGFP and water feed groups after 36 h. Besides, at 48 h, the mortality rate in the dsApCarE4 feed groups were significantly higher than that of the control groups. The mortality rate was 2% at 24 h after feeding dsApPOD3, which was not significantly different compared to the control groups (dsGFP and water). But from 36 h to 72 h, the mortality rate rose sharply by 54.67%. Besides, we silenced ApCarE4, the mortality was 13.33%, and 2-fold higher in the dsApCarE4 groups than that of the control groups at 24 h. The mortalities were 18%, 48% and 73.33% at three periods, respectively (Fig. 7). On the other hand, we also found an interesting thing that aphids’ cuticular could change with feeding. Specifically, after feeding dsApPOD3 the aphid’s body color gradually faded, and it gradually went to the final death (Fig. 8).
Fig. 8.
The molting death of pea aphid after genes silencing. (A)-(C) Pea aphids molted and died 24 h after fed on dsApPOD3; (D)-(E) Pea aphids molted and died 48 h after fed on dsApPOD3.
Discussion
The adaptation of herbivorous insects to specific host plants can significantly impact their potential distribution, contingent upon the correlation (positive, negative, or absent) between their fitness and various host plant species6,21. Simultaneously, polyphenol oxidase (PPO) and peroxidase (POD) were induced29,30. Notably, tolerant plant cultivars exhibit heightened peroxidase activity in response to aphid infestation, whereas susceptible cultivars maintain similar peroxidase levels between infested and control plants31. In our research, compared with the susceptible alfalfa, the two POD genes were significantly up-regulated after the pea aphid fed resistant alfalfa. It may be related to the increase of ROS content in plant tissues. Feeding by Myzus persicae triggering ROS accumulation in tobacco phloem32.
The differential expression of herbivore genes associated with digestion, detoxification, plant chemical defense inactivation are deemed crucial factors for herbivores to feed on new hosts, survive, adapt, and consume various host plants33. As populations or species adapt to new hosts, transcriptomic changes become increasingly coordinated over time. For instance, maize-adapted Spodoptera frugiperda larvae exhibited fewer gene expression alterations when feeding on maize compared to rice-strain larvae34. Successful feeding often involves the breakdown of low-nutrient plant tissues, leading to the expression of genes encoding digestive enzymes such as protease, protease inhibitor, lipase, glycoside hydrolase, and amylase35. Additionally, P450s, CarEs, UGTs, GSTs, and ABC transporters exhibit differential regulation in herbivores feeding on both new and non-preferred host plants, contributing to the neutralization, excretion, or isolation of plant-derived allelochemicals30,36,37. In this study, the expression of five CarEs genes, four P450 genes, and three GST genes were significantly upregulation when pea aphid fed resistant alfalfa.
Moreover, high resistance alfalfa might contain more polyphenols4. Notably, herbivorous insects can counteract plant defenses by elevating the activity of detoxification enzymes. Nevertheless, detoxification processes necessitate substantial energy and nutritional expenditure, making it easier for the host plant to be affected38. Additionally, to adjust to the synthesis of detoxification metabolizing enzymes stimulated by host plants, the insects’ growth rate decreases17. CarEs genes possess various roles in insects, encompassing neurogenesis, developmental regulation, xenobiotic metabolism, and insecticide detoxification39.
To ascertain the involvement of detoxification metabolizing enzyme genes and antioxidant enzyme gene in host adaptation, necessary for further functional verification, ApCarE4 and ApPOD3 genes were chosen as candidates for RNA interference (RNAi) The experiment achieved silencing efficiency above 50% for ApCarE4 and ApPOD3 genes, offering substantial evidence for the significant involvement of ApCarE4 and ApPOD3 in detoxification metabolism. Intriguingly, upon administering dsApCarE4 and dsApPOD3, the aphids exhibited a gradual fading of body color, ultimately leading to their demise. We hypothesized that the introduced dsRNA into the pea aphid might trigger ecdysone production or alter the expression of body color-related genes before reaching the functional site13,40–42. Nutrient limitation may also contribute to this phenomenon. Nevertheless, uncertainties persist, necessitating further experimental validation. RT-qPCR and RNAi assays established ApCarE4 and ApPOD3 as candidates for host plant adaptation, laying the groundwork for elucidating CarEs and POD-mediated host shifts in A. pisum. However, translating laboratory successes into effective field pest management remains a challenge.
In conclusion, transcriptome analysis revealed substantial upregulation of detoxification metabolism-related genes in pea aphids, yet their adaptability to resistant and susceptible alfalfa did not markedly improve. This is attributed to the aphids’ need to produce numerous digestive and detoxifying enzymes to counter plant defenses, which consumes substantial energy and nutrients, hindering growth and reproduction. Consequently, pea aphid colonization and population expansion on alfalfa may be sluggish. Additional factors, such as sugar, amino acid, and lipid metabolism, may also contribute to their host adaptation. Future studies should explore the impact of these pathways on herbivorous insect adaptability.
Materials and methods
Insects and plants
The population of pea aphids was established from the continuous culture at GSAU and was maintained on Vicia faba plants under the conditions of 20 ± 1℃, 60 ± 10% RH and a 16:8 h photoperiod. Then 3-instar aphids from the bean-reared were transferred into LRH and GN5 for 12 h. The pea aphids transferred into LRH are presented as LF aphids and the pea aphids transferred into GN5 are presented as the GF aphids.
Alfalfa plants were germinated in the climatic chamber (25℃, 70%RH and 16:8 h photoperiod). The plants were cultivated in plastic pots (H14 cm × D10 cm, three plants per pot) containing mixed soil (soil: peat: pumice = 3: 2: 1).
De novo assembly, annotation and classification
Total RNA (1 µg) of the pea aphids fed on two varieties alfalfa was prepared for the cDNA library construction using the cDNA-PCR Sequencing Kit (SQK-PCS109) provided by Oxford Nanopore Technologies (ONT). Briefly, the template switching activity of reverse transcriptase enriches for full-length cDNAs and add defined PCR adapters directly to both ends of the first-strand cDNA. And following cDNA PCR for 14 circles with LongAmp Tag (NEB). The PCR products were then subjected to ONT adaptor ligation using T4 DNA ligase (NEB). Agencourt XP beads was used for DNA purification according to ONT protocol. The final cDNA libraries were added to FLO-MIN109 flowcells and run on PromethION platform at Biomarker Technology Company (Beijing, China).
Raw reads were first filtered with minimum average read quality score of 7 and minimum read length of 500 bp. Ribosomal RNAs were discarded after mapping to rRNA database. Next, full-length, non-chemiric (FLNC) transcripts were determined by searching for primer at both ends of reads. Clusters of FLNC transcripts were obtained after mapping to reference genome with mimimap2, and consensus isoforms were obtained after polishing within each cluster by pinfish. Consensus sequences were mapped to reference genome using minimap2. Mapped reads were further collapsed by cDNA-Cupcake package with min-coverage of 85% and min-identity of 90%. The 5’ difference was not considered when collapsing redundant transcripts. Transcriptome sequence genes, gene families, and alternative splices that can be used for subsequent analysis were obtained.
The assembled transcriptome sequences were searched to obtain the annotation information against six databases, including NCBI nonredundant proteins (Nr), Swiss-Prot database, protein families (Pfam), Clusters of Orthologous (COG), eukaryotic Ortholog Groups (KEGG) and Gene Ontology (GO). The gene function terms were obtained through the Gene Ontology database (GO). Functional classification was performed using the Clusters of Orthologous Groups of proteins database (COG), and the pathway annotation was performed using the Kyoto Encyclopedia of Gene and Genomes (KEGG). For analyzing the gene expression level, we normalized the number of Mapped Reads in the sample and used counts per million (CPM) to estimate the expression level of transcripts and genes. We used DESeq243 for analyzing the differential expression of genes. A P-adjusted value < 0.01 and log2FC ≥ 1 was set as the threshold. There are false positives in the transcriptome sequence because differential expression analysis is an independent statistical hypothesis test for numbers of transcript expression values. Thus, the resulting P values were adjusted using the Benjamini and Hochberg’s approach for controlling the false discovery rate. To better study the function of differentially expressed genes (DEGs), we not only conducted an enrichment analysis for all DEGs in each combination (GO and KEGG enrichment), but also conducted enrichment analysis for DEGs in each combination according to up- or down-regulation.
To verify the RNA-Seq data, 14 target genes that were involved in detoxification and metabolic processes and significantly differentially expressed between LF and GF (P < 0.01) were selected for RT-qPCR analysis. They include ApCarE1, ApCarE3, ApCarE4, ApCarE5, ApCarE6, ApCYP4C104, ApCYP4C1016, ApCYP4G1501, ApCYP302A1, ApGST3, ApGST101, ApGSTX4, ApPOD2 and ApPOD3. The method for RT-qPCR was described below.
Quantitative real time PCR
Total RNA was extracted using TRIzol Reagent (Invitrogen, USA) from a total of 5 individual aphids following the manufacture’s protocol. The RNA concentration was quantified and verified using a NanoPhotometer NP80 Touch (Implen, Germany) and 1% agarose gel electrophoresis. Then the total RNA obtained was resuspended in 30 µL of nuclease-free water. The gDNA were removed using RQ1 RNase-Free DNase kit (Promega, USA). Subsequently, first-strand cDNA was synthesized in a 20 µL reaction from 1 µg total RNA with the regent Prime Script™ RT (TaKaRa, China) following the manufacture’s protocol. The resultant cDNA was diluted to 500 ng/µL for further use in RT-qPCR. Primers used for RT-qPCR are listed in Supplementary. And they were designed based on CDS sequences by website (http://bioinfo.ut.ee/primer3/). The RT-qPCR reaction was carried out using NovoStart® SYBR qPCR SuperMix Plus reaction kit (Novoprotein, China). Each reaction of 10 µL was performed in triplicate and contained 5 µL SYBR, 0.2 µL ROX II, 0.5 µL forward primer, 0.5 µL reverse primer, 3.3 µL RNase-Free water and 0.5 µL cDNA. The cycling parameters were 95℃ for 2 min following by 40 cycles of 95℃ for 15 s and 60℃ for 30 s ending with a melting curve analysis (60℃ to 95℃ in increments of 0.1℃ every 1 s) to check for nonspecific product amplification. Ribosomal protein L7 (RPL 7) and elongation factor 1 alpha (EF1-α) of A. pisum were used as the internal reference genes. The relative expression of genes of interest was estimated using the 2−ΔΔCT method44.
RNAi treatment
For double-stranded RNA (dsRNA) preparation, the template cDNA was firstly generated by PCR-targeting fragments. Primers with T7 promoter sequences were used to amplify a fragment of target cDNA or green fluorescent protein (GFP) cDNA for the dsRNA synthesis. Based on the manufacturer’s protocol, the dsRNA was transcribed by Transcript Aid T7 High Yield Transcription Kit (Thermo Scientific, Vilnius, Lithuania)45. The primers used for the synthesis are listed in Supplementary.
The dsRNA was delivered through a broad bean stem leaf based on Ye et al.46. Briefly, the cut broad bean leaves were inserted into a 200 µL centrifuge tube containing dsRNA at the final concentration of 1200 ng/µL. Then the tube was transferred into a petri dishes. The third-instar nymphs were placed onto the broad bean seedlings in the petri dishes. After continuous ingestion of dsRNA for 48 h, the pea aphid mortality was counted every 12 h. Aphids fed with water and dsGFP were used as controls. Each treatment group contained 30 insects and performed with 4 biological replicates. For the expression analysis studies after feeding dsRNA, RT-qPCR analysis was carried out as described above.
Statistical analysis
Statistical analysis in the study was performed using one-way ANOVA and in-dependent sample t-test with the SPSS v.22.0 software (SPSS, Chicago, IL, USA) (* P < 0.05, ** P < 0.01).
Electronic supplementary material
Below is the link to the electronic supplementary material.
Acknowledgements
This research was funded by (1) Scientific Research Start-up Funds for Openly-recruited Doctors of Gansu Agricultural University, (Project. No. GAN-KYQD-2019-28); (2) Natural Science Foundation of Gansu Province, (Project. No. 20JR5RA028); (3) Innovation Fund of Gansu University (Project. No. 2022 A-060); (4) Gansu province seed industry research plan project (Project. No. GYGG-2024-7).
Author contributions
L.L. and S.-S.W. designed the experiments. Y.-T.W., R.M., J.-W.W. and L.-W.S. contributed the materials and performed the experiments; Y.-T.W., R.M. and J.-W.W. analyzed the data; Y.-T.W., R.M., J.-W.W., J.-J.Z., Y. D., L.L. and S.-S.W. wrote the paper. All authors have read and agreed to the published version of the manuscript.
Data availability
Sequence data that support the findings of this study have been deposited in the National Center for Biotechnology Information with the primary accession code PRJNA892899.
Declarations
Competing interests
The authors declare no competing interests.
Footnotes
Publisher’s note
Springer Nature remains neutral with regard to jurisdictional claims in published maps and institutional affiliations.
Contributor Information
Sen-Shan Wang, Email: wangsenshan@gsau.edu.cn.
Lei Liu, Email: liuleian@163.com.
References
- 1.Goławska, S., Leszczynski, B. & Oleszek, W. Effect of low and high-saponin lines of alfalfa on pea aphid. J. Insect. Physiol.52, 737–743 (2006). [DOI] [PubMed] [Google Scholar]
- 2.González, M., Simon, J. C., Sugio, A., Ameline, A. & Cherqui, A. Aphid resistance in Pisum affects the feeding behavior of pea-adapted and non-pea-adapted biotypes of Acyrthosiphon pisum differently. Insects. 13, 268 (2022). [DOI] [PMC free article] [PubMed] [Google Scholar]
- 3.Chung, S. H., Parker, B., Blow, F., Brisson, J. & Douglas, A. Host and symbiont genetic determinants of nutritional phenotype in a natural population of the pea aphid. Mol. Ecol.29 (2020). [DOI] [PubMed]
- 4.Da, L. et al. The effect of different alfalfa varieties on the midgut protease activity of pea aphid (Acyrthosiphon pisum). Acta Prataculturae Sinica. 24, 80–87 (2015). [Google Scholar]
- 5.Wei, J. et al. Effects of resistant and susceptible alfalfa varieties on adaptability and enzyme activity of pea aphid. Acta Agrestia Sinica. 30, 1171–1177 (2022). [Google Scholar]
- 6.Howe, G. & Jander, G. Plant immunity to insect herbivores. Annu. Rev. Plant Biol.59, 41–66 (2008). [DOI] [PubMed] [Google Scholar]
- 7.Heidel-Fischer, H. & Vogel, H. Molecular mechanisms of insect adaptation to plant secondary compounds. Curr. Opin. Insect Sci.156, (2015). [DOI] [PubMed]
- 8.Divekar, P. et al. Plant secondary metabolites as defense tools against herbivores for sustainable crop protection. Int. J. Mol. Sci.23, 2690 (2022). [DOI] [PMC free article] [PubMed] [Google Scholar]
- 9.Meng, L. et al. A glutathione S-transferase (BdGSTd9) participates in malathion resistance via directly depleting malathion and its toxic oxide malaoxon in Bactrocera dorsalis (Hendel). Pest Manag. Sci.76 (2020). [DOI] [PubMed]
- 10.Small, G. & Hemingway, J. Molecular characterization of the amplified carboxylesterase gene associated with organophosphorus insecticide resistance in the brown planthopper, Nilaparvata lugens. Insect Mol. Biol.9, 647–653 (2001). [DOI] [PubMed] [Google Scholar]
- 11.Zhang, L., Gao, X. & Liang, P. Beta-cypermethrin resistance associated with high carboxylesterase activities in a strain of house fly, Musca domestica (Diptera: Muscidae). Pestic. Biochem. Physiol.89, 65–72 (2007). [Google Scholar]
- 12.Cao, C. W., Zhang, J., Gao, X., Liang, P. & Guo, H. L. Differential mRNA expression levels and gene sequences of carboxylesterase in both deltamethrin resistant and susceptible strains of the cotton aphid, Aphis gossypii. Insect Sci.15, 209–216 (2008). [Google Scholar]
- 13.Gong, Y., Yu, X. R., Shang, Q., Shi, X. Y. & Gao, X. Oral delivery mediated RNA interference of a carboxylesterase gene results in reduced resistance to organophosphorus insecticides in the cotton aphid, Aphis gossypii Glover. PloS One. 9, e102823 (2014). [DOI] [PMC free article] [PubMed] [Google Scholar]
- 14.Bai, L. et al. Identification and biochemical characterization of carboxylesterase 001G associated with insecticide detoxification in Helicoverpa armigera. Pestic. Biochem. Physiol.157, (2019). [DOI] [PubMed]
- 15.Berenbaum, M. & Calla, B. Editorial overview: cytochrome P450s in plant–insect interactions: New insights on gut reactions. Curr. Opin. Insect Sci.43, (2021). [DOI] [PubMed]
- 16.Lan, H., Zhang, Z., Wu, J., Cao, H. & Liu, T. X. Performance and transcriptomic response of the English grain aphid, Sitobion avenae, feeding on resistant and susceptible wheat cultivars. J. Integr. Agric.20, 178–190 (2021). [Google Scholar]
- 17.Bizzaro, D. et al. Relationship among expression, amplification, and methylation of FE4 esterase genes in Italian populations of Myzus persicae (Sulzer) (Homoptera: Aphididae). Pestic. Biochem. Physiol.81, 51–58 (2005). [Google Scholar]
- 18.Gong, Y. et al. Functional characterization of carboxylesterase gene mutations involved in Aphis gossypii resistance to organophosphate insecticides: The function of carboxylesterase gene mutations. Insect Mol. Biol.26, (2017). [DOI] [PubMed]
- 19.Reddy, V., Shlykov, M., Castillo, R., Sun, E. & Saier, M. The major facilitator superfamily (MFS) revisited. FEBS J.279, 2022–2035 (2012). [DOI] [PMC free article] [PubMed] [Google Scholar]
- 20.Lu, H. et al. Performances of survival, feeding behavior, and gene expression in aphids reveal their different fitness to host alteration. Sci. Rep.6, 19344 (2016). [DOI] [PMC free article] [PubMed] [Google Scholar]
- 21.Simon, J. C. et al. Genomics of adaptation to host-plants in herbivorous insects. Brief. Funct. Genomics14, (2015). [DOI] [PubMed]
- 22.Cui, N. et al. Armet, an aphid effector protein, induces pathogen resistance in plants by promoting the accumulation of salicylic acid. Philos. Trans. Royal Soc. B Biol. Sci.374 (2019). [DOI] [PMC free article] [PubMed]
- 23.Behne, D. & Kyriakopoulos, A. Mammalian selenium-containing proteins. Annu. Rev. Nutr.21, 453–473 (2001). [DOI] [PubMed] [Google Scholar]
- 24.Mittapalli, O., Neal, J. J. & Shukle, R. H. Antioxidant defense response in a galling insect. Proc. Natl. Acad. Sci. U.S.A.104, 1889–1894 (2007). [DOI] [PMC free article] [PubMed] [Google Scholar]
- 25.Kanehisa, M., Sato, Y., Kawashima, M., Furumichi, M. & Tanabe, M. KEGG as a reference resource for gene and protein annotation. Nucleic Acids Res.44, D457–D462 (2016). [DOI] [PMC free article] [PubMed] [Google Scholar]
- 26.Kanehisa, M., Goto, S., Kawashima, S., Okuno, Y. & Hattori, M. KEGG: Kyoto Encyclopedia of genes and genomes. Nucleic Acids Res.28, 27–30 (2000). [DOI] [PMC free article] [PubMed] [Google Scholar]
- 27.Kanehisa, M. Toward understanding the origin and evolution of cellular organisms. Protein Sci.28, 1947–1951 (2019). [DOI] [PMC free article] [PubMed] [Google Scholar]
- 28.Kanehisa, M., Furumichi, M., Sato, Y., Kawashima, M. & Ishiguro-Watanabe, M. KEGG for taxonomy-based analysis of pathways and genomes. Nucleic Acids Res.51, D587–D592 (2023). [DOI] [PMC free article] [PubMed] [Google Scholar]
- 29.Zarate, S., Kempema, L. & Walling, L. Silverleaf Whitefly induces salicylic acid defenses and suppresses effectual jasmonic acid defenses. Plant Physiol.143, 866–875 (2007). [DOI] [PMC free article] [PubMed] [Google Scholar]
- 30.Oakeshott, J. et al. Metabolic enzymes associated with xenobiotic and chemosensory responses in Nasonia Vitripennis. Insect Mol. Biol.19 (Suppl 1), 147–163 (2010). [DOI] [PubMed] [Google Scholar]
- 31.Van Chung, M., Toan, T. & San, N. The involvement of peroxidases in soybean seedlings’ defense against infestation of cowpea aphid. Arthropod-Plant Interact.10 (2016).
- 32.Guo, H. et al. An aphid-secreted salivary protease activates plant defense in phloem. Curr. Biol. CB. 30, 4826–4836 (2020). [DOI] [PubMed] [Google Scholar]
- 33.Cristofoletti, P., Ribeiro, A., Deraison, C., Rahbe, Y. & Terra, W. Midgut adaptation and digestive enzyme distribution in a phloem feeding insect, the pea aphid Acyrthosiphon pisum. J. Insect. Physiol.49, 11–24 (2003). [DOI] [PubMed] [Google Scholar]
- 34.Lü, D. et al. Comparison of gut bacterial communities of fall armyworm (Spodoptera frugiperda) reared on different host plants. Int. J. Mol. Sci.22 (2021). [DOI] [PMC free article] [PubMed]
- 35.Hardy, N., Peterson, D., Ross, L. & Rosenheim, J. Does a plant-eating insect’s diet govern the evolution of insecticide resistance? Comparative tests of the pre-adaptation hypothesis. Evol. Appl.1 (2017). [DOI] [PMC free article] [PubMed]
- 36.Smith, C. & Boyko, E. The molecular bases of plant resistance and defense responses to aphid feeding: Current status. Entomol. Exp. Appl.122, 1–16 (2007). [Google Scholar]
- 37.Singh, H., Dixit, S., Singh, P. & Verma, P. Differential peroxidase activities in three different crops upon insect feeding. Plant Signal. Behav. 8 (2013). [DOI] [PMC free article] [PubMed]
- 38.Li, X. et al. (2007) Molecular mechanisms of metabolic resistance to synthetic and natural xenobiotics. Annual Rev Entomol. 52:231–225 . [DOI] [PubMed]
- 39.Xia, J. et al. Genome-wide analysis of carboxylesterases (COEs) in the whitefly, Bemisia tabaci (Gennadius). Int. J. Mol. Sci.20, 4973 (2019). [DOI] [PMC free article] [PubMed] [Google Scholar]
- 40.Soffan, A., Alghamdi, S. & Aldawood, A. Peroxidase and polyphenol oxidase activity in moderate resistant and susceptible Vicia faba induced by Aphis craccivora (Hemiptera: Aphididae) infestation. J. Insect Sci. (Online). 14, 285 (2014). [DOI] [PMC free article] [PubMed] [Google Scholar]
- 41.Ma, C., Guo, Z., Zhang, F. & Su, J. Molecular identification, expression and function analysis of peroxidasin in Chilo Suppressalis. Insect Sci.27, (2019). [DOI] [PubMed]
- 42.Beran, F. & Petschenka, G. Sequestration of plant defense compounds by insects: From mechanisms to insect–plant coevolution. Ann. Rev. Entomol.67, 163–180 (2022). [DOI] [PubMed] [Google Scholar]
- 43.Love, M., Huber, W. & Anders, S. Moderated estimation of Fold change and dispersion for RNA-Seq data with DESeq2. Genome Biol.15, 550 (2014). [DOI] [PMC free article] [PubMed] [Google Scholar]
- 44.Michaelidou, K., Tzovaras, A., Missitzis, I., Ardavanis, A. & Scorilas, A. The expression of the CEACAM19 gene, a novel member of the CEA family, is associated with breast cancer progression. Int. J. Oncol. 42 (2013). [DOI] [PubMed]
- 45.Kao, M., Doupe, A. & Brainard, M. Contributions of an avian basal ganglia-forebrain circuit to real-time modulation of song. Nature. 433, 638–643 (2005). [DOI] [PubMed] [Google Scholar]
- 46.Niu, J. et al. Topical dsRNA delivery induces gene silencing and mortality in the pea aphid. Pest Manag. Sci.75, (2019). [DOI] [PubMed]
Associated Data
This section collects any data citations, data availability statements, or supplementary materials included in this article.
Supplementary Materials
Data Availability Statement
Sequence data that support the findings of this study have been deposited in the National Center for Biotechnology Information with the primary accession code PRJNA892899.


