



Abstract
Objective To explore the predictive value of radiomics nomogram combining with CT radiomics features and clinical features for postoperative early recurrence in patients with BRAF-mutant colorectal cancer. Methods A total of 220 patients with surgically and pathologically confirmed BRAF-mutant colorectal cancer from 2 institutions were retrospectively included. All patients from institution 1 were randomized at a 7:3 ratio into a training cohort (n = 108) and an internal validation cohort (n = 45), and patients from institution 2 were used as an external validation cohort (n = 67). The association between the radiomics features and early recurrence was assessed in the training cohort and verified in the validation cohort. Furthermore, the performance of the radiomics nomogram was evaluated by combining the rad-score and clinical risk factors. The predictive performance was evaluated by receiver operating characteristic curve analysis, calibration curve analysis, and decision curve analysis. Results The dierenees in the Lymphocyte/monocyte ratio (LMR) and Peripheral nerve infiltration (PNI) were statistically significant between the early recurrence in BRAF-mutant colorectal cancer groups and the early non-recurrence in BRAF-mutant colorectal cancer groups (P < 0.05); The two groups showed no significant differenee in clinical parameters including age, sex, and biochemistry serum markers (P > 0.05). Comparing with the pure radiomics or clinical data, combined models can be seen that the addition of LMR and PNI further improveed the predictive efficiency of the model. The rad-score based on LR, generated by 4 selected radiomics features, demonstrated a favorable ability to predict early recurrence in both the training (AUC 0.81), internal validation (AUC 0.73), external validation (AUC 0.63) cohorts. Subsequently, integrating two independent predictors into a nomogram exhibited more favorable discriminatory performance, with the AUC improved to 0.88 and 0.81 in both cohorts. Conclusions The proposed CT-based radiomics signature is associated with early recurrence among the patients with BRAF-mutant colorectal cancer. The present study also proposes a combined model can potentially be applied in the individual preoperative prediction of early recurrence in patients with BRAF-mutant colorectal cancer. Advances in knowledge CT-based radiomics showed satisfactory diagnostic significance for early recurrence in patients with BRAF-mutant colorectal cancer. Key baseline clinical characteristics were associated with early recurrence in patients with BRAF-mutant colorectal cancer. The combined model may be applied in the individual preoperative prediction of early recurrence in patients with BRAF-mutant colorectal cancer.
Supplementary Information
The online version contains supplementary material available at 10.1038/s41598-024-77256-2.
Keywords: Radiomics, BRAF-mutant colorectal cancer, Computed tomography, Early recurrence
Subject terms: Cancer, Diseases, Gastroenterology, Medical research, Oncology, Risk factors
Introduction
Colorectal cancer is the third most common malignant tumor worldwide and the second leading cause of cancer death1. There are about 12% of patients with BRAF-mutant, among the metastatic colorectal cancer. BRAF V600E mutations are observed in 75% of BRAF mutations2,3. Because most patients with BEAF-mutant colorectal cancer are in advanced disease at initial diagnosis, despite the ongoing advances in the combination of radiotherapy, chemotherapy, and surgery, which is closely related to the high recurrence rate of BRAF-mutant colorectal cancer4.
Recent studies have shown that the recurrence time after curative resection of colorectal cancer5is an independent survival factor, and the overall survival rate of patients with early recurrence is often lower than that of patients with late recurrence. Therefore, the prediction of early recurrence is of great significance for further follow-up monitoring and treatment of patients with BRAF-mutant colorectal cancer6–8.
Computed tomography is recommended by NCCN (National Comprehensive Cancer Network, NCCN) guidelines as the preferred imaging examination for colorectal cancer in clinical practice9,10. CT imaging does not rely on the subjective evaluation of radiologists. By extracting high-dimensional image features from tumor lesions, CT image pixels and their arrangement can be measured objectively and quantitatively11. By combining a large number of extracted features with machine learning technologies (K-nearest neighbor, support vector machine, decision tree and random forest), radiomics can not only deeply excavate invisible and abstract image features12, but also thus provide a new approach for screening the“suitable population”for BRAF-MAPK-targeted drugs and providing new ideas for accurately evaluating preoperative early recurrence prediction in patients with BRAF-mutant colorectal cancer.
Previous studies13,14have confirmed the potential of CT imaging in prognostic assessment of colorectal cancer. Negreros et al15. retrospectively analyzed traditional imaging features of CT portal phase images in 145 patients with colorectal cancer, and the results showed that lower skewness value and higher mean value of the omics features were significantly positively correlated with better 5-year OS in patients with colorectal cancer (P< 0.05). However, although previous scholars have conducted ct-based texture analysis or radiomics studies on prognostic prediction of patients with colorectal cancer, they only used a single machine learning algorithm to build models, and have not compared the predictive power of different learning models, resulting in some deficiencies in the selection of clinical practical applications16,17. We used four common algorithms for modeling machine learning, including Ada (Adaptive Boosting, Ada), MLP (Multi-Layer Perceptron, MLP), NB (Naive Bayes, NB), and RF (Random Forest, RF), which have not been used to predict early recurrence in patients with BRAF-mutant colorectal cancer before surgery.
Therefore, the objective of this study was to establish and validate a radiomics model, clinico-pathological model, and radiomics-clinical model based on CT imaging characteristics combined with different machine learning methods to predict early recurrence in patients with BRAF-mutated colorectal cancer and to evaluate the predictive efficacy of different models.
Materials and methods
Patients
We retrospectively collected clinical, pathologic, radiographic, and laboratory data of patients with surgically confirmed BRAF-mutated colorectal cancer between May 2015 and December 2017. Contrast-enhanced CT was performed in the Cancer Hospital Affiliated to Nantong University and Affiliated Nantong Hospital 3 of Nantong University radiology department within 1 week before surgery. All patients also had to meet the same follow-up requirement (at least 3 years of follow-up or until death). Cancer Hospital Affiliated to Nantong University and Affiliated Nantong Hospital 3 of Nantong University ethics committee approved the study and waived the requirement for informed consent. The patient recruitment pathway and patient inclusion and exclusion details are summarized in Supplementary file 1and Fig. 1.The inclusion criteria were as follows:1.pathologically confirmed Colorectal cancer; 2.without any prior treatment before surgical resection; 3.Patients with BRAF mutation-positive; 4.preoperative CT data acquired in our hospital; 5.recevied surgical resection within 15 days of CT image acquisiton. The exclusion criteria were as follows: 1.preoperative therapy(neoadjuvant chemotherapy or radiotherapy); n = 80; 2. without BRAF mutation test; n = 130; 3.suffering from other tumor disease at the same period; 4.insufficient CT quality; n = 120; 5.the time interval between CT and surgery was longer than 15 days. n = 100.
Fig. 1.

Flow chart of patients’ recruitment pathway.
A total of 220 patients with BRAF mutant colorectal cancer underwent surgery within 7 days of enhanced CT. The 153 patients included were randomized to a training group (n = 108) or an internal validation group (n = 45) in a 7:3 ratio for modeling and internal validation, and 67 patients collected from the radiology department of Affiliated Nantong Hospital 3 of Nantong University Hospital were used for external validation of the model. The process for the selection of study subjects is shown in Fig. 1. Pathological staging was re-evaluated according to the AJCC8 staging system. Baseline clinical features, pathological data and postoperative follow-up data were obtained by reviewing medical.
records or pathological reports (including patient age, gender, tumor location, tumor size, pathological T stage, pathological N stage, lymphatic vessel invasion, lymph node metastasis, gene expression status, preoperative CEA level, postoperative adjuvant therapy, etc.).
A statement of ethics approval
The study was approved by the ethics committee of the Cancer Hospital Affiliated to Nantong University and Affiliated Nantong Hospital 3 of Nantong University, and the requirement of informed consent was exempted. And the study was performed in accordance with the ethical standards as laiddown in the 1964 Declaration of Helsinki and its later amendments or comparable ethical standards. The authors of this manuscript declare no relationships with any companies, whose products or services may be related to the subject matter of the article. No complex statistical methods were necessary for this paper. Written informed consent was waived by the Institutional Review Board. Institutional Review Board approval was obtained.
Follow-up
Each patient was followed up an average of 4 times in the first year after surgery, 2 times in the second year, and once a year after the third year. Physical examination, laboratory examination (CEA and other assessments) were performed at each follow-up, and endoscopic and abdominal enhanced CT examinations were performed every 6 months or 1 year. Tumor recurrence was defined as local recurrence or metastasis on abdominal contrast CT. Follow-up duration was defined as 3 years from the date of surgery or recurrence. Early postoperative recurrence was defined as recurrence within 3 years.
CT acquisition and segmentation
All patients underwent standard abdominal enhanced CT scans performed within 1 week of surgery, using images obtained from Siemens Sensation 64 CT scanners (Siemens Healthcare, Forchheim, Germany).
The patient was fasted 4 h prior to examination and filled with 800–1000 mL of water 10–15 min prior to examination. Scanning was performed in the head-advanced position with the patient supine and quiet breathing. Scanned abdominal lesions range from the apex of the diaphragm to the symphysis pubis. Scanning parameters: tube voltage 120 kVP, tube current 200mAs, FOV 300 mm×300 mm; matrix 512 × 512; layer thickness and distance 5 mm. Computed tomography was performed first, followed by intravenous injection of the contrast agent iohexol (iodine 300 mg/mL, Yanziang Pharmaceuticals, China) through the elbow at a rate of 3 mL/s (at 1-1.5 ml/kg) and a delay of 65 s for portal-phase imaging. CT images obtained from the scans and reconstructed images were transferred to the PACS (Picture Archiving and Communication Systems, PACS) medical imaging system.Images were imported in DICOM (Digital Imaging and Communications, DICOM) 3.0 format. It is shown in Supplementary file 2.
The workflow of this study is illustrated in Fig. 2. Taking into account that the CT portal phase is the best scan phase for the appearance of colorectal cancer, tumor segmentation was performed with CT portal phase images of 5 mm in thickness transmitted to the free open source software ITK-SNAP 3.8.0 (http://www.itksnap.org/). For each patient with colorectal cancer, the lesion was delineated as a whole tumor volume. The 3D ROI (three-dimensional region of interest, 3D ROI) was mapped by manually delineating the tumor ROI layer by layer on the horizontal axial CT portal phase (thickness of 5 mm) image by a radiologist with 8 years of experience in imaging diagnosis of the abdomen and pelvis. The 3D ROI was defined as follows: Enhanced CT revealed that the entire primary tumor was delineated by manually delineating abnormal areas along the portal phase that differed from normal bowel structure. Tumor ROIs were drawn to include as much of the tumor as possible, avoiding tracheal gas, intestinal fluid, and feces. Confirmation was obtained by another radiologist who had undergone pelvic radiographic diagnosis for more than 15 years, and consensus was reached after discussion if objections were raised. During image segmentation, both radiologists were blinded to the patient’s prognosis.
Fig. 2.

Workflow of radiomic analysis.
Radiomics feature extraction and selection
Using the open-source tool Pyradiomics 3.5 (http://pyradiomics.readthedocs.io/en/latest), 828 3D imaging histological features were extracted from 2D images and 3D images, including first order features, GLCM (gray level co-occurrence matrix, GLCM), GLRLM (gray level run length matrix, GLRLM), GLSZM (gray level size zone matrix, GLSZM), GLDM (gray level dependence matrix, GLDM), and shapes, a total of 18 original first order histogram features, 68 original texture features, 14 shapes, and 240 laplace of gaussian (LoG) transformed features (log represents the level at which the original images were processed by Laplace space filters, 1_0_mm, 2_0_mm, 3_0_mm, and 5_0_mm represents the filter parameter values), and 488 wavelet filters (HHH, HHL, HLL, LLL, LHH, LLH, LHL, and so on) were analyzed. Of these, first-order characteristics describe the distribution of voxel or voxel intensity within ROI, and morphological characteristics describe the shape and volume of ROI.In addition, there are raw texture features that mainly reflect the gray-field distribution of the images, Gaussian-filtered transition features that reflect the differences in the edge properties and gray-field variations of the images, and spectral-filtered features that reflect the different frequency ranges of the raw images.
ICC image analysis
CT images of 30 patients were randomly selected from the training group to calculate inter-and intra-class correlation coefficients (ICCs) of 3D image omics features, which were used to evaluate the inter-group and intra-group consistency of image omics feature extraction. The above two physicians (physicians A and B) simultaneously manually delineated 3D ROI for 30 patients and extracted 3D image radiomics features, respectively, to observe inter-group consistency. A week later, radiologist A, who had 8 years of experience in abdominal and pelvic imaging diagnosis, again manually sketched 3D ROI for these 30 patients and extracted 3D imaging features separately to evaluate intra-group consistency. ICC > 0.75 was considered to be of good consistency. Due to satisfactory reproducibility, Doctor A did the manual delineation of the 3D ROI of the remaining images independently. In addition, radiologist B, who has been practicing abdominal and pelvic imaging for more than 15 years, examined and confirmed Doctor A’s manual delineation of ROI. If there is any disagreement, the two physicians discuss and reach an agreement.
Construction and evaluation of imaging omics model, clinical model and joint model
Construction and evaluation of 3D imaging omics models of different machine learning
Data were trained and models constructed using LR (logistic regression, LR), Ada (Adaptive Boosting, Ada), Multi-Layer Perceptron (MLP), Naive Bayes (NB), and Random Forest (RF) classifiers. These models were trained with training set data and were evaluated in training sets using ten-fold cross-validation and outcome displayed using box plots. In addition, pooled mean values were obtained for ten training sets, and the model’s comprehensive utility was evaluated in the training set and tested in the training set. The predictive power of the imaging model was assessed by the ROC curve and the AUC, accuracy, sensitivity, and specificity were calculated. Differences in predictive power between models were compared using the Delong test. A total of 100 LGOCVs were used to assess the stability and reliability of the results. All imaging characteristics were selected and model constructs performed in the training group and then evaluated in the validation group.
Clinical model and comprehensive line diagram model building
In the training group, significant clinical predictors were identified using chi-square tests (classifying variables), t-tests, or Mann-Whitney U-tests (continuous variables); then univariate logistic regression analyses were performed to determine whether these clinical predictors were statistically significant (P < 0.05) between groups, and multivariate logistic regression analyses were performed to construct a clinical model.To build a more robust prediction model, these clinical predictors were combined with imaging-histology scores to construct an imaging-histology composite nomogram.The Delong test was used to compare the predictive power of nomogram models, clinical models, and imaging models.To evaluate the concordance between the true and predictive results of radiographic nomograms predicting early recurrence status in BRAF-mutant colorectal cancer using the Hosmer-Lemeshow(HL)test.Final decision curves were drawn to evaluate the net benefit of the nomogram.
Statistical analysis
Statistical analysis was performed using R software (version 4.1.0 https://www.R-project.org) and SPSS software (version 26.0 IBM).Histologic characteristics were abstracted and selected using the mRMRe software package (version 2.1.2). The screened characteristics were analyzed by LASSO-Logistic regression using the glmnet package (version 4.1-2). ROC curves were generated using the pROC package (version 1.18.0). DCA was mapped using the mda package (version 1.6). Baseline clinical data were analyzed statistically using SPSS software (version 26.0IBM).Continuous variables were expressed as mean士SD. Baseline clinical characteristics were compared between training and validation groups using the Chi-square test, t-test, or Mann-Whitney U test. P < 0.05 was considered statistically significant.
The radiomics features were plotted in bars to assess the extent to which each characteristic was selected. Box charts of rad-score were plotted to observe the distribution of rad-score in the early-recurrence positive and negative cohorts. Using multivariate logistic regression, we screened for independent risk factors that predicted early postoperative recurrence and used them to construct column charts that predicted early postoperative recurrence. We used the Hosmer-Lemeshow test to evaluate the conformation of column charts, plotted calibration curves to evaluate the concordance of the column chart prediction with actual results. We used ROC (receiver operating characteristic, ROC) curves to evaluate the diagnostic performance of each model, used the AUC (area under the curve, AUC) to measure the model’s discrimination, used the DeLong test to compare the predictive performance of each model, and used DCA (decision curve analysis, DCA) to assess the model’s net clinical benefit.
Results
Clinical and pathological characteristics
We enrolled 153 patients with pathologically confirmed BRAF-mutant colorectal cancer from the*** center, 73 males and 80 females, with a mean age of 69 ± 7.1 years (range 44 to 83 years). Baseline clinical data of patients in the training and validation groups are shown in Table 1. There were no statistically significant differences between the training and validation groups in terms of sex, age, tumor location, pathological T stage, pathological N stage, KRAS, MSI, LVI, NLR, PLR, or AGR (P > 0.05). PNI and LMR levels were statistically significant between patients in the training group and those in the internal validation group (P < 0.05). Table 2 shows the demographic and clinical characteristics of patients in the training group, internal validation group, and external validation group.
Table 1.
Demographic and clinical characteristics of patients with BRAF-mutant colorectal cancer of the 153 study patients from **** center.
| Characteristic | Value |
|---|---|
| Female sex—no. (%) | 80 (52) |
| Age-yr | |
| Mean ± SD | 69±9 |
| Range | 45-85 |
| Lymphatic vascular invasion—no. (%) | 27 (18) |
| Peripheral nerve invasion—no.(%) | 66(43) |
| Pretreatment LMR level mean± SD | 12±24 |
| Pretreatment CEA level >5 ng/ml—no.(%) | 99 (65) |
Table 2.
Demographic and clinical characteristics of patients with BRAF-mutant colorectal cancer.
| Characteristic | Training cohort n = 108 |
p value | Internal Validation Test cohort n = 45 |
p value | External Validation Test cohort n = 67 |
p value | |||
|---|---|---|---|---|---|---|---|---|---|
| Positive group (n = 48) |
Negative group (n = 60) |
Positive group (n = 25) |
Negative group (n = 20) |
Positive group (n = 23) |
Negative group (n = 44) |
||||
| Age, mean ± SD | 68 ± 8.3 | 71 ± 5.7 | 0.04 | 70±11.0 | 69±7.2 | 0.55 | 68±8.0 | 70±6.2 | 0.34 |
|
Sex (male) (female) |
19 | 10 | 0.21 | 10 | 12 | 0.30 | 8 | 30 | 0.80 |
| 29 | 15 | 15 | 8 | 15 | 14 | ||||
|
Location (Ascending colon) (Transverse colon) (Descending colon) (Sigmoid colon and Rectum) |
15(31.2) | 18(30.0) | 0.89 | 9(36.0) | 4(20.0) | 0.43 | 7(30.4) | 4(9.1) | 0.43 |
| 5(10.4) | 4(6.7) | 4(16.0) | 2(10.0) | 2(8.7) | 4(9.1) | ||||
| 19(39.6) | 25(41.7) | 6(24.0) | 9(45.0) | 3(13.0) | 9(20.5) | ||||
| 9(18.8) | 13(21.7) | 6(24.0) | 5(25.0) | 11(47.9) | 27(61.4) | ||||
|
T stage T1 |
2(4.2) | 2(3.3) | 0.99 | 0(0.0) | 0(0.0) | 0.95 | 0(0.0) | 4(9.1) | 0.99 |
| T2 | 5(10.4) | 6(10.0) | 3(12.0) | 2(10.0) | 1(4.3) | 13(29.5) | |||
| T3 | 17(35.4) | 22(36.7) | 4(16.0) | 8(40.0) | 5(21.7) | 15(34.1) | |||
| T4 | 24(50.0) | 30(50.0) | 18(72.0) | 10(50.0) | 17(73.9) | 12(27.3) | |||
|
N stage N0 |
26(54.2) | 39(65.0) | 0.48 | 14(56.0) | 12(60.0) | 0.58 | 1(4.3) | 33(75.0) | 0.01 |
| N1 | 16(33.3) | 15(25.0) | 7(28.0) | 7(35.0) | 13(56.5) | 7(15.9) | |||
| N2 | 6(12.5) | 6(10.0) | 4(16.0) | 1(5.0) | 9(39.2) | 4(9.1) | |||
|
KRAS (negative) (positive) |
26(54.2) | 39(65.0) | 0.34 | 14(56.0) | 12(60.0) | 1.00 | 12(52.2) | 22(50.0) | 0.86 |
| 22(45.8) | 21(35.0) | 11(44.0) | 8(40.0) | 11(47.8) | 22(50.0) | ||||
| MSI (negative) (positive) | 29(60.4) | 41(68.3) | 0.51 | 16(64.0) | 13(65.0) | 1.00 | 8(34.8) | 28(63.6) | 0.02 |
| 19(39.6) | 19(31.7) | 9(36.0) | 7(35.0) | 15(65.2) | 16(36.4) | ||||
| LVI (negative) (positive) | 41(85.4) | 46(76.7) | 0.37 | 22(88.0) | 17(85.0) | 1.00 | 19(82.6) | 39(88.6) | 0.49 |
| 7(14.6) | 14(23.3) | 3(12.0) | 3(15.0) | 4(17.4) | 5(11.4) | ||||
| PNI (negative) (positive) | 35(72.9) | 21(35.0) | 0.01 | 19(76.0) | 12(60.0) | 0.40 | 14(60.9) | 31(70.5) | 0.42 |
| 13(27.1) | 39(65.0) | 5(24.0) | 8(40.0) | 9(39.1) | 13(29.5) | ||||
| NLR | 2 ± 1.9 | 2.7 ± 0.9 | 0.19 | 3 ± 1.8 | 2.7 ± 0.9 | 0.61 | 3 ± 1.8 | 2.7 ± 0.9 | 0.35 |
| LMR | 19 ± 35.1 | 4 ± 1.8 | 0.01 | 8 ± 6 | 4 ± 1.8 | 0.01 | 7 ± 5 | 3± 2.8 | 0.14 |
| PLR | 112 ± 55.7 | 142 ± 42.7 | 0.01 | 138 ± 72.5 | 134 ± 31.4 | 0.81 | 135 ± 69.3 | 130 ± 68.5 | 0.25 |
Feature selection and model construction
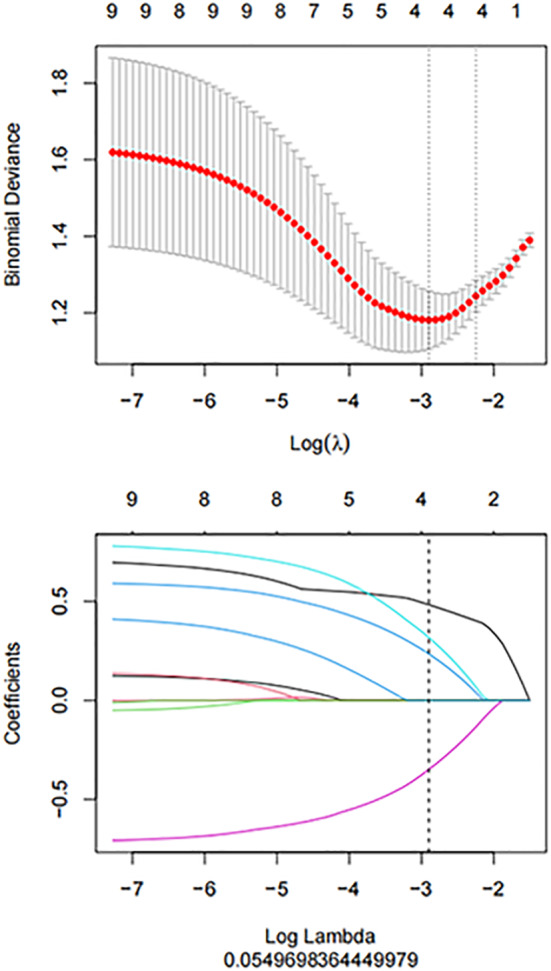
In order to prevent over-fitting of features, dimension reduction is carried out on the data. First, 1218 features were extracted from tumor total volume ROI, and features with ICCs > 0.75 showed good interobserver and intraobserver consistency. Secondly, these features with good consistency were screened using mRMR method to eliminate redundant and irrelevant features, and finally 30 features were retained. Then LASSO-Logistic regression and 10-fold cross-validation adjustment penalty parameter (λ) were used for feature selection.λis the penalty parameter, and minimization criteria and 1-SE criteria can be selected by 10-fold cross-validation (Fig. 3). In this study, the minimization criterion was used to select the best parameter. The optimal feature data set with the smallest cross-validation binomial bias was selected, and the non-zero coefficient was defined as the weight of the selected feature, as shown in Fig. 3. The selected radiomics features and their coefficients are shown in Fig. 4. The.
Fig. 3.

LASSO coefficient profile of the 1024 BRAF-mutation- related features. A coefficient profile plot was produced against the log (λ) sequence; Texture features selection by using the least absolute shrinkage and selection operator (LASSO) binary logistics regression model.
Fig. 4.
Weight of feature coefcients of the candidate model.
Rad-score is then calculated based on the retained features and their corresponding coefficients.
Score each lesion based on the above diagnostic equation. Figure 5 shows box-style scatter plots of Rad-score for patients with and without early and early recurrence 3 years after surgery in the imaging omics model training group and validation group. Wilcoxon test showed that there was a significant difference in Rad-score between the training and validation groups in the presence of 3-year early recurrence (P < 0.05).
Fig. 5.

The boxplot of Rad-score in the BRAF-wild and BRAF-mutation groups.
Evaluating the differential diagnostic efficacy of clinical, imaging and combination models
ROC curve was used to evaluate the diagnostic efficacy of the whole-volume radiomics model in the diagnosis of early recurrence of BRAF mutant colorectal cancer 3 years after surgery. The results showed that the radiomics model had a certain ability to discriminate BRAF-mutated colorectal cancer. The AUC of the training group was 0.81 (95% confidence interval, CI) : 0.73–0.90) in the training group and 0.73 (95%CI: 0.88–0.88) (Fig. 6). We also performed a 100-fold split-group cross-validation (LGOCV) analysis to compare the reliability and stability of five machine-learning models, including LR classifier, for predicting early recurrence 3 years after surgery in BRAF-mutant colorectal cancer, including Ada (Adaptive boosting, Ada), MLP (multi-layer perceptron, MLP), NB (naive bayes, NB), RF (random forest, RF), and calculated AUC, accuracy, sensitivity, and specificity. The results showed that the radiomics model constructed with the RF classifier had the preferior stability and reliability. (Table 3).
Fig. 6.

The ROC curves of the radscore in the training and validation sets.
Table 3.
Comparison of predictive performance between different imaging models of machine learning.
| Model | Accuracy | AUC | Sensitivity | Specificity | PPV | NPV |
|---|---|---|---|---|---|---|
| LR | 0.77 | 0.82 | 0.79 | 0.74 | 0.77 | 0.76 |
| LR | 0.61 | 0.73 | 0.74 | 0.46 | 0.59 | 0.63 |
| Ada Boost | 0.86 | 0.95 | 0.84 | 0.89 | 0.89 | 0.83 |
| Ada Boost | 0.74 | 0.80 | 0.68 | 0.79 | 0.78 | 0.70 |
| MLP | 0.78 | 0.81 | 0.87 | 0.68 | 0.75 | 0.83 |
| MLP | 0.64 | 0.71 | 0.81 | 0.46 | 0.61 | 0.69 |
| Naive Bayes | 0.72 | 0.78 | 0.70 | 0.74 | 0.74 | 0.69 |
| Naive Bayes | 0.61 | 0.70 | 0.74 | 0.46 | 0.59 | 0.63 |
| Random Forest | 0.97 | 0.99 | 0.98 | 0.96 | 0.96 | 0.98 |
| RandomForest | 0.74 | 0.85 | 0.87 | 0.59 | 0.69 | 0.81 |
The AUC values(Table 3) of multiple models for CT imaging omics characteristics, RF model is higher than LR, Ada and NB models, greater than 0. 80; According to the confusion matrix, from CT imaging omics data, the accuracy, sensitivity and specificity of RF model are greater than 0. 90, at the highest level. Therefore, it can be inferred that the RF model established by CT imaging omics features combined with independent risk factor features has the best expression, with the highest level of AUC value, accuracy, sensitivity and specificity, showing the best diagnostic efficacy. Therefore, the subsequent joint model construction was selected based on the RF model. By comparing the CT imaging omics feature model with the feature model after adding independent risk factors, the comprehensive analysis shows that the prediction efficiency of the model is further improved by combining independent risk factors. The Delong test showed the difference of AUC values between clinical model and clinical model (P < 0.05). In order to effectively verify the robustness of the joint model based on RF machine learning, the superiority of the imaging omics model based on RF machine learning in the external validation set was further validated.
Clinical use (Nomogram construction and apparent performance)
Univariate and multivariate logistic regression analyses of clinical factors were performed. Patient age, preoperative PNI, and LMR levels in the training group were statistically significant for predicting early recurrence of BRAF-mutant colorectal cancer (P < 0.05) (Table 4). Given the relative predictive power and superior stability and fitting properties of the RF radiomics models described above. Thus, clinical predictors (patients’preoperative PNI and LMR) were combined with logistic regression rad-scores to construct the radiomics-clinical nomogram (Figs. 7 and 8a). The HL (Hosmer-lemeshos, HL) test showed that aligned plots of the calibration curves predicting BRAF mutations showed good agreement in the training and validation groups (P > 0.05), as shown in Fig. 8b. The predictive power of the radiomics-clinical combined nomogram model was significantly better than that of the clinical model and the radiomcs model using a single random algorithm. DCA curves are used to describe clinical benefit of nomogram models and clinical models.(Fig. 8c).
Table 4.
Independent risk factor identification (multivariate logistic regression analysis).
| Factors | Odds Ratio | p Value | 95% confidence interval | |
|---|---|---|---|---|
| Lower | Upper | |||
| LMR | 0.83 | 0.01 | 0.72 | 0.96 |
| PNI | 3.37 | 0.02 | 1.17 | 9.76 |
| Radscore | 5.03 | <0.001 | 2.22 | 11.38 |
Fig. 7.

ROC curve of radiomics models, clinical model, and the combined model.
Fig. 8.

(a) The developed clinical-radiomics nomogram for predicting the early recurrence in BRAF - mutated patients. (b) The Calibration curve for predicting the early recurrence in BRAF - mutated patients in the training and validation cohort. (c) DCA curve of radscore and the significantly associated clinical features.
Abbreviations: OR, odds ratio; 95% CI, 95% confidence interval; LMR, lymphocyte to monocyte ratio; PNI, perineural infiltration.
The Delong test showed that the AUC values of the RF machine learning and the clinical model test set (P < 0. 05). The difference in AUC values between the combined model based on RF machine learning and the imaging model alone was not statistically significant (P > 0. 05), and the difference in AUC values between the imaging model and the clinical model alone (P > 0. 05).
Discussion
We used LR, Ada, MLP, NB, and RF algorithms to predict early recurrence 3 years after surgery in 220 patients with BRAF-mutated CRC. While the above-mentioned machine learning models demonstrated superior predictive power, the LR-based radiomics model was found to be more robust and more well-matched by the fitteness power test (Hosmer-Lemeshow, HL). Additionally, radiomics-clinical nomograms inclulding LR-based rad-score and clinically independent predictors such as PNI (perineural invasion, PNI), LMR (preoperative lymphocyte and monocyte ratio, LMR) further improved predictive performance. Compared with the clinical model, the nomogram model improved the AUC from 0.81 to 0.88 and the predictive accuracy from 74.1 to 84.3% in the training group; from 0.71 to 0.83 and the predictive accuracy from 64.4 to 77.8% in the internal validation group; and from 0.59 to 0.63 and the predictive accuracy from 56.7 to 58.2% in the external validation group.
Radiomics is the conversion of images into visible data signals by extracting characteristics of the inner tissues of tumors, thereby revealing the cytology, physiology, and genetic information of the inner heterogeneity of cancer tissues18. In our study, we delineated the ROI of the total tumor volume during the portal venous phase of CT. The four imaging characteristics that were ultimately determined directly reflect the intra-tumor heterogeneity. Among these factors, we found several strong features: wavelet.LLH_glszm_ZoneEntropy, which wavelet transforms features into waveforms; and glszm, which reflects the number of groups (so-called regions) of contiguous voxels. previous study also demonstrated a significant correlation between this feature and survival after colorectal cancer surgery15. In the present study, the predictive power of 90 Percentiles in the first order after conversion to a Gaussian filter was also highlighted, and 90 Percentiles were based on the strength of the ROI voxel distribution to reflect tissue heterogeneity. Our results suggest that patients with BRAF-mutant colorectal cancer have a higher risk of early postoperative recurrence with a value of more than 90 Percentiles19. For example, Correlation in glcm refers to the degree of similarity between row or column directions of metric-spatial grey cohomology matrix elements, and the size of the correlation value reflects the local grey correlation in the image. When matrix elements are uniformly equal, the correlation is greater. Therefore, the predictive power of this feature is also evident in the results of this study, indicating a positive correlation with early recurrence after surgery in patients with BRAF-mutant colorectal cancer.
To the best of our knowledge, however, few studies have compared models based on different machine learning algorithms to predict the risk of early recurrence in patients with BRAF-mutant colorectal cancer. However, radiomics has been used in studies of recurrence, metastasis, or survival of colorectal cancer. For example, Meng et al20. derived four clinical and six radiomics features from 108 patients with rectal adenocarcinoma to construct models predicting synchronous distant metastasis in patients with rectal cancer, and found a combined radiomics-clinical characteristic to be a non-invasive biomarker for identifying patients at high risk for synchronous distant metastasis. Unfortunately, the study used only a single LR imaging histology model to predict distant metastases, so the predictive power is unsatisfactory. Furthermore, Fan et al21. performed a clinical study of radiographic prediction of the risk of recurrence of stage II colorectal cancer after surgery, and found that models combined with rad-score and clinical information performed better than clinical models alone. The results suggest that radiomics models are of clinical value in predicting recurrence risk in patients with stage II colorectal cancer and complement their prognostic assessments. However, the model was not externally validated, and the study was a single-center study, with results requiring multicenter validation. However, the previous analyses by these authors are of great reference value for the success of this study. Therefore, in our study, we performed 100-fold fractional cross-validation (LGOCV) analysis comparing LR with other Ada, MLP, NB and RF machine learning classifiers. Cross-validation results showed that radiomics models based on different machine learning classifiers were effective in predicting early postoperative recurrence in patients with BRAF-mutant colorectal cancer, with AUC values ranging from 0.82 to 0.99 in the training group to 0.73–0.85 in the inter validation group. In the present study, these results suggest that the RF imaging model used not only has good predictive power, but also has good stability and is a clinical potential and predictive model.
Compared with previous studies, one of the advantages and bright spots of this study is the ability to compare multiple machine learning models in specific patients with BRAF-mutated colorectal cancer, to screen for RF radiomics models with superior predictive performance and preferred fit, and to validate RF models internally and externally, to further validate and exploit RF-based imaging histology to predict the potential for early recurrence 3 years after surgery in patients with BRAF-mutated colorectal cancer, in order to identify patients at high risk for early recurrence. This may help the clinician optimize the treatment.
Previous studies have suggested that22systemic inflammation is often characterized by neutrophilia and lymphopenia, and the development of inflammation increases the risk of tumor development and early postoperative recurrence.For example, the LMR level is a comprehensive indicator that better predicts long-term prognosis in patients with cancer23. Studies by Doerr24and Schesser25found worse OS (overall survival, OS) in patients with low LMR level, and were more pronounced among late patients. Similarly, in our study, we found that patients with BRAF-mutant colorectal cancer had an increased risk of early postoperative recurrence, as the preoperative LMR declined. From multivariate logistic regression analysis, the OR was 0.82, indicating that patients had a 0.82-fold higher risk of early postoperative recurrence for every 1-fold decrease in preoperative LMR level. We also found that the risk of early recurrence after surgery for BRAF-mutant colorectal cancer was positively associated with peripheral nerve infiltration status. The OR was 4.15, indicating that patients with BRAF-mutant colorectal cancer with positive peripheral nerve infiltrates had a 4.15-fold increased risk of early recurrence after surgery compared with those with negative peripheral nerve infiltrates. Previous studies have also reported26that patients with positive peripheral nerve infiltrates have worse survival prospects for colorectal cancer, often indicating that the tumor is more proliferative and aggressive, thereby increasing the risk of early recurrence.
Thus, in our study, we combined a more stable RF-based rad-score with clinically independent predictors of superiority such as peripheral nerve infiltration status, preoperative lymphocyte and neutrophil ratios to construct an comprehensive nomogram. In terms of both the ease of clinical application and the cost of use, the ability to calculate the probability of early recurrence in patients with BRAF-mutant colorectal cancer with just one ruler is undoubtedly an even greater advantage for Nomogram. Additionally, among the variables included in the nomograms constructed in this study, the odds ratio for rad-score was higher than that for peripheral nerve infiltration status, the ratio of preoperative lymphocytes to monocytes, and other clinical factors. These findings suggest that radiomics features may improve the prediction of clinical risk factors, but the specific incremental value of histological models relative to a single model remains to be determined and is a major area of interest.
The present study has some limitations. First, a retrospective design was used. Although sample selection adopted strict inclusion and exclusion criteria, selection bias remained unavoidable. Therefore, prospective studies are warranted in the future. Second, this study included a small number of patients with BRAF-positive colorectal cancer, and future studies are needed to further validate the usefulness of developed nomograms for predicting early postoperative recurrence in patients with BRAF-mutant colorectal cancer. Finally, the patients included in this study were all surgical patients, and the integrated nomogram model developed in the future should be validated in a nonsurgical patient population.
In summary, the independent risk factors for early postoperative recurrence in patients with BRAF-mutant colorectal cancer include positive peripheral nerve infiltration and a low preoperative LMR level. We used machine learning and integrated nomograms to predict the risk of early recurrence after surgery for BRAF-mutant colorectal cancer, and the established clinical, imaging, and integrated nomogram models have good predictive power and accuracy. In the future, more effective and convenient tools should be developed to help clinicians analyze the risk of early recurrence in patients with BRAF-mutant colorectal cancer.
Electronic supplementary material
Below is the link to the electronic supplementary material.
Abbreviations
- CRC
Colorectal cancer
- AUC
Area under the ROC curve
- A/G
Albumin/globulin ratio
- CEA
Carcinoembryonic antigen
- DCA
Decision curve analysis
- EGFR
Epidermal growth factor receptor
- MAPK
mitogen-activated protein kinase
- PI3K
phosphatidylinositol 3 kinase
- FFPE
Formalin-fixed, paraffin-embedded
- GLCM
Gray-level co-occurrence matrix
- GLDM
Gray-level dependence matrix
- GLRLM
Gray-level run length matrix
- GLSZM
gray-Level size zone matrix
- SDE
Small dependence emphasis
- BRAF
V-raf murine sarcoma viral oncogene homolog B1
- LR
Logistic regression
- PNI
Peripheral nerve infiltration
- CT
Computed tomography
- NCCN
National Comprehensive Cancer Network
- PACS
Picture archiving and communication system
- ROC
Receiver operating characteristic
- VOI
Volume of interest
Author contributions
Zhenbin Jin: Conceptualization, Data curation, Methodology, Writing-original draft, Software, Investigation. Qin Zou: Resources, Investigation, Validation. TaoHu Zhou: Visualization, Investigation. Ting Xue: Conceptualization, Methodology, Writing - review & editing, Funding acquisition.
Funding
This work was supported by the Youth project start-up Fund [2022QN091].
Data availability
The experimental data is provided in the supplement. Additional data on the individual case level can be requested from the corresponding author.
Declarations
Conflict of interest
The authors of this manuscript declare no relationships with any companies, whose products or services may be related to the subject matter of the article. Statistics and biometry TaoHu Zhou, the co-author of this manuscript, has significant statistical expertise.
Informed consent
Written informed consent was waived by the Institutional Review Board.
Ethical approval
Institutional Review Board approval was obtained. Methodology: Retrospective, Case-control study, Performed at two institution.
Footnotes
Publisher’s note
Springer Nature remains neutral with regard to jurisdictional claims in published maps and institutional affiliations.
References
- 1.Antonia, R. et al. Molecular biomarkers for the evaluation of colorectal cancer [J]. J. Mol. Diagn.19 (2), 187–225 (2017). [DOI] [PMC free article] [PubMed] [Google Scholar]
- 2.Edoardo, I. et al. Clinico-pathological associations colorectal cancer [J]. Transl Med.137 (17), 1–10 (2019). [DOI] [PMC free article] [PubMed] [Google Scholar]
- 3.Eurboonyanun, K. et al. Imaging predictors of BRAF mutation in colorectal cancer [J]. Abdom Radiol (NY), 45(8): 2336–2344., Chemotherapy with preoperative radiotherapy in rectal cancer [J]. N Engl J Med, 2006, 355(11): 1114–1123. (2020). [DOI] [PubMed]
- 4.Qin, S. et al. Efficacy and tolerability of first-line cetuximab plus leucovorin, fluorouracil, and oxaliplatin (FOL-FOX-4) versus FOLFOX-4 in patients with RAS wild-type metaatatic colorectal cancer: the open-label, radomized, phase III TAILOR trial [J]. J. Clin. Oncol.36 (30), 3031–3039 (2018). [DOI] [PMC free article] [PubMed] [Google Scholar]
- 5.Davey, S. & McCarthy, K. Cutaneous stomal recurrence of colorectal cancer after curative rectal cancer surgery-a case report and systematic review [J]. In Vivo, 34: 2193–2199. (2020). [DOI] [PMC free article] [PubMed]
- 6.Duineveld, L. et al. Symptomatic and asymptomatic colon cancer recurrence: a multicenter cohort study [J]. Ann. Fam Med.14, y215–220 (2016). [DOI] [PMC free article] [PubMed] [Google Scholar]
- 7.Stiksma, J., Grootendorst, D. & Linden, P. CA 19 – 9 as a marker in addition to CEA to monitor colorectal cancer [J]. Clin. Colorectal Cancer. 13, 239–244 (2014). [DOI] [PubMed] [Google Scholar]
- 8.Tan, E. et al. Diagnostic precision of carcinoembryonic antigen in the detection of recurrence of colorectal cancer [J]. Surg. Oncol.18, 15–24 (2009). [DOI] [PubMed] [Google Scholar]
- 9.Mazurowski, A. Radiogenomics: what it is and why it is important [J]. J. Am. Coll. Radiol.12 (8), 862–866 (2015). [DOI] [PubMed] [Google Scholar]
- 10.Yang, L. et al. Can CT-based radiomics signature predict KRAS/NRAS/BRAF mutations in colorectal cancer [J]. Eur. Radiol.28 (5), 2058–2067 (2018). [DOI] [PubMed] [Google Scholar]
- 11.Dhruv, B., Mittal, N. & Modi, M. Study of Haralick’s and GLCM texture analysis on 3D medical images [J]. Int. J. Neurosci.129 (4), 350–362 (2019). [DOI] [PubMed] [Google Scholar]
- 12.Davnall, F. et al. Assessment of tumor heterogeneity: an emerging imaging tool for clinical practice [J]. Insights Imaging. 3 (6), 573–589 (2012). [DOI] [PMC free article] [PubMed] [Google Scholar]
- 13.Aerts, H. et al. Decoding tumour phenotype by noninvasive imaging using a quantitative radiomics approach [J]. Nat. Commun.5 (6), 4006 (2014). [DOI] [PMC free article] [PubMed] [Google Scholar]
- 14.Coroller, T. et al. CT-based radiomic signature predicts distant metastasis in lung adenocarcinoma [J]. Radiother Oncol.114 (3), 345–350 (2015). [DOI] [PMC free article] [PubMed] [Google Scholar]
- 15.Negreros, A. et al. Radiomics texture features in Advanced Colorectal Cancer: correlation with BRAF Mutation and 5-year overall survival [J]. Radiol. Imaging Cancer. 2 (5), 190084 (2020). [DOI] [PMC free article] [PubMed] [Google Scholar]
- 16.He, K. et al. Noninvasive KRAS mutation estimation in colorectal cancer using a deep learning method based on CT imaging [J]. BMC Med. Imaging. 20 (1), 59 (2020). [DOI] [PMC free article] [PubMed] [Google Scholar]
- 17.Emblem, E. et al. A generic support vector machine model for preoperative glioma survival associations [J]. Radiology. 275 (1), 228–234 (2015). [DOI] [PubMed] [Google Scholar]
- 18.Lambin, P. et al. Radiomics: the bridge between medical imaging and personalized medicine [J]. Nat. Rev. Clin. Oncol.14 (12), 749–762 (2017). [DOI] [PubMed] [Google Scholar]
- 19.Wu, S. et al. Development and validation of an MRI-Based Radiomics signature for the preoperative prediction of Lymph Node Metastasis in bladder Cancer [J]. EBioMedicine. 34, 76–84 (2018). [DOI] [PMC free article] [PubMed] [Google Scholar]
- 20.Meng, Y. et al. Novel radiomic signature as a prognostic biomarker for locally advanced rectal cancer [J]. J. Magn. Reson. Imaging. 48, 605–614 (2018). [DOI] [PubMed] [Google Scholar]
- 21.Fan, S. et al. CT-based radiomics signature: a potential biomarker for predicting postoperative recurrence risk in stage II colorectal cancer [J]. Front. Oncol.11, 644933 (2021). [DOI] [PMC free article] [PubMed] [Google Scholar]
- 22.Pillay, J. et al. A subset of neutrophils in human systemic inflammation inhibits T cell responses through Mac-1 [J]. J. Clin. Investig.122 (1), 327–336 (2012). [DOI] [PMC free article] [PubMed] [Google Scholar]
- 23.Aziz, M. H. et al. The systemic-immune-inflammation index independently predicts survival and recurrence in Resectable Pancreatic Cancer and its Prognostic Value depends on bilirubin levels: a retrospective Multicenter Cohort Study [J]. Ann. Surg.270 (1), 139–146 (2019). [DOI] [PubMed] [Google Scholar]
- 24.Doerr, T. D. et al. Effects of zinc and nutritional status on clinical outcomes in head and neck cancer [J]. (1998). (Burbank, Los Angeles County, Calif), 14 (6): 489–495 . [DOI] [PubMed]
- 25.Schiesser, M. et al. The correlation of nutrition risk index, nutrition risk score, and bioimpedance analysis with postoperative complications in patients undergoing gastrointestinal surgery [J]. Surgery. 145 (5), 519–526 (2009). [DOI] [PubMed] [Google Scholar]
- 26.Sun, Q. et al. Perineural and lymphovascular invasion predicts for poor prognosis in locally advanced rectal cancer after neoadjuvant chemoradiotherapy and surgery [J]. J. Cancer. 10 (10), 2243–2249 (2019). [DOI] [PMC free article] [PubMed] [Google Scholar]
Associated Data
This section collects any data citations, data availability statements, or supplementary materials included in this article.
Supplementary Materials
Data Availability Statement
The experimental data is provided in the supplement. Additional data on the individual case level can be requested from the corresponding author.