

Abstract
Beliefs have a powerful influence on our behavior, yet their neural mechanisms remain elusive. Here we investigate whether beliefs could impact brain activities in a way akin to pharmacological dose-dependent effects. Nicotine-dependent humans were told that nicotine strength in an electronic cigarette was either ‘low’, ‘medium’ or ‘high’, while nicotine content was held constant. After vaping, participants underwent functional neuroimaging and performed a decision-making task known to engage neural circuits affected by nicotine. Beliefs about nicotine strength induced dose-dependent responses in the thalamus, a key binding site for nicotine, but not in other brain regions such as the striatum. Nicotine-related beliefs also parametrically modulated the connectivity between the thalamus and ventromedial prefrontal cortex, a region important for decision-making. These findings reveal a high level of precision in the way beliefs influence the brain, offering mechanistic insights into humans’ heterogeneous responses to drugs and a pivotal role of beliefs in addiction.
Human beliefs have a profound impact on our behaviors. Although subjective in nature, beliefs—similar to other mental functions—are represented by biological substrates in the brain1,2. However, the exact mapping between subjective beliefs and neurobiological substrates remains largely unknown, hindering our understanding of conditions such as drug addiction, where purely biochemical explanations are not sufficient to account for the complexity of the disorder3,4. Elucidating the precise neural mechanisms of beliefs is also important for understanding how beliefs and expectations play a role in pharmacological treatments, where individuals’ drug response differs drastically5.
The dose–response relationship, or the mapping between the amount of a substance and biological responses to that substance, is central to pharmacological research6–8. Dose responses in the brain have been observed across many neuroactive drugs including nicotine9, alcohol10 and marijuana11. However, such inquiry has rarely existed in neuroscience research on human beliefs. Placebo and nocebo effects might represent the most well-known examples of how beliefs can affect neurobiology. In these observations, one’s symptoms can improve (in the case of placebo) or worsen (in the case of nocebo) as a function of the believed effectiveness of pharmacological agents5,12–15. For example, the degree to which a patient believes their symptom might improve owing to antidepressant treatment contributes to their actual improvement in a parametric fashion16,17. Even in the presence of a powerful addictive substance such as nicotine, beliefs have been shown to exert a binary, all-or-none type of effect on neural responses in human smokers18,19. These initialobservations have led to a key question—could beliefs parametrically modulate neurophysiological responses in a dose-dependent manner, analogous to pharmacological dose effects? This is an important inquiry, as people often hold beliefs of various degrees or strengths (instead of all-or-none), depending on the complex interaction of a vast number of continuous variables such as how strong or effective they think the drug might be or how much they trust the person delivering the drug.
In this Article, we hypothesize that beliefs about substances (for example, nicotine) can modulate brain activities in a manner similar to pharmacologically induced dose-dependent responses. We use nicotine as a test case, as nicotine is one of the most potent neuroactive substances20,21 yet still subjective to modulation by cognitive factors22,23. Nicotine is known to broadly affect distributed regions in the brain, including the thalamus and the striatum24,25, both of which are important for cognition and decision-making26–28. The thalamus, in particular, contains the highest density of nicotinic acetylcholine receptors (nAChRs) across the entire human brain29,30. Nicotine binds to these receptors, leading to subsequent dopamine release in mesolimbic structures, such as the ventral striatum24,31. In humans, however, nicotine is not a necessary condition for the activation of nAChRs. Positron emission tomography imaging studies demonstrate that there can be a substantial degree of occupancy of nAChRs, with the most profound effects in the thalamus, even when smokers only had denicotinized cigarettes29,32 or second-hand smoke33. These findings pinpoint to the possibility that nicotine itself is not sufficient to account for the complex behaviors and neural effects observed in humans. Instead, cognitive constructs, such as nicotine-related beliefs, may play a crucial role in modulating addiction neurobiology.
Here, we investigate whether nicotine dosage-related beliefs can exert dose-dependent effects on the human brain by measuring neural activities in nicotine-dependent humans (see Table 1 for participant characteristics) after they vaped an electronic cigarette (e-cigarette) that they believed to contain either ‘low’, ‘medium’ or ‘high’ levels of nicotine, while nicotine content was fixed across conditions. Based on the literature reviewed so far, we predicted that activity in the thalamus, a region enriched with nAChRs34–37, would exhibit dose-dependent responses modulated by beliefs. At the circuit level, the thalamus is known to contribute to higher-order cognition via its cortical connections38. Subnuclei of the thalamus with the highest nAChR densities are well connected with the prefrontal cortex39. In particular, both anatomical and functional connections exist between the thalamus and the ventromedial prefrontal cortex (vmPFC)40,41, a cortical region important for representing belief states and task structures42,43. As such, we also predict that thalamus–vmPFC functional coupling would vary as a function of nicotine dosage-related beliefs.
Table 1 |.
Demographics and smoking-related characteristics of included and excluded smokers
| Included smokers (N = 20) | Excluded smokers (N = 3) | |
|---|---|---|
| Sex | ||
| Male (%) | 13 (65%) | 3 (100%) |
| Female (%) | 7 (35%) | 0 (0%) |
| Age (years) | 40.6 (12.3) | 36.7 (12.7) |
| Race | ||
| Asian | 6 (30%) | 1 (33.3%) |
| Black or African American | 3 (15%) | 0 (0%) |
| White | 10 (50%) | 2 (66.7%) |
| American Indian or Alaska Native | 0 (0%) | 0 (%) |
| Native Hawaiian or other Pacific Islander | 0 (0%) | 0 (%) |
| Prefer not to answer | 1 (5%) | 0 (%) |
| Ethnicity | ||
| Hispanic | 2 (10%) | 0 (0%) |
| Non-Hispanic | 18 (90%) | 3 (100%) |
| Prefer not to answer | 0 (0%) | 0 (0%) |
| Education | ||
| High school | 7 (20%) | 0 (0%) |
| College | 4 (35%) | 0 (0%) |
| Bachelor’s degree | 7 (20%) | 1 (33.3%) |
| Graduate degree | 5 (25%) | 0 (0%) |
| N/A | 0 (0%) | 2 (66.7%) |
| Average number of cigarettes per day | 16.2 (5.1) | 20 (0) |
| Age of first cigarette (years) a | 16.2 (3.6) | 16 (0) |
| Age of daily smoking (years) a | 18.2 (2.6) | 20 (0) |
For categorical variables, values are presented as numbers (percentages). For noncategorical variables, values are presented as mean (s.d.). N/A, information not available.
Information not available for one included smoker and two excluded smokers.
Results
Instructions influenced smokers’ beliefs about nicotine
Each smoker underwent three identical experimental sessions, with the key between-session difference being that they were instructed to believe the nicotine strength in the e-cigarette to be either ‘low’, ‘medium’ or ‘high’ (Fig. 1a; see Methods for details). Belief conditions were randomized and conducted in a double-blind manner, and the final sample included 60 scans across 20 smokers (see Fig. 1b for details about participant recruitment). To examine if our key experimental manipulation of beliefs indeed induced changes in subjective beliefs about nicotine strength, we asked all participants to rate their perceived nicotine strength using a ten-point scale after vaping. Overall, participants’ perceived nicotine strength significantly increased as a function of instructed beliefs about nicotine dosage (mean ± s.d.: 3.52 ± 0.61 for ‘low’, 4.52 ± 0.41 for ‘medium’ and 5.82 ± 0.47 for ‘high’; repeated-measures analysis of variance (rmANOVA): F(2, 38) = 9.71, P = 0.0004, partial η2 of 0.34, 90% CI of 0.12 ≤ η ≤ 048; Fig. 1b), supporting the validity of our experimental manipulation.
Fig. 1 |. Experimental paradigm and sanity check measures.
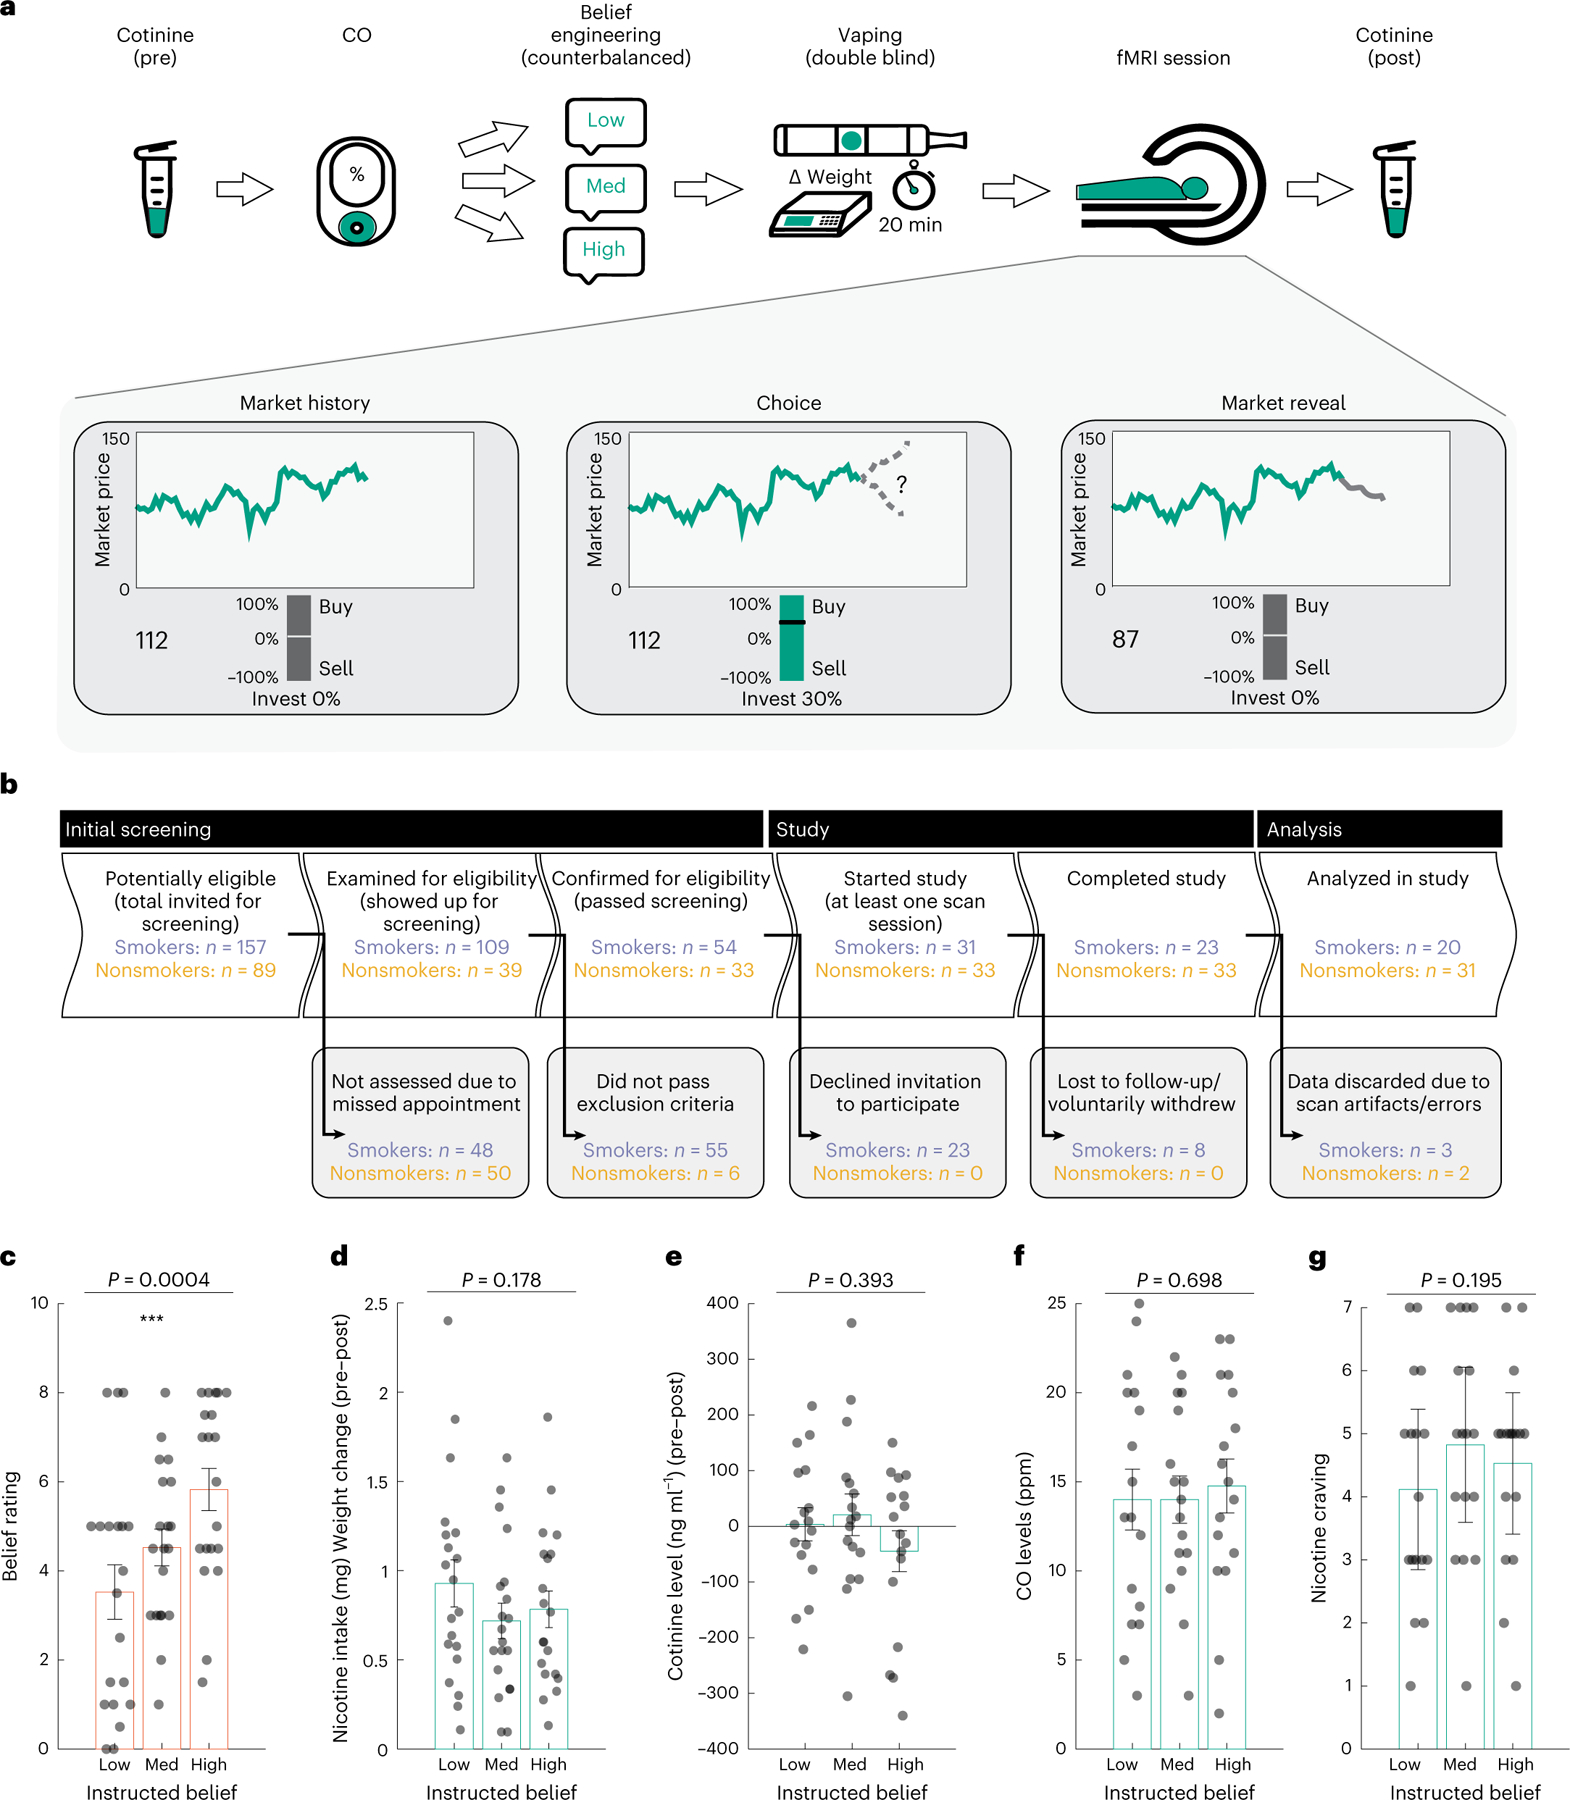
a, A diagram of the experimental paradigm for each visit of the participants. Participants completed three visits. In each visit, we collected saliva samples for cotinine measurement and assessed exhaled carbon monoxide (CO) levels, instructed participants about nicotine strength and then had them vape the e-cigarette. Afterwards, we measured their brain activities using fMRI as participants engaged in a decision-making task and collected a second saliva sample post-scan. b, A STROBE flow chart of participant recruitment and analysis of smokers (purple) and nonsmoking HCs (orange). c, Subjective beliefs about nicotine strength increased as a function of instructed nicotine strength (n = 20 participants, rmANOVA P = 0.0004). d, The consumed nicotine was similar across three belief conditions (n = 20 participants, rmANOVA P = 0.178), e–g, Cotinine concentration (n = 17 participants, rmANOVA P = 0.393) (e), CO level (n = 17 participants, rmANOVA P = 0.698) (f) and nicotine craving (n = 17 participants, rmANOVA P = 0.195) (g) did not differ between instructed belief conditions. The vertical bars depict group means, and the points represent participants. Orange and teal rectangles depict belief rating, and nicotine consumption measurements, respectively. The error bars depict the s.e.m. ***P < 0.001.
No effect on nicotine intake, metabolism and saturation
Next, we took extensive sanity checks to ensure the instruction did not interfere with participants’ nicotine intake, metabolism or their baseline nicotine saturation or craving levels. First, previous work has demonstrated that nicotine content (in traditional cigarettes) might affect how much smokers ingest (for example, compensation in low nicotine conditions)9. To control for this, we set vaping time to 20 min during data collection (Methods). Importantly, we also quantified the amount of nicotine intake, defined as the change in cartridge weight after vaping multiplied by the actual percentage of nicotine content (1.2%). We found that nicotine intake did not differ across belief conditions (nicotine intake (mg): 0.928 ± 0.56 for ‘low’, 0.719 ± 0.423 for ‘medium’ and 0.783 ± 0.434 for ‘high’; rmANOVA F(2, 38) = 1.806, P = 0.178; Fig. 1c), suggesting that the difference in belief about nicotine did not affect how much liquid or nicotine was consumed by the smokers. Participants’ perceived nicotine strength ratings were not associated with actual nicotine intake (Spearman correlation, r = 0.135, P = 0.303), further suggesting their ratings were primarily driven by the experimental manipulation of instruction instead of consumed nicotine amount. Lastly, to alleviate concerns of experience forming over the course of the experiment (from first to last session), we compared nicotine intake across the chronological order of sessions and found no order effect (nicotine intake (mg): 0.789 ± 0.378 for first, 0.789 ± 0.563 for second and 0.851 ± 0.490 for third session; rmANOVA F(2, 38) = 1.815, P = 0.835).
We also collected saliva samples both before and after vaping to examine if cotinine—a nicotine metabolite indicative of plasma nicotine levels44—differed between conditions using high-performance liquid chromatography tandem mass spectrometry (Methods). Vaping-induced changes in cotinine concentrations (ng ml−1) were comparable across conditions (mean ± s.d.: 3.565 ± 111.464 for ‘low’, 20.671 ± 145.406 for ‘medium’ and −44.515 ± 142.649 for ‘high’; rmANOVA F(2, 32) = 0.959, P = 0.393; Fig. 1d), suggesting that nicotine metabolism itself was unlikely to be a factor contributing to any brain-based differences.
Finally, we measured exhaled carbon monoxide (CO) and craving before vaping as an index of participants’ baseline nicotine saturation level. Baseline CO (parts per million (ppm); mean ± s.d.: 14.000 ± , 6.615 for ‘low’, 14.000 ± 5.145 for ‘medium’ and 14.764 ± 5.876 for ‘high’, range: 2–25 ppm; rmANOVA F(2, 32) = 0.364, P = 0.698; Fig. 1e) and craving (mean ± s.d. (AU): 4.000 ± 1.764 for ‘low’, 4.947 ± 1.669 for ‘medium’ and 4.737 ± 1.584 for ‘high’; rmANOVA F(2, 32) = 1.722, P = 0.195; Fig. 1f) were both comparable across conditions.
Together, these analyses confirmed that our instruction successfully influenced participants’ beliefs about nicotine strength, while mitigating the concern that imbalanced nicotine consumption, metabolism or baseline deprivation might have contributed to any neural differences across conditions.
Thalamic activity represented beliefs about nicotine strength
Our main question here is regarding how the beliefs about nicotine mapped onto neural activities in smokers. To this end, participants performed a functional magnetic resonance imaging (fMRI) task known to engage brain circuits involved in reward processing and affected by addiction22,23,45. Specifically, we used a sequential investment task (Fig. 1a and Methods) that has been previously used to probe reward processing in both smokers and nonsmokers18,19,46,47, in which participants made sequential investment choices in simulated stock markets based on one’s prediction of market return . Because subjects were allowed to place either positive (‘buy’) or negative (‘short-sell’) bets, they could win (or lose) money in either positive or negative markets, and the absolute value represents the actual reward value attainable to the subject. A group of nonsmoking healthy controls (HCs, n = 31) also performed the same fMRI task but without going through the vaping procedure.
We carried out a whole-brain analysis of variance (ANOVA) with belief as the main factor (‘low’, ‘medium’ or ‘high’) and the value signal as the key parametric modulator (Methods), to ask what neural substrates might represent beliefs about nicotine dose. We observed that value-related neural activities in the thalamus exhibited a dose-dependent response to instructed beliefs about nicotine strength (peak at Montreal Neurological Institute (MNI) coordinates of x = −15, y = −19, z = −1; P < 0.05; family-wise error (FWE) cluster corrected at a cluster-defining threshold of P < 0.005 and uncorrected at k = 50, P = 0.006; Fig. 2a). No other brain structures showed a similar pattern in response to beliefs with the same statistical threshold (Supplementary Fig. 1a). This effect was stronger in the earlier half of the session (Supplementary Fig. 1b–d) and was not due to either sensorimotor or technical (for example, fMRI data smoothing) confounding effects (Supplementary Information and Supplementary Fig. 2).
Fig. 2 |. Belief about nicotine strength induced dose-dependent responses in the thalamus.
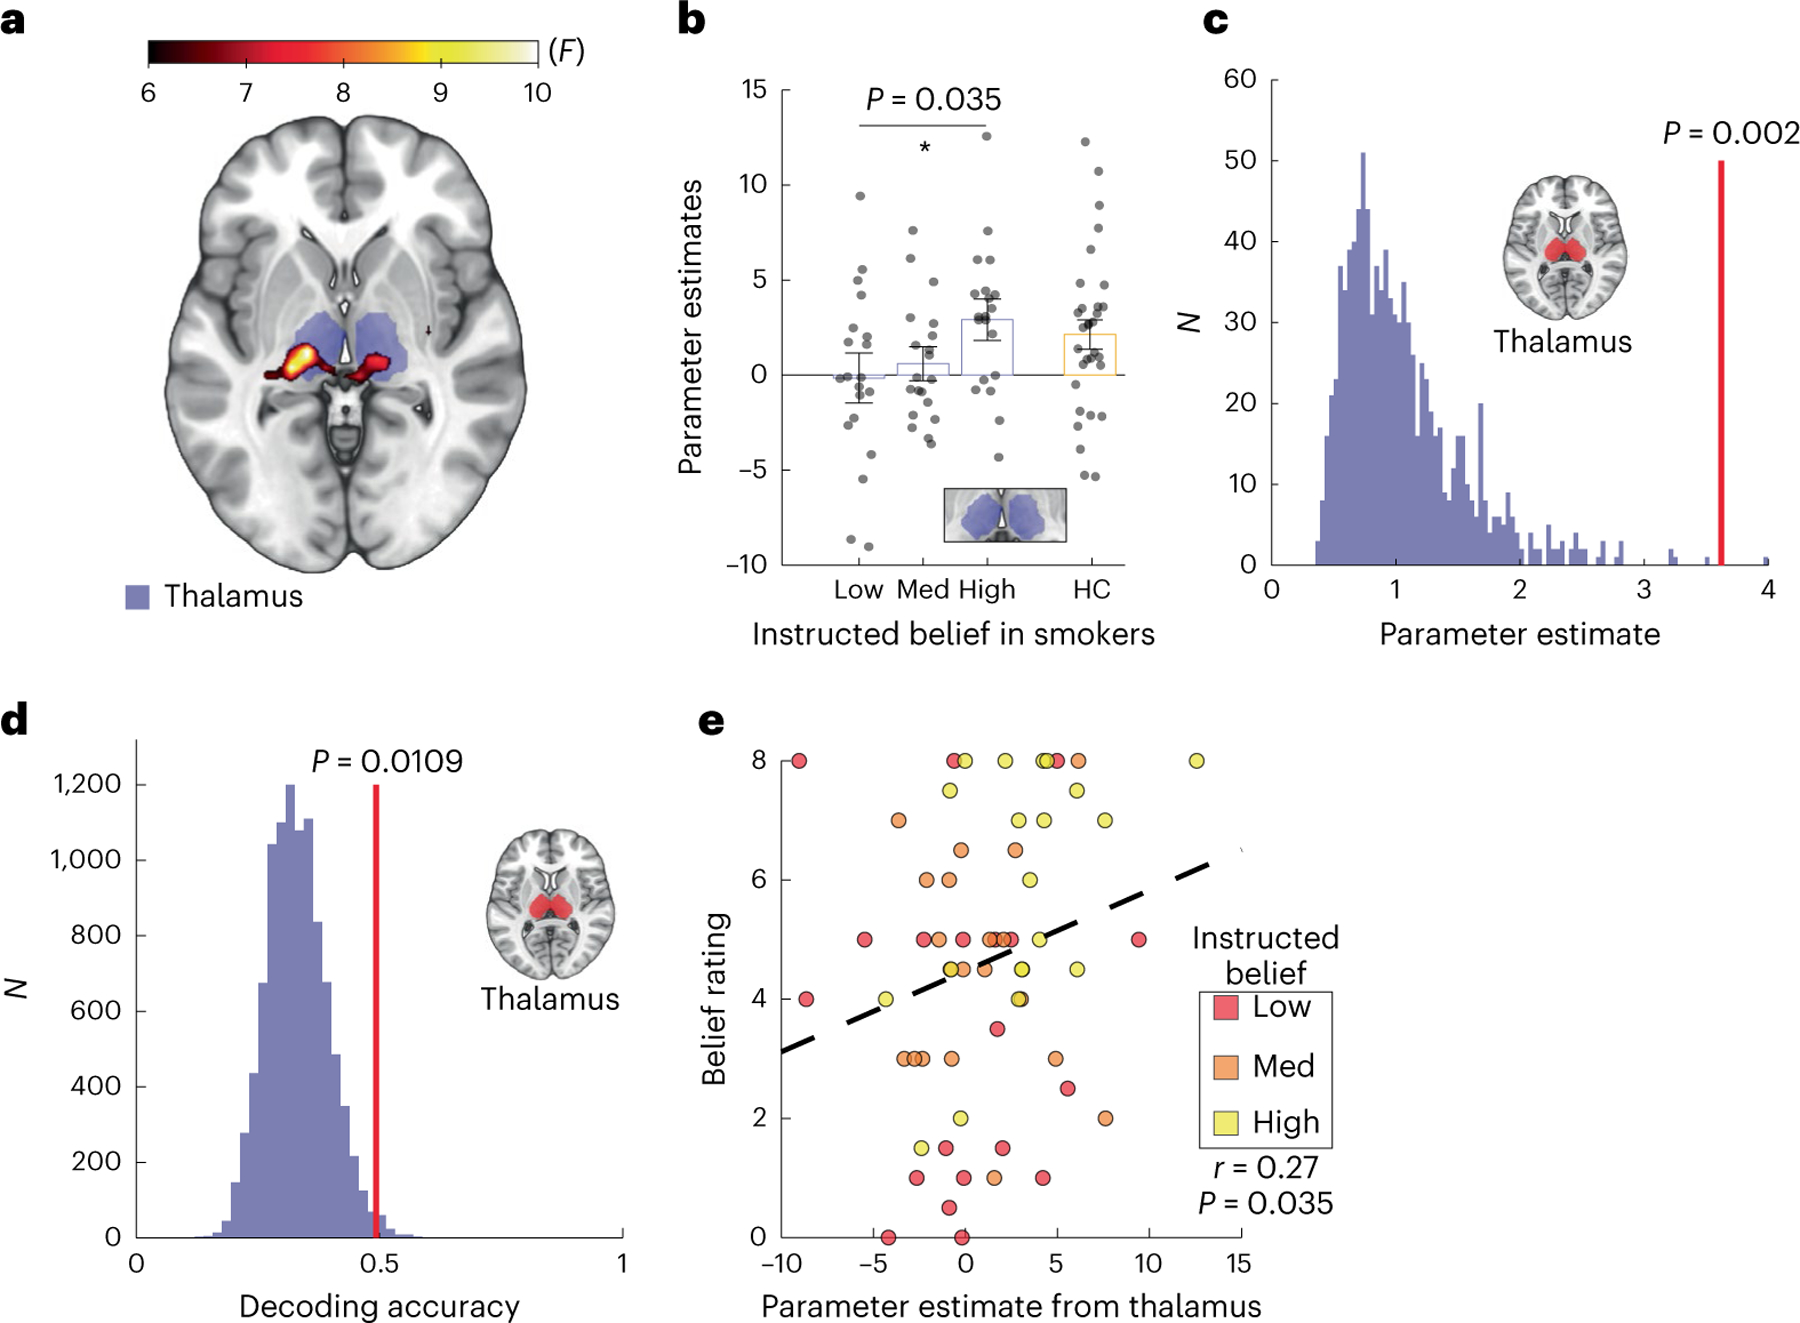
a, Whole-brain effects of instructed beliefs about nicotine on value-tracking signals (rmANOVA, cluster-level PFWE = 0.006, k = 50, group F map). b, Parameter estimates representing reward-related activities extracted from an independent thalamus mask (purple boxes) across belief conditions in smokers (N = 20 participants, rmANOVA P = 0.036) compared with non-smoking healthy controls (HCs) (orange box, n = 31 participants). The vertical bars depict group means, and the points represent participants. The inset shows the anatomical mask of the thalamus used for signal extraction. The error bars show the s.e.m. *P < 0.05. c, A permutation test for instructed beliefs effects (N = 1,000, P = 0.002, one-sided). A histogram of surrogate distribution shows beta estimates (purple bars). The vertical red line denotes the mean of true beta values. d, The decoding accuracy of the belief condition from thalamic neural patterns. The vertical red line denotes the decoding accuracy for ground truth data. The purple histogram is a surrogate distribution composed of decoding accuracy for the same neural data with shuffled labels. The P value is derived nonparametrically through a one-sided permutation test (n = 10,000). e, The correlation between thalamic signals and subjective belief rating regarding perceived nicotine strength (Spearman’s correlation, r = 0.27, P = 0.035). The black dashed line is the linear fit.
A region of interest (ROI) analysis using an independent anatomical mask48 further confirmed that blood-oxygen-level-dependent (BOLD) signals from the thalamus differentiated between instructed belief conditions (mean ± s.d (AU): 0.157 ± 1.047 for ‘low’, 0.601 ± 0.714 for ‘medium’ and 2.914 ± 0.865 for ‘high’; rmANOVA test F(2, 38) = 3.62, P = 0.036, partial η2 = 0.16, 90% CI = 0.0057 ≤ η ≤ 0.30, Fig. 2b). We also applied a nonparametric approach to further confirm the relationship we observed between beliefs and neural activities. Using a permutation analysis approach, we iteratively extracted beta estimates from surrogate general linear modeling (GLM) based on shuffled belief conditions (N = 2,000). We observed that beta estimates for the actual allocation of belief conditions ranked significantly higher than the surrogate distribution (P = 0.002; Fig. 2c). A finer parcellation of the thalamus49 revealed that ventral posterior nuclei, notably the centromedian and lateral geniculate nuclei, were the primary nuclei in which reward-tracking neural activity differentiated between instructed beliefs in a parametric manner (false detection rate (FDR) corrected at q = 0.05; P values <0.05; Supplementary Fig. 3).
Next, we asked whether thalamic activities were actually predictive of the belief condition. We trained a regularized linear discriminant analysis (rLDA) model to decode instructed belief conditions from multivoxel spatial patterns extracted from the thalamus50,51. We were able to decode the instructed belief condition from distributed multivoxel patterns of thalamic activity at 49.3% accuracy. This decoding accuracy was significantly greater than the chance level (33.3%), as confirmed by a permutation test where we iterated the procedure with shuffled labels (N = 10,000) and compared the true decoding accuracy to the surrogate accuracy distribution (surrogate: 33.1% ± 6.3%, P = 0.011; Fig. 2d). We further applied this decoding approach to each nucleus within the thalamus, using the same anatomical parcellation as before, and observed greater decoding accuracy in the ventral posterior nuclei. Only the ventral posterolateral nucleus showed decoding accuracy significantly higher than chance (FDR corrected at q = 0.05, P = 0.018; Supplementary Fig. 4).
Given the known18,19 and observed variability in individuals’ susceptibility to instructions (Fig. 1b), we also examined the relationship between thalamic responses and self-reported beliefs about nicotine strength. We found that, across all sessions/participants, subjective ratings of perceived nicotine strength correlated with reward-related activities in the thalamus (Spearman correlation, r = 0.27, P = 0.035; Fig. 2e). This result confirmed that subjective beliefs, which were shaped by instructions about nicotine dosage in this study, also induced dose responses in the thalamus. Taken together, these results pinpoint the thalamus, particularly the posterior thalamus, as a key neural substrate representing nicotine-related beliefs.
Belief did not modulate reward-related striatal activity
The ventral striatum (including the nucleus accumbens, NAcc), is another brain region known to be affected by nicotine addiction and encodes reward24,31. Consistent with previous findings, we found that the ventral striatum tracked the value signal across all conditions (PFDR q < 0.01, Fig. 3a). However, striatal responses did not differ between belief conditions at the whole-brain level in an ANOVA (P > 0.05; Supplementary Fig. 5a).
Fig. 3 |. Belief about nicotine strength did not modulate striatal reward-related responses.
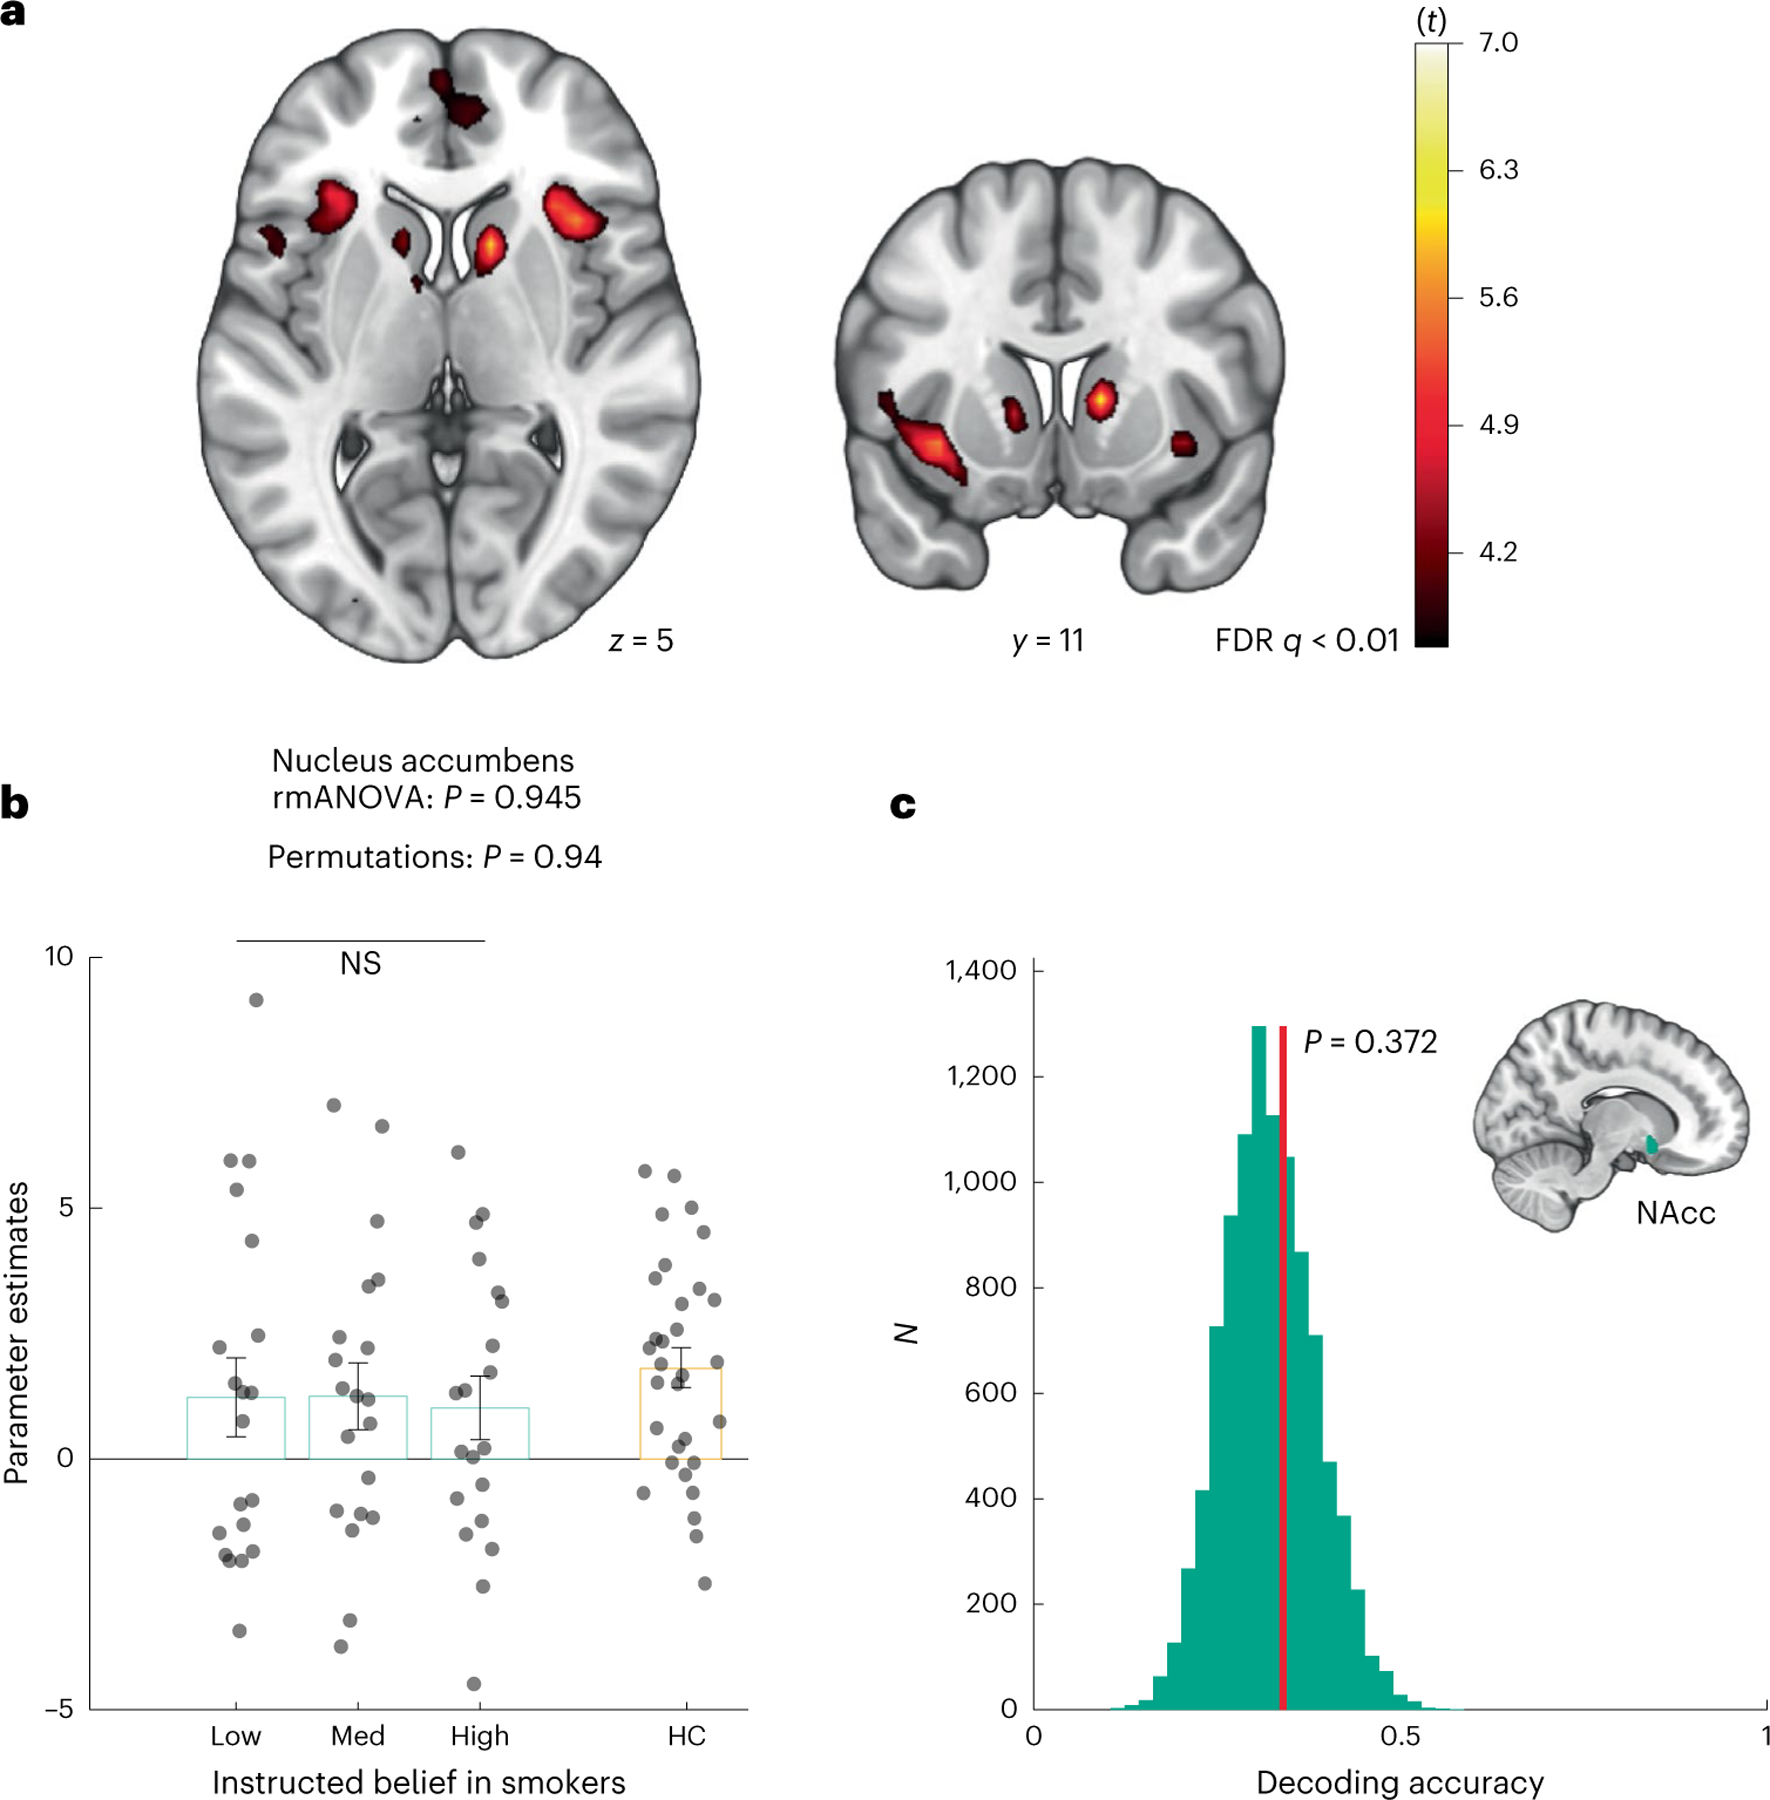
a, Diagrams of whole-brain effects of cross-condition brain activation tracking market return across all instructed belief conditions. Group F map, where the heatmap signifies t values. b, Parameter estimates representing reward-related activities extracted from an independent NAcc mask across belief conditions in smokers (teal boxes) (rmANOVA P = 0.945; permutations P = 0.94) compared with nonsmoking HCs (orange box). The vertical bars depict group means, and the points represent participants. The error bars show the s.e.m. c, The decoding accuracy of belief conditions from accumbens neural patterns. The vertical red line denotes the decoding accuracy for ground truth data. The teal histogram is a surrogate distribution of the decoding accuracy for the same neural data with shuffled labels. The P value is derived nonparametrically through a one-sided permutation test (P = 0.372, N = 10,000).
An ROI analysis using an independent mask of the NAcc further confirmed that neural activities in the NAcc did not differentiate between belief conditions (rmANOVA F(2, 38) = 0.056, P = 0.945; permutation test: P = 0.94; Fig. 3b). In line with the GLM results, classification accuracy for belief conditions using patterns extracted from the NAcc was not significantly higher than chance (34.0% for ground truth; surrogate: 32.1% ± 6.3%, P = 0.372; Fig. 3c). Finally, we examined reward-related activations in other basal ganglia nuclei, namely the putamen and the caudate nucleus. We did not find significant differences between belief conditions either in separate ROI analyses (putamen rmANOVA F(2, 38) = 1.15, P = 0.327; caudate rmANOVA F(2, 38) = 0.24, P = 0.781; Supplementary Fig. 5b,c). We will discuss this lack of effect in more detail below.
Belief modulated prefrontal–thalamus functional connectivity
Next, we carried out a psychophysiological interaction (PPI, Methods) analysis52 with the thalamus as a seed region to investigate how beliefs about nicotine were represented at a neural circuitry level. We found that belief about nicotine indeed modulated functional connectivity between the thalamus and the vmPFC both at the whole-brain level (PSVC < 0.05, FWE cluster corrected at a cluster-defining threshold of P < 0.005, P = 0.041 for uncorrected; Fig. 4a) and via an ROI analysis using a vmPFC mask from an independent study involving belief formation53 (peak at MNI x = −11, y = 50, z = −6, k = 5; Fig. 4b and Supplementary Fig. 7a). In sharp contrast, a separate set of PPI analyses using the ventral striatum as a seed region did not yield any significant changes in functional connectivity with the vmPFC orany other brain region at the same threshold (Supplementary Fig. 7b). This finding is consistent with the known roles of vmPFC in belief updating54 and representation of task states55. Finally, we observed that smokers’ deprivation, expressed as craving ratings, did not correlate with the key neural measures described in this study (Supplementary Fig. 9). Collectively, this result suggests that nicotine-related beliefs notonly modulated thalamic activation but also modulated prefrontal–thalamus connectivity in a dose-dependent fashion.
Fig. 4 |. Belief about nicotine strength modulated thalamus–vmPFC functional connectivity in a dose-dependent fashion.
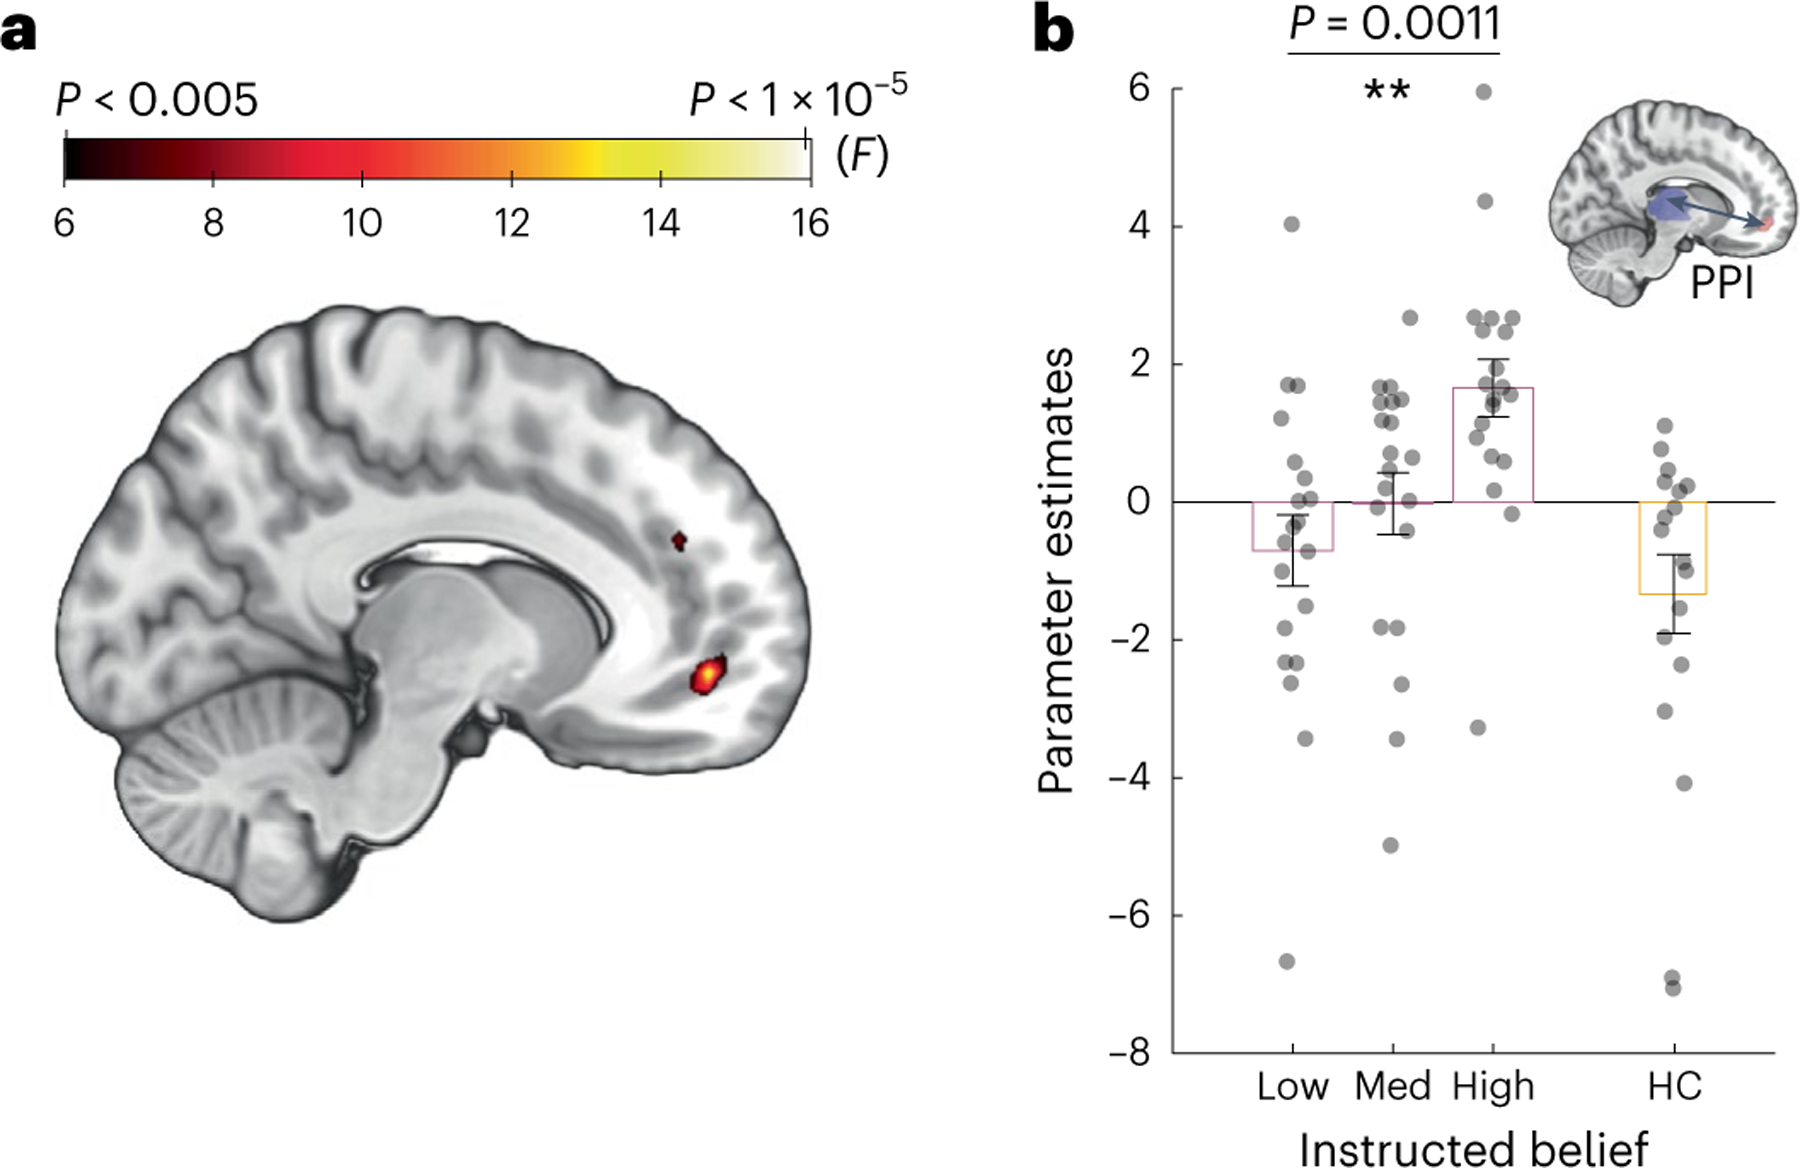
a, The effects of instructed beliefs on the PPI (group F map) between the thalamus and the vmPFC. b, Parameter estimates extracted from a, representing the functional coupling strength between the thalamus and vmPFC (rmANOVA P = 0.0011, n = 20 participants) compared with nonsmoking HCs (orange box, n = 18 participants). The vertical bars depict group means, and the points represent participants. The error bars show the s.e.m. **P < 0.05.
Discussion
While humans hold beliefs about a wide range of stimuli and events, beliefs about substances are particularly important to examine due to their high relevance regarding substance use disorders. Here, we demonstrate that instructions about nicotine dosage (‘low’, ‘medium’ or ‘high’) modulated how human smokers perceived the strength of nicotine in an e-cigarette they vaped. We also found that nicotine dosage-related beliefs parametrically modulated thalamic activation and thalamus–vmPFC functional connectivity. Taken together, these findings demonstrate a mapping mechanism between nicotine-related beliefs and neural activities in a prefrontal–thalamic circuit.
The thalamus—particularly the posterior portion—contains one of the highest densities of nAChRs in the human brain36 as quantified by both autoradiography34,56,57 and imaging58,59. The nucleus most enriched with nAChRs includes the centromedian nucleus and is densely connected with the prefrontal cortex39. This anatomical feature is hypothesized to account for the attention-enhancing effect of nicotine58,60, as the thalamus is known to be central for gating incoming sensory information28. It has been shown that nicotine itself can induce dose responses in the human thalamus59. Importantly, even when nicotine level is low, smoking cigarettes can still induce a substantial level of occupancy of nAChRs—with the most profound effects in the thalamus—in human smokers29,32,33. This finding is consistent with our results in suggesting that thalamic activity can be modulated by not only nicotine per se but also a wide range of cognitive factors, such as beliefs about nicotine. Importantly, our study reveals a more granular mechanism of how cognitive factors can parametrically change neural substrates involved in nicotine addiction, mimicking the dose-dependent effects of nicotine itself.
We also found that vmPFC–thalamus functional coupling during decision-making also distinguished between belief conditions. The vmPFC has been proposed to encode a ‘common currency’ of subjective value61. In serving this role, the vmPFC has been shown to receive input from both the ventral tegmental area (VTA) and the basal ganglia via the thalamus26. Importantly, rich computational neuroscience literature provides a more updated view of vmPFC by suggesting that the vmPFC encodes task structures and statistical regularities of one’s environment that are not directly observable42. Under this framework, different belief ‘doses’ in the current study could be interpreted as different states, which are dynamically tracked by the vmPFC–thalamus circuit. Consistent with this view and our current finding, previous work has also shown that the functional connectivity between vmPFC and thalamus encodes other types of beliefs, such as expectation about incoming sensory (that is, visual) stimuli62. Our finding expands previous work by demonstrating that, instead of functioning as a binary ‘switch’, the vmPFC–thalamus circuit encodes information related to beliefs and expectations in a parametric manner, highlighting the importance and precision of this circuitry in representing abstract mental states.
In contrast, the ventral striatum tracked reward value overall, without distinguishing between belief conditions. This result differs from a previous study where binary beliefs about nicotine (‘yes’/’no’ nicotine) modulated activities in the striatum in smokers using a similar decision-making task18. Seemingly surprising at first, the lack of belief effects on the striatum was consistent with the lack of belief effect of instructed beliefs on reinforcement learning behavior in smokers in this study (Supplementary Information). We speculate that this discrepancy is mainly due to differences in study design between studies. Specifically, the current study design uses e-cigarettes to deliver nicotine to smokers who were not experienced with vaping, as opposed to the use of traditional cigarettes that smokers were highly experienced with in previous work18,19. This design choice removed conditioned responses related to smoking behavior in the smokers in the current study, as substance-dependent humans are known to be sensitive to subtleties in sensory properties of the medium through which a drug is delivered63,64. Thus, the identified mapping between nicotine dosage-related beliefs and neurobiology of the thalamus is less dependent on a conditioned effect compared with previous work18,19.
Aside from the striatum, several other brain regions, including the VTA, amygdala, insula and hippocampus, have been previously associated with addiction65–67 but did not show a belief-dependent response in our study for several reasons. First, studies reporting the involvement of these regions primarily used cue-elicited craving paradigms, activating brain regions related to craving instead of value-based decision-making65–67. Interestingly, among these regions, only prefrontal areas (including anterior insula but not the VTA, amygdala or hippocampus) have been shown to be modulated by nicotine beliefs and expectancy19,68,69, which is consistent with our finding regarding the vmPFC. Second, the average amount of nicotine consumed by smokers in the current study was less than 1 mg, which is much lower than the nicotine dosage of a typical cigarette (ranging from 10–15 mg)70. A low nicotine dosage would require a brain region to have a very high density of nAChRs (as is the case for the thalamus compared with the VTA, amygdala, insula or hippocampus) to enable nicotine binding, which subsequently generate sufficient levels of BOLD activities for belief to act upon.
The current findings have considerable relevance to the placebo literature, as the effects of beliefs and expectations are central to placebo research14,15. For instance, Nakamura et al. examined dose-dependent effects of beliefs in analgesia and found reduction in relief as a function of drug expectations71. Another study on placebo analgesia tested two levels of placebo ‘strength’ and reported differential activation in the anterior cingulate cortex72. Yet, results of the current study should not be interpreted through the lens of placebo alone, as fundamentally, our experiment was designed to examine how beliefs can modulate drug-induced neural responses in the presence of a substance such as nicotine. This directly informs addiction research by contributing to our understanding of how drug-related beliefs impact neural responses in the presence of a substance like nicotine, which might eventually lead to new avenues of cognitive interventions for substance use disorders (SUDs).
The current study has several limitations. First, we did not systematically manipulate smokers’ baseline craving; future research could explore how deprivation might affect beliefs’ effect on the brain. Second, humans can form many types of beliefs beyond those about drug dosage; for instance, it would be important to examine how beliefs about liking or disliking of a substance might affect neural responses. Furthermore, future research should examine whether belief-induced dose responses also exist in other task contexts, such as cue- paradigms, using e-cigarettes73. Finally, only one nicotine level was used in the current study; future work will need to examine how different nicotine strengths might interact with different belief levels. Nevertheless, our study provides insight into how a thalamic circuitry represents nicotine-related belief ‘dosage’ in a manner that resembles pharmacological dose-dependent effects. Elucidating the precise mapping mechanism between beliefs and brain states is important for understanding the key roles cognitive constructs play in human addiction. Beyond addiction, this work also has implications for pharmacological research in general, as individual differences in drug-related beliefs could account for the huge variability in drug responses observed in humans74,75, alongside other factors such as body weight, receptor availability or metabolism. As such, these findings uncover new avenues for systematically leveraging the impact of narratives on the brain in mental health research and treatment.
Methods
Participants
The study was approved by the Institutional Review Board of the University of Texas at Dallas and the University of the Texas Southwestern Medical Center, where data collection was conducted (ethical approval codes: UT Dallas 15–77 and UT Southwestern STU 072015–031). All participants signed informed consent before participating in the study. Across all visits, participants were compensated at a rate of $20 per hour.
Smokers.
Using a similar fMRI learning task and factorial design, a previous study of belief–drug interaction in nicotine addiction (N = 24 per condition) yielded an effect size of Cohen’s d = 0.69 for reward learning. Based on this, we estimated an n = 20 in each belief condition in the final sample would provide 90% power to detect an effect of this magnitude at alpha of 0.05 (two-tailed). Further, sample size calculation with G*Power V3.1.9.7, assuming a three-measurement repeated-measures ANOVA F-test with an effect size of 0.4, alpha of 0.05 and power of 0.95, suggested a minimally required sample size of 18 participants.
Based on this power calculation, we recruited nicotine-dependent adult participants from the Dallas–Fort Worth metropolitan area (total n = 23 and final n = 20). Inclusion criteria included any sex, race or ethnicity (race and ethnicity data were based on participants’ selection from a predefined list of categories as defined in the US Census survey), an age of 18 years and older, normal or adjusted to normal vision and smoking daily for at least 1 year but with no prior experience with vaping devices or current attempt to quit smoking. We recruited smokers who were naïve to vaping to remove the effect of prior expectations associated their lifelong experiences; instead, we aimed on focus on belief effects introduced by the experimental manipulation of ‘told yes/no nicotine’, a design feature distinct from our previous work18,19 and most other research on nicotine expectancy22,23. Exclusion criteria included the use of illicit drugs in the past 2 months, a history of traumatic brain injury, any current substance abuse (excluding nicotine and alcohol), any contraindication to MRI, or previous or current psychiatric, neurological or major medical conditions. A total of 23 participants enrolled in this study and underwent three fMRI sessions, spaced about 1 week apart. Three participants were excluded from analysis for the following reasons: one participant was excluded due to software malfunction, one due to falling asleep in the scanner and one due to loss of behavioral data for one of the scanning sessions. The final sample therefore comprised 20 participants (6 females, aged 41.1 ± 11.97 years; age range 24–61 years). See Table 1 for demographic and smoking-related characteristics of both included and excluded smokers. Refer to Fig. 1b for a Strengthening the Reporting of Observational Studies in Epidemiology (STROBE) flow chart of the recruitment and analysis pipeline.
Nonsmoking HCs.
We also recruited a group of nonsmoking HCs who performed the same task in the same imaging facility to establish normative values of the neural activations in the key ROIs. A total of 33 healthy volunteers (15 females, aged 28 ± 9 years) were recruited for the study using similar criteria as smokers, other than nicotine addiction being an additional exclusion criterion (see Supplementary Table 2 for demographic data of the HC cohort). Two participants were excluded from neural analyses due to excessive head movement (>3 mm), leaving a final sample size of 31. For the PPI analysis, several participants had to be excluded due to poor signal coverage of the vmPFC ROI in question, thus retaining data from 18 participants for that analysis.
Experimental design
Upon arrival at the laboratory, participants completed demographic, mental health (Positive and Negative Affect Schedule, Beck’s Depression Inventory, Empathy Quotient, Toronto Alexithymia Scale, Behavioral Inhibition System and Domain-Specific Risk-Taking questionnaires), general substance and alcohol use (Drug Abuse Screening Test and Short Michigan Alcohol Screening Test) and nicotine-specific surveys (Fagerström Test for Nicotine Dependence, Wisconsin Withdrawal Scale and Shiffman–Jarvik Withdrawal scale). Participants provided saliva samples for measuring cotinine, the primary metabolite of nicotine. Saliva samples were collected using a passive drool method until a volume of 1.8–2 ml was obtained. They were then coded and stored in designated freezers until being sent for analysis. Participants’ exhaled carbon monoxide (CO) levels served as a proxy for their satiety status. These were acquired by a Smokerlyzer (coVita micro+basic) prior to e-cigarette vaping in each session. The measurement took place in a designated behavioral testing room adjacent to the scanners. Participants continuously exhaled through a designated straw until a measurement appeared on screen. Following the fMRI scans, participants repeated the state-based series of surveys and provided a second saliva sample.
For nicotine delivery, we used the ‘blu’ e-cigarette atomizer with disposable 1.2% nicotine cartridges in the ‘classic tobacco’ flavor, which was considered a moderate level among the available options of nicotine strength. We chose to use e-cigarettes to deliver nicotine because (1) the nicotine strength can be controlled much more precisely compared with traditional cigarettes and (2) this removes the impact of smokers’ prior expectations about nicotine delivered by e-cigarettes before coming to the laboratory and enhances the belief effects introduced by our experimental manipulation. We chose a low-to-moderate level of nicotine similar to previous research on nicotine beliefs (for example, 0.6 mg used in refs. 18,19) to make the belief manipulation more successful; that is, we wanted to avoid situations where experienced nicotine users might feel any strong psychomotor effects induced by very high levels of nicotine and thus disregard the instructed beliefs.
Before vaping, the e-cigarette cartridge was weighed three times on a high precision scale and the average of the three measurements was logged as the baseline weight of the cartridge. A similar procedure was done post-vaping, and the change in cartridge weight represented the amount of nicotine liquid consumed by the participant. Using a double-blind procedure, neither participants nor the research assistants (M.H. and A.K.) responsible for data collection had prior knowledge about the true nicotine content in the e-cigarettes. The order of belief conditions was randomly assigned for each participant. The e-cigarette cartridges were carefully relabeled as ‘low’, ‘medium’ or ‘high’ by the principal investigator (X.G.) to avoid unblinding by either the participant or the research assistants.
Notably, the same type of cartridges containing 1.2% nicotine was used across all participants and sessions. Research assistants (M.H. and A.K.) who interacted with the participants adhered to a fixed text during the manipulation, stating, “The cartridge you will use today will contain: [a low amount of nicotine] / [a medium amount of nicotine] / [a high amount of nicotine].” These experimenters also made sure that participants used the e-cigarette properly, the device was well powered, and that vapor was visible. Participants were told they could vape as much as they wish for the next 20 minutes and were left alone to vape. After 20 minutes, they were questioned about any issues with the e-cigarette. Participants were then prompted to reply how they would rate the strength of the nicotine in the e-cigarette on a scale of 0 to 10 compared with a normal cigarette. The specific vaping instructions we gave to smokers, together with their lack of experience with vaping, could have contributed to the fact that smokers consumed roughly equal amounts of nicotine despite previous evidence that lower nicotine content in a traditional cigarette could lead to compensation effects and more puffs/nicotine consumed by smokers9.
Three participants’ data were removed from cotinine analysis: two due to cotinine readings exceeding three standard deviations from the mean of the cohort and one due to missing data. Data for all three sessions (instructed beliefs conditions) were discarded from this analysis. Three participants’ data (nonoverlapping with the previous omission) were removed from CO analysis: two due to readings exceeding three s.d. from the mean of the cohort and one owing to missing data. Once again, data for all three sessions (instructed beliefs conditions) were discarded from this analysis.
Cotinine detection in saliva
Chemicals and reagents.
Optima liquid chromatography–mass spectrometry grade acetonitrile, water and methanol were purchased from Fisher Scientific. Reagent grade ammonium formate was purchased from Sigma–Aldrich. Cotinine was purchased from Sigma–Aldrich. Rac-cotinine-d3 was obtained from Toronto Research Chemicals. All other chemicals and reagents were of analytical grade and used without further purification. Blank human saliva was procured from the principal investigator.
Preparation of stock and working solutions of analyte and internal standard.
Primary stock solutions of cotinine for the calibration curve (CC) and quality control (QC) samples were prepared from a 1 mg ml−1 stock solution in methanol. Stock solutions of cotinine were stored at −20 °C, and subsequent dilutions were conducted using water. Primary stock solutions of the bioanalytical method’s internal standard (IS) d3-cotinine were prepared by accurately weighing d3-cotinine and dissolving in methanol to yield a 1 mg ml−1 stock solution. Stock solutions of d3-cotinine were stored at −20 °C, and subsequent dilutions were conducted using water. For spiking of saliva samples with cotinine, a working stock solution of 1,000 ng ml−1 cotinine in water was prepared and stored at −20 °C. For spiking of saliva samples with d3-cotinine, a working stock solution of 300 ng ml−1 d3-cotinine in water was prepared and stored at −20 °C.
Preparation of the CC and QC samples for analysis of saliva samples.
Cotinine was validated over a calibration range that supports low concentration and high concentration samples. The CC ranged from 5 ng ml−1 to 1,000 ng ml−1. CC samples were prepared by spiking 1 μl of the working stock (1 mg ml−1 cotinine in water) into 250 μ of saliva. This represented the top CC point (that is, the upper limit of quantification). The remaining CC samples were prepared by serial dilution of the upper limit of quantification standard in saliva. The QC was prepared in a similar fashion by spiking 80 μl of the working stock (1,000 ng ml−1 cotinine in water) into 250 μl of plasma. This represented the high-QC standard. The medium-QC standard and low-QC standard were prepared by serial dilution of the high-QC standard in saliva. The spiking volume of the working standard did not exceed 5% of the matrix volume. The QCs for the CC were prepared at 5, 30 and 80 ng ml−1.
Saliva collection.
Patients provided a saliva sample collected at various time points throughout a session. Samples were collected using a passive drool method (that is, Salimetrics ‘SalivaBio’ collection aid). Saliva samples were analyzed for cotinine concentrations using a validated high-performance liquid chromatography tandem mass spectrometry method.
Saliva sample preparation.
Acetonitrile (350 μl) and 100 μl (300 ng ml−1) d3-cotinine was added to a 250 μl aliquot of saliva. The resultant mixture was centrifuged for 5 min at 2.4g at a temperature of 4 °C. After centrifugation, 500 μl of the clear supernatant was removed, placed in a new Eppendorf tube and dried using a SpeedVac. Samples were reconstituted using 250 μl of water.
High-performance liquid chromatography operating conditions.
A Shimadzu CBM-20A Nexera X2 series liquid chromatography system (Shimadzu Corporation, Kyoto, Japan) was equipped with a degasser (DGU-20A) and a binary pump (LC-30AD), along with an autosampler (SIL-30AC) and a column oven (CTO-30A). The autosampler was maintained at 15 °C. An injection volume of 1 μl was used, and chromatographic separation was achieved using a Kinetex Biphenyl (2.6 μm, 50 × 2.1 mm) column. The mobile phase used for the method consisted of 2 mM ammonium formate in water (pump A) and methanol:water (95:5) with 0.2% formic acid (pump B). The mobile phase pumped using a gradient program at a flow rate of 0.8 ml min−1 into the mass spectrometer electrospray ionization chamber in positive polarity. The gradient program initiated with 5% of B and maintained for 1.0 min then ramped to 75% of B by 2.5 min and maintained at 75% of B until 3.5 min, changed back to 5% of B by 4.0 min and maintained until 6.01 min at the end system controller stop command.
Mass spectrometry operating conditions.
Quantitation was achieved by employing electrospray ionization in positive ion mode for the analytes using a SCIEX QTRAP 6500+ mass spectrometer equipped with the Turbo V source operated at 550 °C. The nebulizer gas, auxiliary gas, curtain gas and CAD gas were set at 45, 45 and 30 psi and ‘medium’, respectively. The declustering potential, collision energy, entrance potential and collision cell exit potential were 141, 31, 10 and 10 V for cotinine-1; 141, 47, 10 and 8 V for cotinine-2; 141, 31, 10 and 12 V for d3-cotinine-1; and 141, 29, 10 and 8 V for d3-cotinine-3, respectively. Detection of the ions was carried out in the multiple-reaction monitoring mode (MRM), by monitoring the precursor > product transitions of 177.0 > 80 and 177.0 > 98.0 (sum over 2 MRMs) for cotinine and 181.2 > 80.1 and 181.2 > 101.1 (sum over 2 MRMs) for d3-cotinine. The data obtained were processed by Analyst software (version 1.6.3).
Method validation.
The methods for analysis of cotinine in saliva were validated according to the US Food and Drug Administration’s May 2018 Guidance for Industry on ‘Bioanalytical Method Validation’. The method was found to have acceptable sensitivity, selectivity, matrix effect, linearity, accuracy, precision, recovery, dilution integrity and stability.
Value-based decision-making task
This task was developed based on a previous investment task18,46 but with the modification that participants were allowed to place both positive (‘invest’) and negative (‘short’) bets. Briefly, participants were allocated an initial sum of 100 monetary units (that is, their portfolio) at the beginning of the experiment, which could be invested in stock markets. Participants were informed that their final payment would be scaled according to their actual gains or losses in the task. Each participant played a total of ten markets per visit, each consisting of 20 trials. The stock market prices in the task were chosen from true historical stock market prices. Each task block commenced by a caption titled ‘new market’ followed by a graphic display of past market dynamics. The task was presented in the scanner using Psychtoolbox 2 running under MATLAB.
In each trial , the participant observes the price history of a stock market (including the trial before, ) and places a bet, . Next, a new market price is revealed, and portfolio amounts are updated to reflect the recent outcome. The fractional market return is defined as . In each of the 20 trials, participants had unconstrained time to decide on their investment moves. Participants were able to choose to either invest normally (if they think the price will go up) or short sell (if they think the price will go down). Notably, shorting the market would result in gaining from market drops. Thus, people could benefit from either a positive or negative price change and the absolute value of market return represents the magnitude of the potential gain. Participants provided their choice using a slider bar and finalized their choice by a button press. Following a 750 ms delay, the new market price was revealed and the fractional change in market price was applied to the portfolio. In later analyses, this event is termed ‘market reveal’. Each trial concluded in a 750 ms intertrial interval in which the slider turned gray and became unresponsive. A total of 30 different markets were used across all three visits. Mean session duration in the stock market task was 14.91 ± 3.06 min and did not differ across conditions (rmANOVA F(2, 59) = 0.28; P = 0.76).
Imaging acquisition and preprocessing
Whole-brain anatomical and functional MRI data were acquired on a Philips Achieva scanner with a 3 T field strength. High-resolution T1-weighted scans (1.0 × 1.0 × 1.0 mm3) were acquired using a three-dimensional magnetization-prepared rapid gradient-echo sequence. Functional images were acquired using echo-planar imaging and tilted 30° from the anterior commissure–posterior commissure axis. The detailed settings for the functional imaging included: a repetition time of 2,000 ms, an echo time of 25 ms, a flip angle of 90° and a voxel size of 3.4 × 3.4 × 4.0 mm3, with 38 slices. The average number of functional images acquired was 457.37 ± 91.67. All imaging data were preprocessed using standard statistical parametric mapping76. Functional images were applied with a slice time correction.
To account for large head movements often caused by participants’ coughing during the scan, we used the ArtRepair toolbox77 to examine and repair volumes with large motion artifacts. We used the art_motionregress and art_global modules of the single subject-level analysis pipeline. The ArtRepair algorithm was further used to generate the motion parameters to be included in the general linear model (GLM) design matrix. Volumes were examined for fast head movements using the automated defaults such that volumes with movement of >0.5 mm per repetition time were tagged and interpolated with the nearest usable volumes. Overall, 6 out of 60 scans were repaired. The mean functional images for each subject were coregistered to the subject’s high-resolution T1 structural scan, using a 12-parameter affine transformation. The participant’s T1 image was segmented into gray and white matter and then normalized using nonlinear basis functions to the MNI space with the functional images normalized to the template and resampled into 3.4 × 3.4 × 4 mm3 functional voxels. Functional images were smoothed spatially using a 6 mm full-width at half-maximum Gaussian kernel. A temporal high-pass filter of 128 Hz was applied to the fMRI data, and temporal autocorrelation was modeled using a first-order autoregressive function.
Statistical analysis
Throughout this study, we used a within-participant rmANOVA implemented in MATLAB (anova_rm) to assess differences between the three conditions of instructed belief. Normality was assessed with Shapiro–Wilk tests wherever appropriate. During analysis of the various controls, if data for one of the sessions were missing, that participant was excluded from this specific analysis. For neural activity and connectivity measures, we specified the statistical thresholds and rationale in the fMRI methods sections below. In the case of between-group comparison between smokers and HCs, we used two-sample t-tests, conducted separately for each level of instructed belief.
Behavioral modeling
We examined the impact of the value signal of market return on participants choice behavior, operationalized as their next bet, , using a linear mixed-effects multiple-regression model. The final return of each market was excluded from the regression, as there was no investment decision following the final market segment. Similarly, the first trial was also removed since it had no preceding investment decision. In line with previous investigations18, our parameter of interest was instructed belief, expressed as a three-level interaction (the first level, that is, ‘low’ belief, served as baseline) modulating market return, (ref. 18).
To test whether there was an interacting or a moderating effect of belief on the relationship between market return and next bet, we first tested two plausible models, with and without an interaction of and instructed belief. The results suggested that the interaction effect did not improve model fit. We therefore modeled choice behavior as follows:
Multiple regression was carried out in R (RStudio 1.1.463, 2018) using the ‘lmer’ function as follows in the ‘lme4’ package. values were approximated via Satterthwaite’s degrees of freedom method. The inclusion of instructed belief as a random effect was guided by the notion that the effects of belief are likely heterogeneous across the cohort. This intuition was backed up by model comparison between the two options (with / without belief as a random effect) using the ‘anova’ function (P < 2.2 × 10⁻¹⁶).
GLM of fMRI data
Event-related analyses of the fMRI data were conducted using SPM12 (Wellcome Department of Imaging Neuroscience; www.fil.ion.ucl.ac.uk/spm). We conducted GLM of the functional scans of each participant by modeling the observed BOLD signals and regressors to identify the relationship between the task events and the hemodynamic response. Regressors related to all visual and motor events were created by convolving a train of delta functions representing the sequence of individual events with the default basis function in SPM12, which consists of a synthetic hemodynamic response function composed of two gamma functions. The GLM included six separate regressors: (1) new market screen display, (2) market history display, (3) all key presses, (4) market price reveal of trial 1, (5) market price reveal of trials 2–19 and (6) market price reveal of trial 20. Additionally, six parameters generated during motion correction were entered as covariates. In the GLM, the absolute market return was entered as a parametric modulator of ‘market reveal’ of trials 2–19. We carried out linear contrasts of the parameter estimates to identify the effects in each participant.
Statistical maps from all participants were then entered into a second-level group analysis to implement a random-effects statistical model. A within-subject rmANOVA model was conducted for the factor of instructed beliefs (‘low’, ‘medium’ or ‘high’). Statistical inference was made based on the F statistics derived from whole-brain rmANOVA statistical maps. Significant effects were identified at P < 0.05, FWE cluster corrected at a cluster-defining threshold of P < 0.005, uncorrected with a cluster size threshold of k = 50. We relied on cluster-extend thresholding in our statistical inference to allow sufficient sensitivity to detect effects given the experimental sample size78 while implementing thresholds recommended for a balance between type I and type II errors79. Maps were rendered using MRIcroGL v1.2.2.
Thalamic parcellation and ROI analyses
We extracted parameter estimates from bilateral thalamus using an anatomical mask (WFU_PickAtlas)48. Thalamic parcellations were obtained from the Lead-DBS (v2.0) MATLAB toolbox. Each segmented nucleus or region was transformed into the experimental dataset’s functional space using the MarsBaR toolbox (v0.45). The Thalamus Optimized Multi-atlas Segmentation atlas49 contains 12 nonoverlapping nuclei, three of which (vLA, MGN and MTT) were too small to be meaningfully transformed to our functional space and were therefore not used. As before, we modeled BOLD activity tracking of fluctuations in magnitude of market return, , and carried out a group analysis with a within-subject rmANOVA design per region of the thalamic parcellation. To account for multiple comparisons, we applied the FDR correction to the extracted ROIs at q = 0.05.
Permutation analysis
We iteratively shuffled labels for instructed beliefs (‘low’, ‘medium’ and ‘high’) within each participant while maintaining their original ratio (that is, one of each per participant). For each viable permutation (that is, a permutation whose model estimation converged and yielded any significant voxels), a within-subject rmANOVA was carried out, following which a parameter estimate was derived from the same ROI as the original design matrix to generate a surrogate distribution of beta estimates (N = 1,000).
Classification analysis
We decoded instructed belief conditions (‘low’, ‘medium’ and ‘high’) from multivoxel spatial patterns data using a rLDA classifier, ‘fitdiscr’ function in MATLAB50,51. Input data consisted of 20 participants’ first-level GLM maps × 3 conditions along with corresponding belief condition labels, which were used to train the rLDA. A tenfold cross-validation sample size was used. To test the model’s performance, we iteratively repeated this process with permuted data partitions (N = 10,000 for the whole thalamus / NAcc, N = 1,000 for thalamic nuclei) per ROI and compared classification accuracy of ground truth data to the surrogate distribution using nonparametric testing.
PPI analysis
PPI analysis provides a measure of the change in functional connectivity between different brain regions under a specific psychological context52. We defined a seed region (the thalamus), as defined by the WFU anatomical atlas, and a psychological context (‘market reveal’— the presentation of the investment’s return). We then conducted a PPI analysis per condition of instructed beliefs and compared those in a within-subject repeated-measures design. The generated PPI model included the PPI term, the physiological regressor, the psychological regressor and nuisance regressors of six motion parameters.
A 6 mm spherical ROI was defined based on previous investigation of the neural mechanisms of belief formation in the vmPFC by Rouault and Fleming53. The center of the sphere was set to reflect the coordinate of peak activation (MNI x = −6, y = 52, z = −10). In the follow-up exploratory analysis, the threshold of significance for the group-level rmANOVA from the PPI regressor was set to be P < 0.05 FWE cluster corrected, and at a cluster-defining threshold of P < 0.005 for uncorrected.
Data availability
Data supporting the findings of this study are deposited at https://osf.io/3hq6s/.
Supplementary Material
Acknowledgements
This work was supported by National Institute on Drug Abuse grant R01DA043695 (X.G.), National Institute on Drug Abuse grant R21DA049243 (X.G.) and University of Texas, Dallas internal funding (X.G.). The funders had no role in study design, data collection, data analysis or manuscript preparation. We thank staff members at the University of Texas Southwestern Imaging Center for their assistance with scanning, J. Jung and M. Labinski for their help with developing the fMRI task and J. Maclin for her help with participant recruitment. We also thank L. Berner for her advice on the statistical analysis, and D. Schiller and P. Kenny for their helpful discussions and comments on an earlier version of this manuscript.
Footnotes
Competing interests
The authors declare no competing interests.
Additional information
Supplementary information The online version contains supplementary material available at https://doi.org/10.1038/s44220-023-00188-9.
Peer review information Nature Mental Health thanks Cynthia Conklin, Qinghua He and Nicholas Parsons for their contribution to the peer review of this work.
Reporting summary
Further information on research design is available in the Nature Portfolio Reporting Summary linked to this article.
Code availability
The scripts used for data acquisition and analysis are available at https://osf.io/3hq6s/. Analyses were conducted using open software and toolboxes available online as described in Methods (SPM: www.fil.ion.ucl.ac.uk/spm/software/spm12; R Studio: https://www.rstudio.com/products/rstudio/download/#download; Lead-DBS: https://www.lead-dbs.org/download/; MRIcroGL: https://www.nitrc.org/projects/mricrogl/).
References
- 1.Posner MI, Petersen SE, Fox PT & Raichle ME Localization of cognitive operations in the human brain. Science 240, 1627–1631 (1988). [DOI] [PubMed] [Google Scholar]
- 2.Gu X, FitzGerald THB & Friston KJ Modeling subjective belief states in computational psychiatry: interoceptive inference as a candidate framework. Psychopharmacology (Berl.) 236, 2405–2412 (2019). [DOI] [PMC free article] [PubMed] [Google Scholar]
- 3.Goldstein RZ et al. The neurocircuitry of impaired insight in drug addiction. Trends Cogn. Sci 13, 372–380 (2009). [DOI] [PMC free article] [PubMed] [Google Scholar]
- 4.Volkow ND & Baler R Beliefs modulate the effects of drugs on the human brain. Proc. Natl Acad. Sci. USA 112, 2301–2302 (2015). [DOI] [PMC free article] [PubMed] [Google Scholar]
- 5.Kirsch I Response expectancy as a determinant of experience and behavior. Am. Psychol 40, 1189–1202 (1985). [Google Scholar]
- 6.Tallarida RJ Drug Synergism and Dose–Effect Data Analysis (CRC Press, 2000). [Google Scholar]
- 7.Abdel-Rahman SM & Kauffman RE The integration of pharmacokinetics and pharmacodynamics: understanding dose-response. Annu. Rev. Pharmacol. Toxicol 44, 111–136 (2004). [DOI] [PubMed] [Google Scholar]
- 8.Davis JM & Chen N Dose response and dose equivalence of antipsychotics. J. Clin. Psychopharmacol 24, 192–208 (2004). [DOI] [PubMed] [Google Scholar]
- 9.Benowitz NL, Jacob P & Herrera B Nicotine intake and dose response when smoking reduced-nicotine content cigarettes. Clin. Pharmacol. Ther 80, 703–714 (2006). [DOI] [PubMed] [Google Scholar]
- 10.Bisby JA, Leitz JR, Morgan CJA & Curran HV Decreases in recollective experience following acute alcohol: a dose–response study. Psychopharmacology (Berl). 208, 67–74 (2010). [DOI] [PubMed] [Google Scholar]
- 11.Curran VH, Brignell C, Fletcher S, Middleton P & Henry J Cognitive and subjective dose–response effects of acute oral Δ9-tetrahydrocannabinol (THC) in infrequent cannabis users. Psychopharmacology (Berl.) 164, 61–70 (2002). [DOI] [PubMed] [Google Scholar]
- 12.Mayberg HS et al. The functional neuroanatomy of the placebo effect. Am. J. Psychiatry 159, 728–737 (2002). [DOI] [PubMed] [Google Scholar]
- 13.Wager TD et al. Placebo-induced changes in fMRI in the anticipation and experience of pain. Science 303, 1162–1167 (2004). [DOI] [PubMed] [Google Scholar]
- 14.Benedetti F, Mayberg HS, Wager TD, Stohler CS & Zubieta JK Neurobiological mechanisms of the placebo effect. J. Neurosci 25, 10390–10402 (2005). [DOI] [PMC free article] [PubMed] [Google Scholar]
- 15.Price DD, Finniss DG & Benedetti F A comprehensive review of the placebo effect: recent advances and current thought. Annu. Rev. Psychol 59, 565–590 (2008). [DOI] [PubMed] [Google Scholar]
- 16.Zilcha-Mano S, Brown PJ, Roose SP, Cappetta K & Rutherford BR Optimizing patient expectancy in the pharmacologic treatment of major depressive disorder. Psychol. Med 49, 2414–2420 (2019). [DOI] [PubMed] [Google Scholar]
- 17.Rutherford B, Sneed J, Devanand D, Eisenstadt R & Roose S Antidepressant study design affects patient expectancy: a pilot study. Psychol. Med 40, 781–788 (2010). [DOI] [PMC free article] [PubMed] [Google Scholar]
- 18.Gu X et al. Belief about nicotine selectively modulates value and reward prediction error signals in smokers. Proc. Natl Acad. Sci. USA 112, 2539–2544 (2015). [DOI] [PMC free article] [PubMed] [Google Scholar]
- 19.Gu X et al. Belief about nicotine modulates subjective craving and insula activity in deprived smokers. Front. Psychiatry 7, 126 (2016). [DOI] [PMC free article] [PubMed] [Google Scholar]
- 20.Russell MAH Nicotine intake and its regulation. J. Psychosom. Res 24, 253–264 (1980). [DOI] [PubMed] [Google Scholar]
- 21.Giovino GA, Henningfield JE, Tomar SL, Escobedo LG & Slade J Epidemiology of tobacco use and dependence. Epidemiol. Rev 17, 48–65 (1995). [DOI] [PubMed] [Google Scholar]
- 22.Juliano LM, Fucito LM & Harrell PT The influence of nicotine dose and nicotine dose expectancy on the cognitive and subjective effects of cigarette smoking. Exp. Clin. Psychopharmacol 19, 105–115 (2011). [DOI] [PMC free article] [PubMed] [Google Scholar]
- 23.Kelemen WL & Kaighobadi F Expectancy and pharmacology influence the subjective effects of nicotine in a balanced-placebo design. Exp. Clin. Psychopharmacol 15, 93–101 (2007). [DOI] [PMC free article] [PubMed] [Google Scholar]
- 24.Watkins SS, Koob GF & Markou A Neural mechanisms underlying nicotine addiction: acute positive reinforcement and withdrawal. Nicotine Tob. Res 2, 19–37 (2000). [DOI] [PubMed] [Google Scholar]
- 25.Huang AS, Mitchell JA, Haber SN, Alia-Klein N & Goldstein RZ The thalamus in drug addiction: from rodents to humans. Philos. Trans. R. Soc 373, 20170028 (2018). [DOI] [PMC free article] [PubMed] [Google Scholar]
- 26.Haber SN & Knutson B The reward circuit: linking primate anatomy and human imaging. Neuropsychopharmacol. Rep 35, 4–26 (2010). [DOI] [PMC free article] [PubMed] [Google Scholar]
- 27.Shohamy D Learning and motivation in the human striatum. Curr. Opin. Neurobiol 21, 408–414 (2011). [DOI] [PubMed] [Google Scholar]
- 28.Shine JM, Lewis LD, Garrett DD & Hwang K The impact of the human thalamus on brain-wide information processing. Nat. Rev. Neurosci 10.1038/s41583-023-00701-0 (2023). [DOI] [PMC free article] [PubMed] [Google Scholar]
- 29.Brody AL et al. Cigarette smoking saturates brain alpha 4 beta 2 nicotinic acetylcholine receptors. Arch. Gen. Psychiatry 63, 907–915 (2006). [DOI] [PMC free article] [PubMed] [Google Scholar]
- 30.Mukhin AG et al. Greater nicotinic acetylcholine receptor density in smokers than in nonsmokers: a PET study with 2–18F-FA-85380. J. Nucl. Med 49, 1628–1635 (2008). [DOI] [PMC free article] [PubMed] [Google Scholar]
- 31.Gotti C et al. Nicotinic acetylcholine receptors in the mesolimbic pathway: primary role of ventral tegmental area α6β2* receptors in mediating systemic nicotine effects on dopamine release, locomotion, and reinforcement. J. Neurosci 30, 5311–5325 (2010). [DOI] [PMC free article] [PubMed] [Google Scholar]
- 32.Brody AL et al. Brain nicotinic acetylcholine receptor occupancy: effect of smoking a denicotinized cigarette. Int. J. Neuropsychopharmacol 10.1017/S146114570800922X (2009). [DOI] [PMC free article] [PubMed] [Google Scholar]
- 33.Brody AL et al. Effect of secondhand smoke on occupancy of nicotinic acetylcholine receptors in brain. Arch. Gen. Psychiatry 68, 953–960 (2011). [DOI] [PMC free article] [PubMed] [Google Scholar]
- 34.Spurden DP et al. Nicotinic receptor distribution in the human thalamus: autoradiographical localization of [3H]nicotine and [125I]α-bungarotoxin binding. J. Chem. Neuroanat 13, 105–113 (1997). [DOI] [PubMed] [Google Scholar]
- 35.Rubboli F et al. Distribution of nicotinic receptors in the human hippocampus and thalamus. Eur. J. of Neurosci 6, 1596–1604 (1994). [DOI] [PubMed] [Google Scholar]
- 36.Paterson D & Nordberg A Neuronal nicotinic receptors in the human brain. Prog. Neurobiol 61, 75–111 (2000). [DOI] [PubMed] [Google Scholar]
- 37.Picard F et al. High density of nicotinic receptors in the cingulo-insular network. Neuroimage 79, 42–51 (2013). [DOI] [PubMed] [Google Scholar]
- 38.Shepherd GMG & Yamawaki N Untangling the cortico-thalamo-cortical loop: cellular pieces of a knotty circuit puzzle. Nat. Rev. Neurosci 22, 389–406 (2021). [DOI] [PMC free article] [PubMed] [Google Scholar]
- 39.Garibotto V, Wissmeyer M, Giavri Z, Ratib O & Picard F Nicotinic acetylcholine receptor density in the ‘higher-order’ thalamus projecting to the prefrontal cortex in humans: a PET study. Mol. Imaging Biol 22, 417–424 (2020). [DOI] [PubMed] [Google Scholar]
- 40.de Kloet SF et al. Bi-directional regulation of cognitive control by distinct prefrontal cortical output neurons to thalamus and striatum. Nat. Commun 12, 1994 (2021). [DOI] [PMC free article] [PubMed] [Google Scholar]
- 41.Steward T et al. A thalamo-centric neural signature for restructuring negative self-beliefs. Mol. Psychiatry 27, 1611–1617 (2022). [DOI] [PMC free article] [PubMed] [Google Scholar]
- 42.Schuck NW, Cai MB, Wilson RC & Niv Y Human orbitofrontal cortex represents a cognitive map of state space. Neuron 91, 1402–1412 (2016). [DOI] [PMC free article] [PubMed] [Google Scholar]
- 43.Moneta N, Garvert MM, Heekeren HR & Schuck NW Task state representations in vmPFC mediate relevant and irrelevant value signals and their behavioral influence. Nat. Commun 14, 3156 (2023). [DOI] [PMC free article] [PubMed] [Google Scholar]
- 44.Petersen GO, Leite CE, Chatkin JM & Thiesen FV Cotinine as a biomarker of tobacco exposure: development of a HPLC method and comparison of matrices. J. Sep. Sci 33, 516–521 (2010). [DOI] [PubMed] [Google Scholar]
- 45.Duehlmeyer L, Parsons N, Malpas CB & Hester R Functional connectivity during feedback learning in smokers. Addict. Biol 27, e13109 (2022). [DOI] [PubMed] [Google Scholar]
- 46.Lohrenz T, McCabe K, Camerer CF & Montague PR Neural signature of fictive learning signals in a sequential investment task. Proc. Natl Acad. Sci. USA 104, 9493–9498 (2007). [DOI] [PMC free article] [PubMed] [Google Scholar]
- 47.Chiu PH, Lohrenz TM & Montague PR Smokers’ brains compute, but ignore, a fictive error signal in a sequential investment task. Nat. Neurosci 11, 514–520 (2008). [DOI] [PubMed] [Google Scholar]
- 48.Maldjian JA, Laurienti PJ, Kraft RA & Burdette JH An automated method for neuroanatomic and cytoarchitectonic atlas-based interrogation of fMRI data sets. Neuroimage 19, 1233–1239 (2003). [DOI] [PubMed] [Google Scholar]
- 49.Su JH et al. Thalamus Optimized Multi Atlas Segmentation (THOMAS): fast, fully automated segmentation of thalamic nuclei from structural MRI. Neuroimage 194, 272–282 (2019). [DOI] [PMC free article] [PubMed] [Google Scholar]
- 50.Zander TO, Kothe C, Jatzev S & Gaertner M in Brain–Computer Interfaces: Applying our Minds to Human–Computer Interaction (eds. Tan DS & Nijholt A) 181–199 (Springer, 2010). [Google Scholar]
- 51.Mandelkow H, De Zwart JA & Duyn JH Linear discriminant analysis achieves high classification accuracy for the BOLD fMRI response to naturalistic movie stimuli. Front. Hum. Neurosci 10, 1–12 (2016). [DOI] [PMC free article] [PubMed] [Google Scholar]
- 52.Friston KJ et al. Psychophysiological and modulatory interactions in neuroimaging. Neuroimage 6, 218–229 (1997). [DOI] [PubMed] [Google Scholar]
- 53.Rouault M & Fleming SM Formation of global self-beliefs in the human brain. Proc. Natl Acad. Sci. USA 117, 27268–27276 (2020). [DOI] [PMC free article] [PubMed] [Google Scholar]
- 54.Rushworth MFS & Behrens TEJ Choice, uncertainty and value in prefrontal and cingulate cortex. Nat. Neurosci 11, 389–397 (2008). [DOI] [PubMed] [Google Scholar]
- 55.Niv Y Learning task-state representations. Nat. Neurosci 22, 1544–1553 (2019). [DOI] [PMC free article] [PubMed] [Google Scholar]
- 56.Adem A et al. Distribution of nicotinic receptors in human thalamus as visualized by 3H-nicotine and 3H-acetylcholine receptor autoradiography. J. Neural Transm 73, 77–83 (1988). [DOI] [PubMed] [Google Scholar]
- 57.Wong DF et al. PET imaging of high-affinity a4b2 nicotinic acetylcholine receptors in humans with 18F-AZAN, a radioligand with optimal brain kinetics. J. Nucl. Med 54, 1308–1314 (2013). [DOI] [PubMed] [Google Scholar]
- 58.Lawrence NS, Ross TJ & Stein EA Cognitive mechanisms of nicotine on visual attention. Neuron. 36, 539–548 (2002). [DOI] [PubMed] [Google Scholar]
- 59.Stein EA et al. Nicotine-induced limbic cortical activation in the human brain: a functional MRI study. Am. J. Psychiatry 155, 1009–1015 (1998). [DOI] [PubMed] [Google Scholar]
- 60.Kumari V et al. Cognitive effects of nicotine in humans: an fMRI study. Neuroimage 19, 1002–1013 (2003). [DOI] [PubMed] [Google Scholar]
- 61.Levy DJ & Glimcher PW The root of all value: a neural common currency for choice. Curr. Opin. Neurobiol 22, 1027–1038 (2012). [DOI] [PMC free article] [PubMed] [Google Scholar]
- 62.Barbalat G, Bazargani N & Blakemore S-J The influence of prior expectations on emotional face perception in adolescence. Cereb. Cortex 23, 1542–1551 (2012). [DOI] [PubMed] [Google Scholar]
- 63.Perkins KA et al. Effects of central and peripheral nicotinic blockade on human nicotine discrimination. Psychopharmacology (Berl.) 142, 158–164 (1999). [DOI] [PubMed] [Google Scholar]
- 64.Perkins KA, Herb T & Karelitz JL Discrimination of nicotine content in electronic cigarettes. Addict. Behav 91, 106–111 (2019). [DOI] [PubMed] [Google Scholar]
- 65.Franklin TR et al. Limbic activation to cigarette smoking cues independent of nicotine withdrawal: a perfusion fMRI study. Neuropsychopharmacol. Rep 32, 2301–2309 (2007). [DOI] [PubMed] [Google Scholar]
- 66.Engelmann JM et al. Neural substrates of smoking cue reactivity: a meta-analysis of fMRI studies. NeuroImage 10.1016/j.neuroimage.2011.12.024 (2012). [DOI] [PMC free article] [PubMed] [Google Scholar]
- 67.McClernon FJ, Kozink RV & Rose JE Individual differences in nicotine dependence, withdrawal symptoms, and sex predict transient fMRI-BOLD responses to smoking cues. Neuropsychopharmacol. Rep 33, 2148–2157 (2008). [DOI] [PubMed] [Google Scholar]
- 68.Wilson SJ, Sayette MA, Delgado MR & Fiez JA Instructed smoking expectancy modulates cue-elicited neural activity: a preliminary study. Nicotine Tob. Res 7, 637–645 (2005). [DOI] [PMC free article] [PubMed] [Google Scholar]
- 69.McBride D, Barrett SP, Kelly JT, Aw A & Dagher A Effects of expectancy and abstinence on the neural response to smoking cues in cigarette smokers: an fMRI study. Neuropsychopharmacol. Rep 31, 2728–2738 (2006). [DOI] [PubMed] [Google Scholar]
- 70.Benowitz NL & Henningfield JE Reducing the nicotine content to make cigarettes less addictive. Tob. Control 22, Suppl 1:i14–i17 (2013). [DOI] [PMC free article] [PubMed] [Google Scholar]
- 71.Nakamura Y et al. Investigating dose-dependent effects of placebo analgesia: a psychophysiological approach. Pain 153, 227–237 (2012). [DOI] [PubMed] [Google Scholar]
- 72.Geuter S, Eippert F, Hindi Attar C & Büchel C Cortical and subcortical responses to high and low effective placebo treatments. Neuroimage 67, 227–236 (2013). [DOI] [PMC free article] [PubMed] [Google Scholar]
- 73.Cui Y et al. The impact of nicotine dose and instructed dose on smokers’ implicit attitudes to smoking cues: an ERP study. Psychol. Addict. Behav 33, 710–720 (2019). [DOI] [PMC free article] [PubMed] [Google Scholar]
- 74.de Wit H, Uhlenhuth EH & Johanson CE Individual differences in the reinforcing and subjective effects of amphetamine and diazepam. Drug Alcohol Depend 16, 341–360 (1986). [DOI] [PubMed] [Google Scholar]
- 75.Scott DJ et al. Individual differences in reward responding explain placebo-induced expectations and effects. Neuron 55, 325–336 (2007). [DOI] [PubMed] [Google Scholar]
- 76.SPM12 algorithms. Univeristy College London http://fil.ion.ucl.ac.uk/spm (2014). [Google Scholar]
- 77.Mazaika PK, Whitfield-Gabrieli S Reiss A & Glover G Artifact repair for fMRI data from high motion clinical subjects. Hum. Brain Mapp 47, 70238–1 (2007). [Google Scholar]
- 78.Woo C-W, Krishnan A & Wager TD Cluster-extent based thresholding in fMRI analyses: pitfalls and recommendations. Neuroimage 91, 412–419 (2014). [DOI] [PMC free article] [PubMed] [Google Scholar]
- 79.Lieberman MD & Cunningham WA Type I and type II error concerns in fMRI research: re-balancing the scale. Soc. Cogn. Affect. Neurosci 4, 423–428 (2009). [DOI] [PMC free article] [PubMed] [Google Scholar]
Associated Data
This section collects any data citations, data availability statements, or supplementary materials included in this article.
Supplementary Materials
Data Availability Statement
Data supporting the findings of this study are deposited at https://osf.io/3hq6s/.