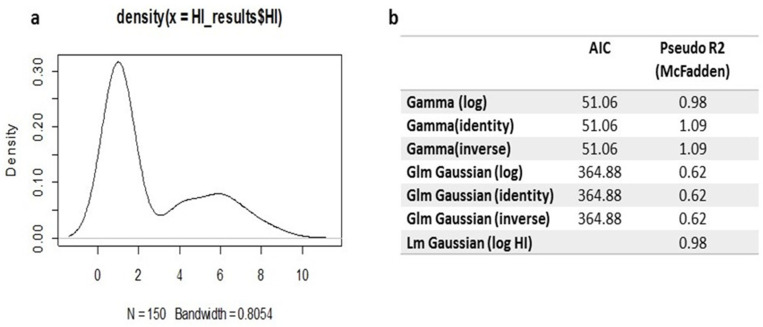
Figure 7.
(a) Density plot showing the positive skewness in the HI titre distribution. (b) Model selection criteria for linear and generalised linear designs based on the Akaike Information Criterion (AIC). N = number of collected serum samples from all experiment pigeon groups throughout the experiment periods.

