Abstract
Drug-resistant epilepsy with frequent seizures are considered to undergo surgery to become seizure-free, but seizure-free rates have not dramatically improved, partly due to imprecise intervention locations. To address this clinical need, we construct effective connectivity to reveal epilepsy brain dynamics. Based on the propagation path captured by the high order effective connectivity, calculate the control centrality evaluation scheme of the excised area. We used three datasets: simulation dataset, clinical dataset, and public dataset. The epileptogenic propagation network was quantified by calculating high-order effective connection to obtain accurate propagation path, based on this, combined with the outdegree index for virtual resection. By removing electrodes and recalculating control centrality, we quantify each electrode or region’s control centrality to evaluate the virtual resection scheme. Three datasets obtained consistent results. We track the accurate propagation path and find the obvious inflection points occurring during the excision process. The minimum intervention targets were obtained by comparing different schemes without recurrence. The clinical data with multiple seizures found that after resection, the brain reaches a stable state and is less likely to continue spreading. By quantitative analysis of control centrality to evaluate the possible excision scheme, finally we obtain the best intervention area for epilepsy, which assist in developing surgical plans.
Supplementary Information
The online version contains supplementary material available at 10.1038/s41598-024-77216-w.
Keywords: Drug-resistant epilepsy, Propagation network, High-order effective connection, Control centrality, Minimum intervention target
Subject terms: Epilepsy, Electroencephalography - EEG, Network topology
Introduction
There are approximately 65 million epilepsy patients worldwide, of which one-third of patients have drug resistance1. In these cases, it is usually necessary to reduce seizures through surgery2. Resections could be extensive, with a large amount of healthy tissue removed, often leading to postoperative side effects, including neuropsychological disorders and decreased quality of life3,4. Unfortunately, despite removing the assumed severe epileptic seizures, some patients still recurrent5,6. This is mainly due to the incomplete surgical plan and the imprecise targeting of the area. Identifying these important targets is a key step in optimizing the use of existing resection surgeries.
In recent years, the stereo-electroencephalography (SEEG) has been widely used in localization diagnosis of Epileptogenic Zone, treatment plan formulation, and prognosis prediction of epilepsy7,8. SEEG is an advanced invasive neurophysiological method that directly implant electrodes into deep brain structures through stereotactic technology9,10. The mainstream signals also include electroencephalogram (EEG) signals, electrocorticography (ECoG) signals. EEG is non-invasive and has a larger spatial coverage, but it has a low signal-to-noise ratio. ECoG signals requires larger craniotomy during implantation process and can only monitor partial brain discharge characteristics, which has spatial limitations. SEEG has less interference, rich signals, high temporal resolution, and precise recordings, which can better describe the dynamic changes of epilepsy9,11–13. In fact, clinical practice requires an objective assessment of changes in the brain network of potential epileptic seizures.
Seizures are a directed network phenomenon in which the seizure onset zone (SOZ) typically not only drives the occurrence and spread of seizures, but also recruits areas far beyond it to serve as critical hubs14,15. The effective connectivity (EC) between brain electrodes allows us to identify specific directed propagation networks16–19. Saramati Narasimhan et al. used EC to analyze the direction and intensity of brain connectivity based on clinically known lesions and propagation areas, only analyzing differences in different regions11. Gabriel M. Schroeder et al. used EC to study the differences between epileptic seizures and discovered the variability of epileptic seizure network evolution20. Common EC methods include bayesian networks21, granger causality analysis22,23, and partially directed coherence24. Most of the methods need to be modeled in advance to describe the directed relationship of neural activity in brain regions. However, the transfer entropy (TE) does not require pre modeling, so it has certain advantages in terms of low correlation sensitivity and detection error25,26. The high-order TE mode data from sEEG reveals the dynamic information of brain propagation in epilepsy patients, which could be used to obtain the propagation mode of epilepsy27,28.
Based on the propagation mode, clinicians could formulate surgical schemes, but there are no standards to evaluate the effectiveness and accuracy of the schemes. We proposed the control centrality to explore the virtual resection scheme for the spread of epileptic seizures and the spatiotemporal evolution characteristics of synchronization preoperative and postoperative. We remove electrodes and recalculating control centrality, then we obtain the preliminary scheme by the trend of control centrality. After, the final target location is determined according to certain optimization principles. The method is first evaluated with simulated data, and then applied to 16 clinical patients with 32 seizures from two distinct datasets. Finally, the best target was found, and we have guiding significance for clinical surgical planning.
Materials and methods
Patients
We used two datasets: (1) Clinical data with 6 patients with 12 seizures from the neurosurgery department of Shanxi Provincial People’s Hospital; (2) HUP data with 10 patients with 20 seizures from the public dataset (Hospital of the University of Pennsylvania).
For the Clinical data (Table S1), the study protocols complied with the Code of Ethics of the Declaration of Helsinki and approved by Shanxi Provincial People’s Hospital. All the participants provided written informed consent as approved by the institutional review board. All patients underwent a one-year postoperative follow-up. The sEEG electrode implantation area is based on non-invasive discovery. Electrode placement was planned by a panel of epileptologists according to the clinical protocol with a separate reference electrode placed in the location of seizure onset (Table S2). Each electrode had a diameter of 0.8 mm and consists of 5–18 contacts with a length of 2 mm and a spacing of 1.5 mm at 1000 Hz sampling rate. Under general anesthesia, electrodes were implanted using a Robotic Surgical assistant (ROSA) system.
For the HUP data (Table S3), cortical surface electrode configurations, determined by a multidisciplinary team of neurologists and neurosurgeons, consisted of linear and 2D arrays (2.3-mm diameter with 10-mm intercontact spacing). Signals were recorded and digitized at 500 Hz sampling rate and preprocessed to eliminate line noise. Details are available on the public web site (https://openneuro.org/).
Preprocessing with the Brainstorm tool29: First we removed the bad channels, then performed ICA to remove any artifacts, bandpass filtered at 0.16–97 Hz, and down-sample from 1000 Hz to 500 Hz. By reducing the sampling rate, important information can be retained while reducing the amount of data, making subsequent analysis and processing more efficient. The bad channels were mainly determined according to sEEG observations and the doctor’s record during the operation. The ICA-based artifact correction approach was applied to separate and remove artifacts in the SEEG data through linear decomposition.
Simulation data
Resection schemes could be obtained using real data, but the current gold standard for judging their correctness is still EEG analysis by a trained clinician, which is time-consuming, subjective, and might miss important features. We used the “Epileptor” model, proposed by Jirsa30, to generated simulated data to evaluate the accuracy of the resection plan. This model has been applied to explain many dynamic pathways of epileptic seizures31 and demonstrate changes in brain network functional connectivity32. The model is carried out here using the following five equations:
 |
1 |
 |
2 |
 |
3 |
 |
4 |
 |
5 |
where
 |
6 |
 |
7 |
 |
8 |
where τ0 = 2857, τ2 = 10, I1 = 3.1, I2 = 0.45, and γ = 0.01. The parameter x0 indicates the excitability of the brain region (see Appendix S1 for details).
We used the “Epileptor” model to generate five sets of simulated data to explore the general laws of virtual resection. The data were generated from 588 nodes and 56 nodes affected by seizures. For the five simulations, different parameters were set respectively for the EZ, early propagation and late propagation depth electrodes during each simulation (Table S4). The simulations were generalizability: spread within the same depth electrodes; spread to the contralateral brain; spread between different depth electrodes.
Construct high order efficient network
Construct efficient network
We construct a directed brain network using transfer entropy (TE) to estimate the flow of information from one time series to another33. TE could also be used as a measure of causality, because it considers the information transfer between variables without assuming that there is a specific relationship between variables, especially for nonlinear systems34,35. The TE method is described in greater detail in Appendix S2:
 |
9 |
Perform Fisher transformation on the obtained effective matrix. Next, we apply FDR (Benjamin and Hochberg) correction at the 0.001 level to control the false positive rate. Finally, we binarize the matrix to obtain directed graphs, which will serve as input data for high-order TE (HTE) analysis.
Capture propagation mode
In order to find the specific seizure propagation pathways, we proposed HTE to describe the propagation of effective connections in brain networks, which can identify characteristic regions connected to specific seed brain regions at different link-step levels.
All HTE analyses were conducted at the individual level of each participant. In our framework, step refers to the number of links (edges) connecting an electrode to the path of the target electrode. Considering that epilepsy patients reach a multimodal integrated network in the third stage, only three linking steps were proposed, which could capture three neighbors. This is because we found that the third-order network of epilepsy patients basically includes the EZ region and PZ region27. By using the HTE method, the propagation path of epilepsy could be accurately captured. On this basis, surgical schemes could be formulated, but evaluation criteria are lacking.
 |
10 |
Virtual resection evaluation
On these basis, we first measure network synchronization by calculating the Laplacian matrix of each adjacency matrix36,37. The Laplacian matrix could be interpreted as a measure of how easily information spreads among electrodes in a network38:
 |
13 |
 is the outdegree matrix of
  .
.
Next, we calculate the asymmetric synchronization as the ratio of the third smallest eigenvalue to the largest eigenvalue of the Laplacian matrix, which quantifies the stability of the synchronization state39:
 |
12 |
Where  is the largest eigenvalue of the Laplacian matrix and
  is the second smallest eigenvalue of the Laplacian matrix.
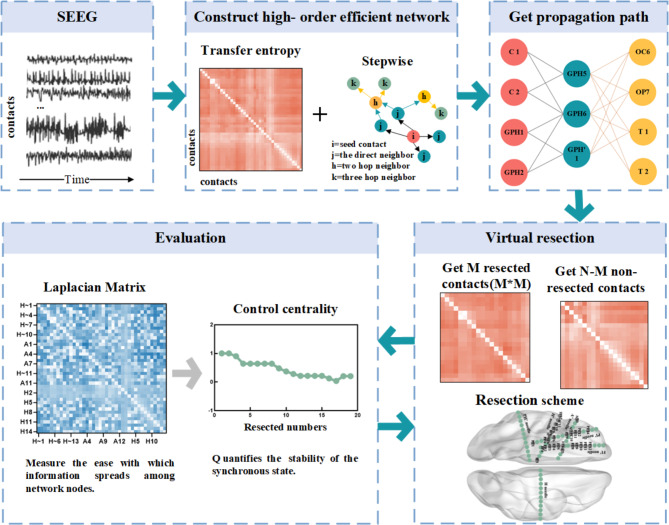
To simulate the effect of excision surgery, we used the method of virtual cortical excision, which quantifies the contribution of control centrality as synchronicity40. The calculation process of control centrality: step 1, HTE captured the propagation path; Step 2, gradually removed contacts from the propagation path; Step 3, re-calculate the asymmetric synchronicity of the remaining contact composition area to evaluate its stability. Control centrality can be calculated after remaining each contact or the entire region of interest (composed of many contacts). In this study, based on the propagation path, we cut it off within each layer according to the outdegree (from left to right, from top to bottom), and calculated the control centrality at the contact level. The epilepsy network analysis is shown in Fig. 1, including 2.4 and 2.5.
Fig. 1.
A pipeline for epilepsy network analysis. The sEEG pipeline uses transfer entropy to construct a directed connection matrix, and a higher-order matrix containing a propagation network is obtained by step process. The removed contacts are determined from the higher-order matrix and the control centrality after removing area is calculated.
Results
Simulation data characteristics
Based on a prior assumption: when adjacent contacts such as GPH5 and GPH6 are encountered during resection, we will be considered for resection together. This is due to the physical proximity of these two contacts.
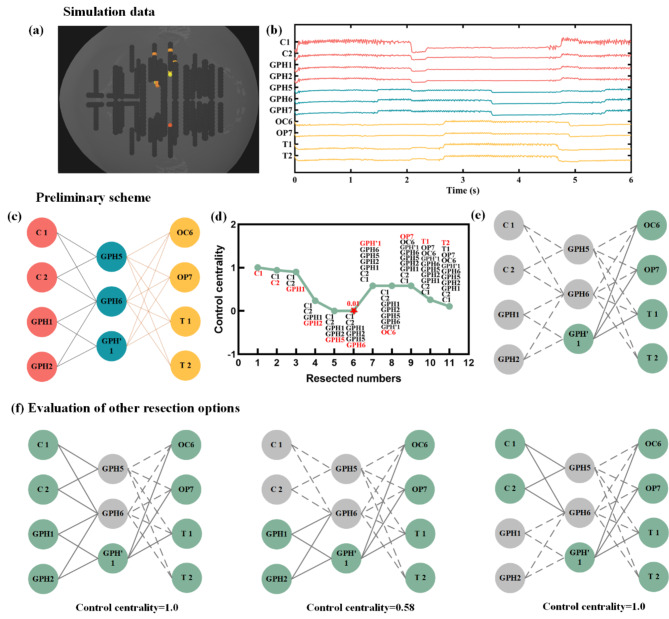
Figure 2 shows simulation 1, using TB1, TB’1, and B’1 as seed nodes. The connection propagates first to SA8, SA9, PM9, and PP9, and then to nodes such as OC5, OP1, OT1, and OT2. Figure 2(e) was the corresponding resection scheme, which was based on the propagation path and was remove sequentially within each layer in order of outdegree. As the number of nodes removed increases, we could observe a clear turning point in the trend of control centrality, and after removing GPH6, the stability reaches its lowest value. Figure 2(f) shows other resection schemes, and it could be seen that their control centrality is greater than 0.01.
Fig. 2.
Simulation1 removal scheme. (a) The position of simulate contact; (b) The simulated sEEG data; (c) The propagation path (red represents the EZ region, blue represents the early propagation region, and yellow represents the late propagation region); (d) Based on the propagation path, remove sequentially from left to right and from top to bottom to obtain the control centrality trend. The red letters represent the newly added of removed nodes. The red pentagonal center is the lowest point of value; (e) The excision scheme corresponding to red pentagonal center of (d). The gray indicating the remove contact and dashed indicating the broken connection. Green indicates that the contact does not need to be removed; (f) Other possible resection options and their control centrality values.
The other four simulations are shown in Figure S1, with the first column showing the sequential removal scheme and the second column showing the corresponding changes in control centrality, all of which could be observed with obvious inflection point positions. The third column is the final resection plan obtained after comparing and studying with other possible schemes. The appendix only shows all schemes for simulation 3 and 5 (Figure S2 and S3). Other simulations can be extrapolated in this way.
Propagation path of subjects
A total of 16 patients who underwent sEEG implantation were evaluated. The high-order effective connection method identifies many potential contacts, which could obtain accurate propagation paths and has significant predictive significance.
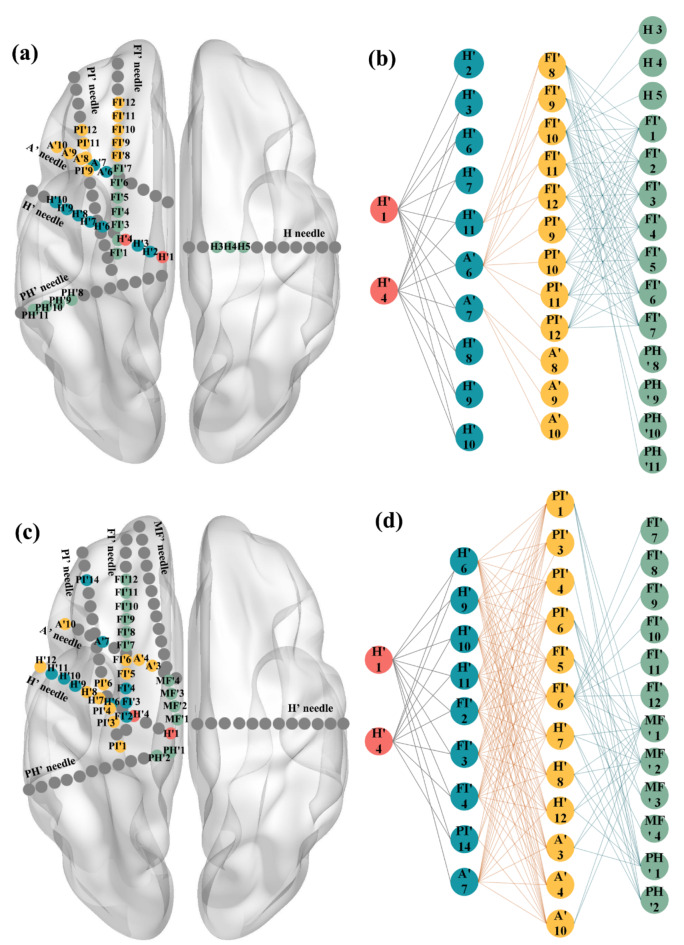
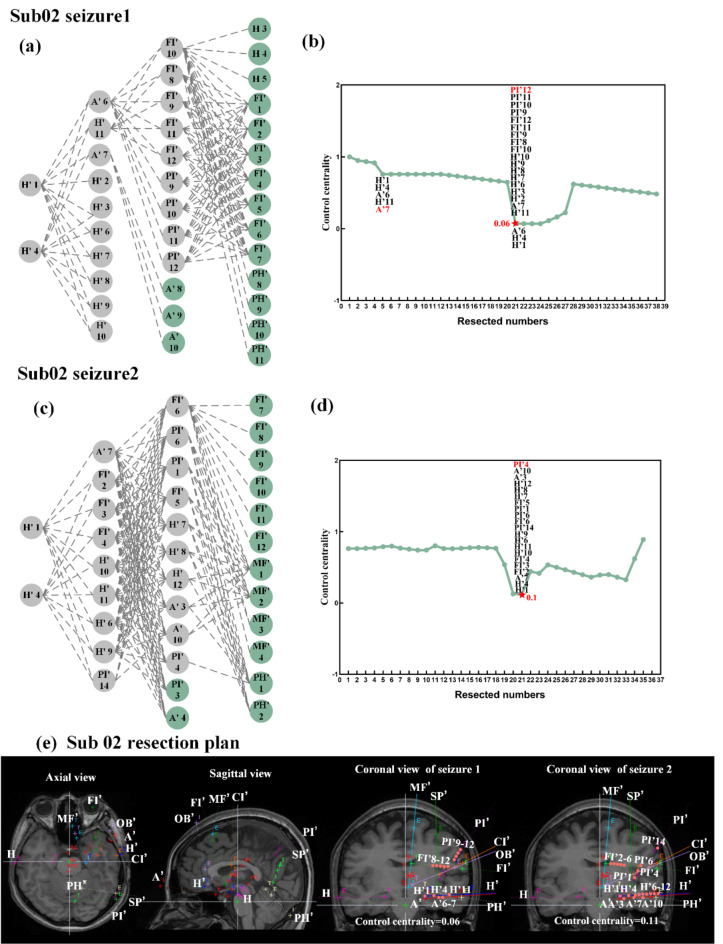
In Fig. 3, the propagation paths of the two seizures of sub02 could be observed: the first seizure originated from H’1 and H’4, first spreading to the H’ and A’ electrodes, then continuing to spread to the FI’ and PI’ electrodes, and finally involving the H electrode of the contralateral brain. It can also be observed that onset and early propagation of the two seizures are basically the same (red and blue), but the subsequent propagation contacts are not completely the same. By measure the outdgree and number of nodes of the network, we could find the second seizure is more complex than the first seizure, so this also requires us to comprehensively consider the patient’s multiple seizures when performing surgical interventions.
Fig. 3.
Sub02 propagation path: (a) the location of the contacts of first seizure; (b) the propagation path of first seizure; (c) the location of the contacts of second seizure; (d) the propagation path of second seizure. Red represents the EZ region, blue represents the first propagation region, yellow represents the second propagation region, green represents the third propagation region and gray represents the non-propagation region.
Virtual resection analysis of subjects
On the basis of sequentially resecting and finding inflection points, we tried to preserve as many contacts as possible to ensure the quality of life of postoperative patients. We mainly presented the results of two subjects, and the remaining patient resection plans are shown in the supplementary.
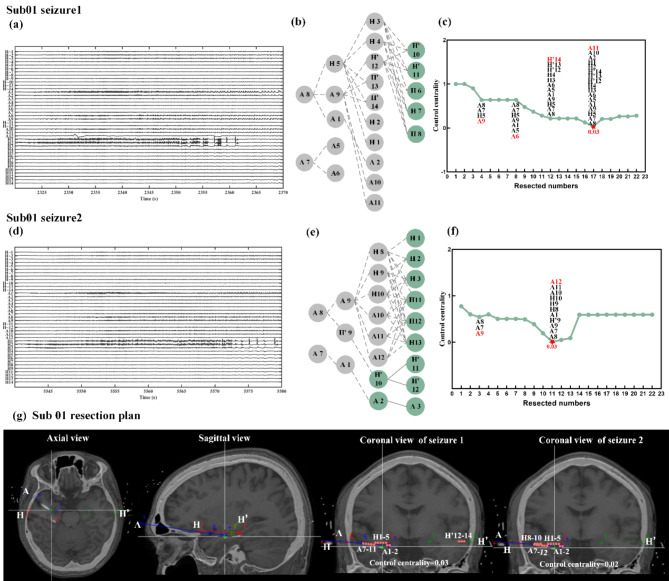
The two seizures of Sub01 are shown in Fig. 4. For the first seizure, we could observe that when sequentially removed following the propagation path provided in Fig. 4(b), the second layer is removed to a minimum value of 0.03(Fig. 4c). Considering the other removing schemes, 0.03 could also be achieved when A5 and A6 contacts were retained (Fig. 4g). For the second seizure, the H’9 contact could be retained, which could try to remove only one hemisphere area (Fig. 4g). The two seizures of Sub02 are shown in Fig. 5. The optimal resection plan for Sub02’s first seizure (Fig. 5e) could preserve the H’2, H’3, H’6-H’10 contacts. The results of other patients are shown in the Figure S4, S5 and S6.
Fig. 4.
Sub01 removal scheme. (a) The sEEG recording of seizure 1; (b) Based on the propagation path, remove sequentially of seizure 1; (c) The trend of control centrality of seizure 1. The removed contacts are cut off sequentially from left to right and from top to bottom according to the propagation path of the (b) diagram. The red letters represent the newly added of removed contacts. The red pentagonal center is the lowest point of value, corresponding to the (b) figure; (d) The sEEG recording of seizure 2; (e) Based on the propagation path, remove sequentially of seizure 2; (f) The trend of control centrality of seizure 2; (g) Sub01 resection plan. The red points represent the removed contacts (E and T represent the tip of the deep electrode and the craniotomy site, respectively. Different colors represent different deep electrodes, and the names of the deep electrode are given in the figure).
Fig. 5.
Sub02 removal scheme. (a) Based on the propagation path, remove sequentially of seizure 1; (b) The trend of control centrality of seizure 1; (c) Based on the propagation path, remove sequentially of seizure 2; (d) The trend of control centrality of seizure 2; (e) Sub02 resection plan. The red points represent the removed contacts.
Comparison of control centrality between pre-seizure, seizure and VR-seizure
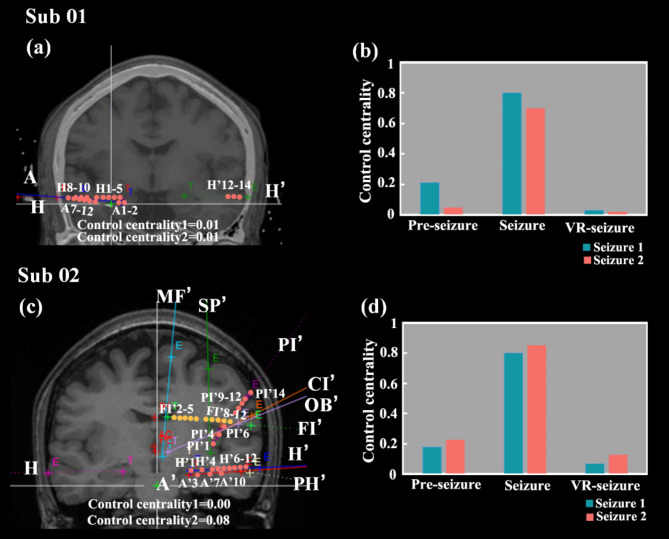
Based on the above results, we could find that the resection area targeted for each seizure of the same subject is inconsistent. After considering both seizures of the patient, we obtained the final resection plan (Fig. 6a and c). And under this resection scheme, the control centrality value of both seizures was lower. For example, in Sub01, the control centrality of the first seizure was reduced from 0.03 (Fig. 4g) to 0.01(Fig. 6a) and the second seizure from 0.02 (Fig. 4g) to 0.01 (Fig. 6a) under this excision protocol.
Fig. 6.
The final resection plan of the subjects and the comparison results of the three stages. (a) The final resection plan of Sub01; (b) the comparison results of the three stages of Sub01; (c) The final resection plan of Sub02; (d) the comparison results of the three stages of Sub02. Red indicates the remove contact. Yellow indicates that the contact is not resected in clinical operation, but our study found that the contact should be removed.
We compared the control centrality of the three stages: pre-seizure, seizure, and after virtual resection of seizure (VR-seizure). It could be observed that the value during the seizure is the highest, and after virtual resection, the value decreases significantly, even more stable than pre-seizure (Fig. 6b and d). It proved that the resection protocol effectively controlled the continued transmission of epilepsy.
Discussion
One of the main goals of epilepsy surgery research is to determine the resection area to optimize the surgical plan. We used VEP model to simulate the spread of epileptic seizures and performed virtual resection to measure the suitability of the resection area by control centrality. We believe that the decrease of control centrality during virtual resection indicates strong stability and epilepsy is highly likely to no longer continue to spread. Afterwards, we used a directed network from sEEG data to perform virtual resection analysis on 16 patients, and ultimately obtained the optimal resection plan by analyzing multiple seizures of the patients.
There are currently two mainstream research methods, one is to identify the resection effect by using neural mass models parameterized by functional connectivity41–45. Firstly, Sinha et al. identified the contact that caused the network to transition to epileptic dynamics at the fastest speed through subcritical Hopfbifurcation46,47. Secondly, Goodfellow et al. used a more mechanical model that determined that removing nodes could reduce the number of epileptiform dynamic through saddle nodes on a limit cycle bifurcation48,49. The method of using models requires DTI modeling and has a high time cost.
Another approach is to identify resection effects by constructing a brain network50. Lohith G. Kini et al. directly calculated the functional network from the clinical records of intracranial electroencephalogram, and they obtained the resection plan by control centrality visualization of the resection results51.In contrast, our current virtual resection study uses a network framework to directly describe the contact level of each patient during seizures. Therefore, our method is not limited by simulating epileptic seizures. We also used each seizure of each patient to obtain the corresponding resection plan, rather than just the first seizure48 or pure interictal data47. The advantages of our research have brought us closer to becoming a clinical tool and demonstrated significant novelty in our work in the field of epilepsy personalized networks.
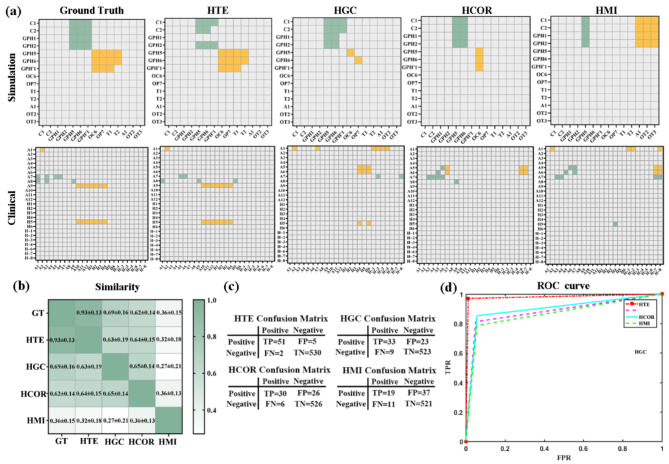
The first step of our research was verified stepwise transfer entropy (STE) through comparative experiments: whether the tracked propagation path is accurate. We compared the performance of different network construction methods, such as high-order Granger causality (HGC), high-order correlation (HCOR), and high-order mutual information (HMI) methods. The comparison between the heat maps obtained by different methods and the standard propagation path is shown in Fig. 7 (a). The results obtained from simulated data and clinical STE data (column 2) are consistent with the ground truth results (column 1). As shown in Fig. 7 (b), the similarity between the STE method and the standard results is the highest, reaching 0.93. The confusion matrix and accuracy results are shown in Fig. 7 (c) and (d), with accuracy rates of 97.9%, 88.1%, 89.8%, and 86.5% for different methods. The effectiveness of STE was ultimately proven.
Fig. 7.
Comparison of different high-order effective connection method: (a) heatmaps based on simulation and clinical data. The first column is the standard propagation path. The propagation contacts obtained by the different methods were as follows: green represents the primary transmission contact, and yellow represents the secondary transmission contact; (b) the similarity matrix; with darker colors indicating higher similarity; (c) the confusion matrix; (d) the accuracy value. GT: Ground truth.
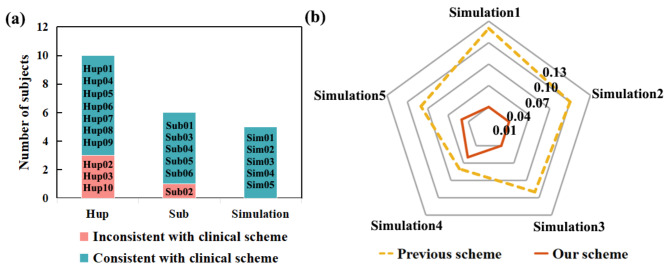
In our validation of virtual resection methods, the lowest point position could be found in all simulated data. Compared to the results obtained in previews study (yellow dashed line)51, our resection scheme (red solid line) achieved lower control centrality (Fig. 8b), resulting in a more effective surgical plan. This may be due to their computational functional network ignoring the direction information of the network, and the first-order network being unable to capture its propagation mode.
Fig. 8.
Type of seizure in all subjects with clinical scheme and comparison results with previous scheme of simulations.
Among the 16 patients in our study, 12 patients obtained resection targets that were consistent with clinical scheme, while 4 patients had inconsistent conclusions (Fig. 8a). According to Table S1 and S2, it can be found that the prognosis of the 4 inconsistent patients is poor with the high Engle coefficient. Clinical doctor did not consider the FI electrode during the resection of sub02 during the first operation, and the patient relapsed a second time. The clinician was invited to work out the surgical plan according to our method for re-evaluation, and the FI electrode was operated on in the second operation (Fig. 6c yellow electrode). During the follow-up period of up to six months, this subject did not experience any recurrence, proving that the resection plan proposed in our study was more effective. In the future, we should increase the number of patients and the types of epilepsy to further validate our method.
We suggest that after finding the lowest point of control centrality, a surgical plan should be developed based on the following criteria: cutting as few contacts as possible and involving fewer deep electrodes; After obtaining the removed area, focus on whether the areas related to cognitive function can be preserved to minimize damage to cognitive function. In short, try to preserve more areas of the patient’s brain as much as possible, without affecting their postoperative life to the greatest extent possible. Finally, by obtaining the virtual resection plan and the clinical doctor observation, the final surgical plan is formulated. Linking stimuli with virtual resection measures may help develop target resection algorithms. Due to recent technology allowing for intracranial electroencephalogram streaming to online cloud platforms52, our virtual resection method and network metric calculation could also be implemented in real-time during stimulus based mapping processes.
We propose a method for mapping epilepsy networks and virtual resection, based on rigorous verification of network contact resection. Despite the limitations of our research, our findings suggest that these tools may have value in planning epilepsy surgeries. We hope that this work may be further development, and in the future, evaluating the effects of stimulating these contacts and subsequent changes in synchronicity through experiments will enable clinical doctors to better predict the effectiveness of targeted resection of these contacts.
Electronic supplementary material
Below is the link to the electronic supplementary material.
Acknowledgements
This work was supported by the National Natural Science Functional of China (62376184, 62206196, 62303445), Shanxi Province Free Exploration Basic Research Project (YDZJSX20231A017), the China Postdoctoral Science Foundation (2023M733669), and the Shanxi Province Application Basic Research Plan (20210302124550, 202203021222097, 202103021223035 and 202103021224384).
Author contributions
J.S.: Conceptualization, Methodology, Investigation, Formal analysis, Writing – original draft, Writing – review & editing. Y.N.: Validation. YD.D.: Resources. Mn. Z.: Investigation. Y.R.: Software. JH. M.: Data curation, Writing – review & editing, Supervision. X.W.: Writing – review & editing, Funding acquisition. J.X.: Resources, Writing – review & editing, Funding acquisition.
Data availability
Sequence data that support the findings of this study have been deposited in the Hospital of the University of Pennsylvania on the public website (https://openneuro.org/).
Declarations
Conflict of interest
None of the authors has any conflict of interest to disclose. We confirm that we have read the Journal’s position on issues involved in ethical publication and affirm that this report is consistent with those guidelines.
Footnotes
Publisher’s note
Springer Nature remains neutral with regard to jurisdictional claims in published maps and institutional affiliations.
Contributor Information
Xin Wen, Email: cquwx0214@163.com.
Jie Xiang, Email: xiangjie@tyut.edu.cn.
References
- 1.Ferastraoaru, V. et al. Termination of seizure clusters is related to the duration of focal seizures [J]. Epilepsia. 57 (6), 889–895 (2016). [DOI] [PubMed] [Google Scholar]
- 2.Garcia, P. A., Barbaro, N. M. & Laxer, K. D. The prognostic value of postoperative seizures following epilepsy surgery [J]. Neurology. 41 (9), 1511–1512 (1991). [DOI] [PubMed] [Google Scholar]
- 3.Katlowitz, K. A. et al. Seizure Outcomes after Resection of Primary Brain Tumors in Pediatric Patients: A Systematic Review and meta-analysis [J] (Journal of Neuro-Oncology, 2023). [DOI] [PubMed]
- 4.Bratu, I. F. et al. Permutation entropy-derived parameters to estimate the epileptogenic zone network [J]. Epilepsia. 65 (2), 389–401 (2024). [DOI] [PubMed] [Google Scholar]
- 5.Giammattei, L. et al. Surgical morbidity of the extradural anterior petrosal approach: the lariboisiere experience [J]. J. Neurosurg.138 (1), 276–286 (2023). [DOI] [PubMed] [Google Scholar]
- 6.Tomlinson, S. B. et al. Alterations of network synchrony after epileptic seizures: an analysis of postictal intracranial recordings in pediatric epilepsy patients [J]. Epilepsy Res.143 (1), 41–49 (2018). [DOI] [PMC free article] [PubMed]
- 7.Chari, A., Surg U K C & S E. The UK experience of stereoelectroencephalography in children: an analysis of factors predicting the identification of a seizure-onset zone and subsequent seizure freedom [J]. Epilepsia. 62 (8), 1883–1896 (2021). [DOI] [PubMed] [Google Scholar]
- 8.Moles, A. et al. SEEG-guided radiofrequency coagulation (SEEG-guided RF-TC) versus anterior temporal lobectomy (ATL) in temporal lobe epilepsy [J]. J. Neurol.265 (9), 1998–2004 (2018). [DOI] [PubMed] [Google Scholar]
- 9.Bourdillon, P. et al. Stereo electroencephalography-guided radiofrequency thermocoagulation (SEEG-guided RF-TC) in drug-resistant focal epilepsy: results from a 10-year experience [J]. Epilepsia. 58 (1), 85–93 (2017). [DOI] [PubMed] [Google Scholar]
- 10.Katz, J. S. & Abel, T. J. Stereoelectroencephalography Versus Subdural electrodes for localization of the Epileptogenic Zone: what is the evidence? [J]. Neurotherapeutics. 16 (1), 59–66 (2019). [DOI] [PMC free article] [PubMed] [Google Scholar]
- 11.Narasimhan, S. et al. Seizure-onset regions demonstrate high inward directed connectivity during resting-state: an SEEG study in focal epilepsy [J]. Epilepsia. 61 (11), 2534–2544 (2020). [DOI] [PMC free article] [PubMed] [Google Scholar]
- 12.Carron, R. et al. Thalamic sEEG and epilepsy [J]. J. Neurosurg.138 (4), 1172–1173 (2023). [DOI] [PubMed] [Google Scholar]
- 13.Peng, G. C. et al. SEEG-based epileptic seizure network modeling and analysis for pre-surgery evaluation [J]. Comput. Biol. Med.167 (1), 107692 (2023). [DOI] [PubMed]
- 14.Wang, G. et al. Seizure prediction using Directed transfer function and convolution neural network on intracranial EEG [J]. IEEE Trans. Neural Syst. Rehabil. Eng.28 (12), 2711–2720 (2020). [DOI] [PubMed] [Google Scholar]
- 15.Matarrese, M. A. G. et al. Spike propagation mapping reveals effective connectivity and predicts surgical outcome in epilepsy [J]. Brain. 146 (9), 3898–3912 (2023). [DOI] [PMC free article] [PubMed] [Google Scholar]
- 16.Freitas, S. et al. Graph vulnerability and robustness: a survey [J]. IEEE Trans. Knowl. Data Eng.35 (6), 5915–5934 (2023). [Google Scholar]
- 17.Neufang, S. et al. Predicting effective connectivity from resting-state networks in healthy elderly and patients with prodromal Alzheimer’s disease [J]. Hum. Brain. Mapp.35 (3), 954–963 (2014). [DOI] [PMC free article] [PubMed] [Google Scholar]
- 18.Honey, G. D. et al. Dopaminergic drug effects on physiological connectivity in a human cortico-striato-thalamic system [J]. Brain: J. Neurol.126 (Pt 8), 1767–1781 (2003). [DOI] [PMC free article] [PubMed] [Google Scholar]
- 19.Peng, G. C. et al. Modeling and Analysis of Seizure Network Using SEEG for Pre-Surgery Evaluation; proceedings of the IEEE 22nd International Conference on Bioinformatics and Bioengineering (BIBE), Asia Univ, ELECTR NETWORK, F Nov 07–09, 2022 [C]. 2022.
- 20.Schroeder, G. M. et al. Seizure pathways and seizure durations can vary independently within individual patients with focal epilepsy [J]. (2021).
- 21.Li, X. Y., Zhang, L. M. & Zhang, S. Efficient bayesian networks for slope safety evaluation with large quantity monitoring information [J]. Geosci. Front.9 (6), 1679–1687 (2018). [Google Scholar]
- 22.Yang, G. X. et al. Nonlinear causal network learning via Granger causality based on extreme support vector regression [J]. Chaos34 (2), 023127 (2024). [DOI] [PubMed]
- 23.Coben, R. & Mohammad-Rezazadeh, I. Neural connectivity in epilepsy as measured by Granger causality [J]. Front. Hum. Neurosci.9 (1), 194 (2015). [DOI] [PMC free article] [PubMed]
- 24.Schouten, H. F., Fischer, D. G. & Visser, T. D. Collapse and revival of spatial coherence on free-space propagation [J]. Opt. Commun.505 (1), 127511 (2022).
- 25.Behrendt, S. et al. RTransferEntropy - quantifying information flow between different time series using effective transfer entropy [J]. Softwarex10 (1), 100265 (2019).
- 26.Qi, C., Li, J. C. & Li, H. G. An attention transfer entropy based causality analysis with applications in rooting short-term disturbances for chemical processes [J]. ISA Trans.136 (1), 284–296 (2023). [DOI] [PubMed]
- 27.Sun, J. et al. Exploring the Propagation Pathway in Individual Patients with Epilepsy: A Stepwise Effective Connection Approach [J]90 (Biomedical Signal Processing and Control, 2024).
- 28.Sun, J. et al. Seizure pathways changes at the subject-specific level via dynamic step effective network analysis [J]. IEEE Trans. Neural Syst. Rehabilitation Eng.32 (1), 1324–1332 (2024). [DOI] [PubMed]
- 29.Strohmann, T., Siemon, D., Robra-Bissantz, S. & brAInstorm Intelligent Assistance in Group Idea Generation; proceedings of the 12th International Conference on Design Science Research in Information Systems and Technology (DESRIST), Karlsruhe, GERMANY, F May 30-Jun 01, 2017 [C]. (2017).
- 30.Jirsa, V. K. et al. On the nature of seizure dynamics [J]. Brain J. Neurol.8 (1), 2210–2230 (2014). [DOI] [PMC free article] [PubMed]
- 31.Creaser, J. et al. Domino-like transient dynamics at seizure onset in epilepsy [J]. PLoS Comput. Biol.16 (9), 1008206 (2020). [DOI] [PMC free article] [PubMed]
- 32.Courtiol, J. et al. Dynamical mechanisms of interictal resting-state functional connectivity in Epilepsy [J]. J. Neurosci.40 (29), 5572–5588 (2020). [DOI] [PMC free article] [PubMed] [Google Scholar]
- 33.Astolfi, L. et al. Comparison of different cortical connectivity estimators for high-resolution EEG recordings [J]. Hum. Brain. Mapp.28 (2), 143–157 (2007). [DOI] [PMC free article] [PubMed] [Google Scholar]
- 34.Fasoula, A., Attal, Y. & Schwartz, D. Comparative performance evaluation of data-driven causality measures applied to brain networks [J]. J. Neurosci. Methods. 215 (2), 170–189 (2013). [DOI] [PubMed] [Google Scholar]
- 35.Nakajima, K., Schmidt, N. & Feifer, R. P. Measuring Information Transfer in a soft Robotic arm [J]10 (Bioinspiration & Biomimetics, 2015). 3. [DOI] [PubMed]
- 36.Zheng, H. U. Generalized synchronization versus phase synchronization [J]. Phys. Rev. E, statistical physics, plasmas, fluids, and related interdisciplinary topics, 62 (6 Pt A), 7882–7885 (2000). [DOI] [PubMed]
- 37.Zhang, H. et al. Distributed synchronization based on model-free reinforcement learning in wireless ad hoc networks [J]. Comput. Netw.227 (1), 1–20 (2023).
- 38.Yu, G. H. & Qu, H. More on Spectral Analysis of Signed Networks [J]. Complexity, (2018).
- 39.Tuna, S. E. Harmonic synchronization under all three types of coupling: position, velocity, and acceleration [J]. Automatica130 (1), 1–20 (2021).
- 40.Khambhati, A. N. et al. Virtual cortical resection reveals push-pull network control preceding seizure evolution [J]. Neuron91 (5), 1170–1182 (2016). [DOI] [PMC free article] [PubMed]
- 41.Lopes, M. A., Goodfellow, M., Terry, J. R. A. & Model-Based Assessment of the Seizure Onset Zone Predictive Power to inform the Epileptogenic Zone [J]. Front. Comput. Neurosci.13 (1), 1–20 (2019). [DOI] [PMC free article] [PubMed]
- 42.An, S. et al. Optimization of surgical intervention outside the epileptogenic zone in the virtual epileptic patient (VEP) [J]. PLoS Comput. Biol.15 (6), 1–20 (2019). [DOI] [PMC free article] [PubMed]
- 43.Jha, J. et al. Fully Bayesian Estimation of Virtual Brain Parameters with self-tuning Hamiltonian Monte Carlo [J]3 (Machine Learning-Science and Technology, 2022). 3.
- 44.Makhalova, J. et al. Virtual epileptic patient brain modeling: relationships with seizure onset and surgical outcome [J]. Epilepsia. 63 (8), 1942–1955 (2022). [DOI] [PMC free article] [PubMed] [Google Scholar]
- 45.Jirsa, V. K. et al. The virtual epileptic patient: individualized whole-brain models of epilepsy spread [J]. Neuroimage145 (1), 377 – 88 (2017). [DOI] [PubMed]
- 46.Kalitzin, S. N., Velis, D. N. & Da Silva, F. H. L. Stimulation-based anticipation and control of state transitions in the epileptic brain [J]. Epilepsy Behav.17 (3), 310–323 (2010). [DOI] [PubMed] [Google Scholar]
- 47.Sinha, N. et al. Predicting neurosurgical outcomes in focal epilepsy patients using computational modelling [J]. Brain. 140 (2), 319–332 (2017). [DOI] [PMC free article] [PubMed] [Google Scholar]
- 48.Goodfellow, M. et al. Estimation of brain network ictogenicity predicts outcome from epilepsy surgery [J]. Sci. Rep.6 (1), 1–20 (2016). [DOI] [PMC free article] [PubMed]
- 49.Goodfellow, M. et al. Computer models to inform epilepsy surgery strategies: prediction of postoperative outcome [J]. Brain140 (5), 1–20 (2017). [DOI] [PMC free article] [PubMed]
- 50.Rijal, S. et al. Functional connectivity discriminates epileptogenic states and predicts surgical outcome in children with drug resistant epilepsy [J]. Sci. Rep.13 (1), 1–20 (2023). [DOI] [PMC free article] [PubMed]
- 51.Kini, L. G. et al. vol 142, pg 3892,. Virtual resection predicts surgical outcome for drug-resistant epilepsy [J]. Brain, 2020, 143. (2019). [DOI] [PMC free article] [PubMed]
- 52.Baldassano, S. et al. Cloud computing for seizure detection in implanted neural devices [J]. J. Neural Eng.16 (2), 1–20 (2019). [DOI] [PMC free article] [PubMed]
Associated Data
This section collects any data citations, data availability statements, or supplementary materials included in this article.
Supplementary Materials
Data Availability Statement
Sequence data that support the findings of this study have been deposited in the Hospital of the University of Pennsylvania on the public website (https://openneuro.org/).


