Abstract
Background
Chronic Kidney Disease (CKD) is characterized by a methionine-related metabolic disorder involving reduced plasma levels of hydrogen sulfide (H2S) and increased lanthionine. The gut microbiota influences methionine metabolism, potentially impacting sulfur metabolite dysfunctions in CKD. We evaluated whether gut microbiota dysbiosis contributes to H2S and lanthionine metabolic alterations in CKD.
Methods
The gut microbiota of 88 CKD patients (non-dialysis, hemodialysis, and transplant patients) and 26 healthy controls were profiled using 16 S-amplicon sequencing. H2S and lanthionine concentrations were measured in serum and fecal samples using the methylene blue method and LC-MS/MS, respectively.
Results
The CKD population exhibited a tenfold increase in serum lanthionine associated with kidney dysfunction. Despite lanthionine retention, hemodialysis and transplant patients had significantly lower serum H2S than healthy controls. Fecal H2S levels were not altered or related to bloodstream H2S concentrations. Conversely, fecal lanthionine was significantly increased in CKD compared to healthy controls and associated with kidney dysfunction. Microbiota composition varied among CKD groups and healthy controls, with the greatest dissimilarity observed between hemodialysis and transplant patients. Changes relative to the healthy group included uneven Ruminococcus gnavus distribution (higher in transplant patients and lower in non-dialysis CKD patients), reduced abundance of the short-chain fatty acid-producing bacteria Alistipes indistinctus and Coprococcus eutactus among transplant patients, and depleted Streptococcus salivarius in non-dialysis CKD patients. A higher abundance of Methanobrevibacter smithii, Christensenella minuta, and Negativibacillus massiliensis differentiated hemodialysis patients from controls. No correlation was found between differentially abundant species and the metabolic profile that could account for the H2S and lanthionine alterations observed.
Conclusions
The metabolic deregulation of H2S and lanthionine observed in the study was not associated with alterations in the gut microbiota composition in CKD patients. Further research on microbial sulfur pathways may provide a better understanding of the role of gut microbiota in maintaining H2S and lanthionine homeostasis.
Supplementary Information
The online version contains supplementary material available at 10.1186/s12866-024-03590-0.
Keywords: Chronic kidney disease, Hemodialysis, Kidney transplant, Gut microbiota, Dysbiosis, Hydrogen sulfide (H2S), Lanthionine
Background
Chronic Kidney Disease (CKD) has emerged as one of the leading causes of mortality worldwide, affecting over 10% of the general population [1]. CKD is characterized by a progressive decline in kidney function, resulting in the accumulation of uremic retention molecules in the bloodstream. Uremia eventually leads to a complex systemic metabolic disorder, altered signaling events throughout the body, and gut microbiota dysbiosis [2, 3].
Metabolic alterations in methionine-derived sulfur compounds include hyperhomocysteinemia and reduced plasma hydrogen sulfide (H2S), which are linked to higher cardiovascular risk in CKD patients. H2S is a gasotransmitter with anti-inflammatory and antioxidant properties involved in blood pressure regulation [4]. It is endogenously produced by the transsulfuration enzymes cystathionine-β-synthase (CBS) and cystathionine-γ-lyase (CSE) with the generation of the non-proteogenic amino acid lanthionine as a metabolic byproduct [4, 5]. Contrary to H2S, lanthionine is increased in the circulation of patients with end-stage kidney disease and has been proposed as a novel uremic toxin that likely contributes to hyperhomocysteinemia and impaired H2S biosynthesis [6, 7]. Lanthionine retention may also be linked to adverse cardiovascular outcomes as it can induce heart tissue fibrosis and promote vascular calcification [8, 9]. While the downregulation of CBS and CSE in blood mononuclear cells has been implicated as a cause of H2S and lanthionine alterations in kidney dysfunction, it remains unclear whether additional factors contribute to this metabolic deregulation in CKD [5, 7, 10, 11].
A previous study comparing H2S plasma levels from conventional and germ-free mice observed free H2S and bound sulfane sulfur concentrations markedly lower in the absence of intestinal microbiota, suggesting that the circulating H2S partially originates from microbial metabolic activity [12]. Gut bacteria produce about 50% of intestinal H2S from dietary and endogenous compounds such as cysteine and inorganic sulfate through cysteine desulfhydrase activity and dissimilatory sulfate reduction, respectively [13, 14]. Recently, 142 bacterial genera were identified to harbor genes for microbial sulfur metabolism, with the majority involved in organic metabolic pathways [15]. Lanthionine is also produced by bacterial activity as part of the posttranslational modifications of lantibiotics [16, 17] and as a structural component of the peptidoglycan cell wall of Fusobacterium species, in particular Fusobacterium nucleatum, Fusobacterium necrophorum, Fusobacterium russi, and Fusobacterium gonidiaformans [18, 19]. Due to gut dysbiosis, several H2S- and lanthionine-producing bacteria are altered in CKD. This dysbiosis is generally characterized by an increased abundance of Desulfovibrio, Enterobacter, Escherichia/Shigella, Flavonifractor, Fusobacterium, Ruminococcus, Streptococcus, while a decreased abundance of Coprococcus, Eubacterium, Faecalibacterium, Prevotella, and Roseburia [20–25]. Given these bacteria’ sulfidogenic capacity, we evaluated whether gut microbiota dysbiosis contributes to metabolic alterations of H2S and lanthionine in CKD patients.
Methods
Study cohort
Eighty-eight CKD patients stratified as non-dialysis (CKD, n = 24), hemodialysis (HD, n = 22), and transplant patients (Tx, n = 42), as well as 26 healthy controls (HC), were enrolled at the University Hospital Luigi Vanvitelli, Italy. The following exclusion criteria were considered: active infection based on elevated C-Reactive protein (CRP > 10 mg/dL), inflammatory bowel disease, malignancy, the occurrence of cardiovascular event(s) in the past three months, poorly controlled diabetes, vascular access complications for hemodialysis patients, use of antibiotics and probiotics in the past three months, pregnancy, and age under 18 years. Each participant provided a fecal and blood sample during their outpatient visit or hospital admission. Feces were collected from a single bowel movement, delivered on ice within 24 h upon collection, aliquoted, and stored at -800C until further analyses.
Blood was withdrawn by venipuncture using BD Vacutainer SST II Advance Tubes. The serum was immediately collected through centrifugation (3000 x g for 10 min) and stored at -800C until further use. Blood samples from hemodialysis patients were drawn before the mid-week dialysis session.
Transplant patients had end-stage kidney disease (ESKD) prior to kidney transplantation, and their samples were collected after 1–20 years of graft function and the initiation of immunosuppressive therapy. Demographic and clinical parameters were retrieved from the subjects’ medical records. Additionally, each participant completed a questionnaire covering lifestyle, bowel habits, and weekly dietary intake over the six months preceding the sample collection. In particular, participants selected the food items they regularly consumed over the six months preceding the sample collection from a list of items typically found in Italian diets. These items were categorized into food groups: eggs, fish and seafood, lean meats, lean poultry, fruits, nuts and seeds, coffee and tea, and alcoholic beverages. This metadata was pseudonymously stored in a database for subsequent statistical analyses.
Lanthionine quantification: liquid chromatography with tandem mass spectrometry (LC-MS/MS)
Serum concentrations of lanthionine were quantified as outlined previously [6, 26]. Two cycles of protein precipitation were applied to 100 mg of feces to determine fecal concentrations. Samples were treated with 300 µL of methanol (Sigma-Aldrich, USA). The mixture was incubated at -200C for 30 min, followed by sonication for 1 min at 200C, and incubated on ice for 2 min. The mixture was then centrifuged at 13,000 x g for 10 min. The supernatants from both extraction cycles were combined to ensure maximum lanthionine recovery. One µL of the serum and fecal supernatants was transferred into the HPLC autosampler and analyzed in an LC-MS/MS assay. Samples were run in duplicate using a 6420 triple Q system with an HPLC 1100 series binary pump (Agilent, Germany). Sample separation was performed with Kinetex 5 μm 100 A C18 analytical column (Phenomenex, USA). The mobile phase was generated by mixing eluent A (2% acetonitrile, 0.1% formic acid) and eluent B (95% acetonitrile and 0.1% formic acid) with a 0.200 mL/min flow rate. The chromatographic gradient started at 5–95% eluent A in 8 min and then increased to 100% for 2 min. Tandem mass spectrometry was performed using a turbo ion spray source operated in positive mode and set to multiple reaction monitoring (MRM) mode. A standard solution of 500 pg/µL of lanthionine was used to optimize the MRM transition, and the optimal conditions for detection were determined via Agilent MassHunter Optimizer software. Lanthionine concentrations were calculated against a standard calibration curve, constructed by plotting peak areas against concentration with a linear trend from 0.5 to 150 pg/µL, r2 = 0.99. Fecal concentrations were normalized by dry weight after vacuum drying a 100 mg-aliquot of each sample (Thermo Savant SC110A SpeedVac, Thermo Fisher Scientific).
Hydrogen sulfide (H2S) quantification
Serum H2S was quantified using the methylene blue method as previously described [6]. For fecal H2S quantification, 100 mg of stool was homogenized into 400 µL of 1X PBS and vortexed thoroughly for 10 min [27]. The homogenates were treated with ZnAc (1%), N, N-dimethyl-p-phenylenediamine (20 mM in HCl 7.2 M), and FeCl3 (30 mM in HCl 1.2 M). After a 20-minute incubation, samples were deproteinized with 700 µL 10% trichloroacetic acid, briefly vortexed, and centrifuged at 13 000 x g for 20 min. Supernatants were measured in duplicates at 670 nm (Thermo SpectronicBiomate 3 UV/VIS Spectrophotometer), and H2S concentrations were calculated against a standard curve obtained with Na2S.9H2O as an H2S donor (Sigma-Aldrich, USA). Fecal concentrations were normalized by dry weight after vacuum drying a 100 mg aliquot of each sample (Thermo Savant SC110A SpeedVac, Thermo Fisher Scientific).
Fecal DNA extraction and 16 S-amplicon sequencing
DNA was extracted from frozen fecal samples (250 mg) using RNeasy Power Microbiome Kit (QIAGEN, no. 26000-50) following the manufacturer’s instructions and excluding DNA removal steps [28]. A heating step at 900C for 10 min was added after vortexing/bead beating to increase the DNA yield [29]. The V3-V4 region of 16 S rRNA genes was sequenced according to Illumina 16 S metagenomics standardized workflow (16 S Metagenomics Sequencing Library Preparation, Part # 15044223 Rev. B). sequencing was performed using the Illumina MiSeq platform, 2 × 300 paired ends, and 600 cycles with the Reagent Kit v3 (no. MS-102-3003, Illumina, USA).
Microbial load: cell count by flow cytometry
The microbial load was determined from frozen fecal samples (200 mg) and used to normalize microbial abundance as previously described [30] (Table S1). Samples were diluted 100,000 times in physiological solution (0.9% NaCl, B. Braun), then filtered using a sterile syringe filter (pore size five µm Millex SV, Merck KGaA) to remove debris. Next, 1 mL of each microbial cell suspension was stained with one µL SYBR Green I (1:100 dilution in dimethylsulfoxide; shaded 15 min incubation at 370C; 10,000 concentrated, Thermo Fisher Scientific). Samples were measured in triplicates using a FACSCanto II Flow Cytometer (BD Biosciences), and the fluorescence events were monitored using the FITC-A and RITC-A optical detectors. Flow rate at 60 µL/min, an acquisition period of 30 s, and a threshold value of 1000 on channel FITC-A were set using the BD FACSDiva Software. A non-stained sample was measured to identify microbial fluorescence events from the sample background. Background events were used to gate the microbial cell counts in FlowJo v10.8.1.
Bioinformatics and statistical analyses
Demultiplexed paired-end reads were denoised using DADA2 pipeline v1.26.0 in R v4.2.2. Raw reads were filtered, normalized by microbial load, and downsized to an even sampling depth as previously described [30]. Amplicon Sequence Variants (ASVs) underwent nucleotide Blast using the NCBI Blast software 2.13.0 and the NCBI 16 S Microbial Database (accessed in December 2022). The ASVs were finally merged into 166 species. Matrices of microbial abundance and metabolite concentrations were normalized, then standardized using QuantileTransformer (output_distribution = “normal” option) and StandardScaler methods from Scikit-learn package v1.3.0 [31]. Alpha diversity measures, including Richness and Shannon Index, were calculated at the species level using Scikit-learn v1.3.0. Beta diversity was computed using the Bray-Curtis dissimilarity measure and represented with Principal Coordinate Analysis (PCoA). Multivariate tests ANOSIM and PERMANOVA were used to assess significance in sample clustering and obtained using 999 permutations as implemented in Scikit-learn v1.3.0. The supervised algorithm of Partial Least Square Discriminant Analysis (PLS-DA) was implemented and visualized with a Variable Importance Plot (VIP) to identify the most discriminant species among CKD patients and healthy groups. The potential contribution of metadata variables to inter-individual microbiota community variation was determined by single distance-based redundancy analysis on species-level Bray–Curtis dissimilarity with the adonis2 function as implemented in the R vegan package v2.6.4 [32]. Variables with FDR ≤ 0.05 were considered significant covariates (Table S2).
Network analyses were performed as previously described [33], and network communities were identified using the Louvain community detection algorithm [34]. The functional profile was predicted using PICRUSt2 [35]. Kruskal-Wallis and Mann-Whitney tests assessed the significance of multiple and pairwise comparisons for microbiota analysis, respectively. Metabolite distributions were analyzed in R v4.2.2 using Kruskal-Wallis and Dunn’s tests for multiple and pairwise comparisons, respectively. A p-value ≤ 0.05 was considered significant for the analyses. The association between microbial abundance and metabolite concentrations was assessed through multivariate Pearson’s correlation (Python v3.8.13) with 10% two-stage Benjamini-Hochberg correction.
Results
The baseline characteristics of the study cohort are outlined in Table 1. CKD patients and healthy controls were matched for gender and body mass index. CKD patient groups exhibited similar age, gender distribution, body mass index, and blood levels of sodium, glucose, and CRP while showing significant variability in other biochemical parameters commonly affected by CKD, including creatinine, urea, hemoglobin, transferrin, albumin, and electrolytes. The prevalent comorbidities included diabetes, hypertension, and cardiovascular diseases. Treatment primarily comprised xanthine oxidase inhibitors, proton-pump inhibitors, vitamin D, statins, and beta-blockers, with the most common immunosuppressants among transplant recipients being prednisone, mycophenolate mofetil, and tacrolimus.
Table 1.
Cohort baselines
| CKD (n = 24) | HD (n = 22) | Tx (n = 42) | HC (n = 26) | p-value | |
|---|---|---|---|---|---|
| General | |||||
| Age (mean (SD)) | 62.71 (16.64) | 57.59 (12.91) | 53.17 (13.03) | 46.62 (18.20) | 0.002a |
| Gender = M (%) | 14 (58.3) | 13 ( 59.1) | 22 (52.4) | 14 (53.8) | 0.944 |
|
Health parameters BMI (kg/m2) (median [IQR]) |
28.03 [25.59, 32.72] | 25.76 [22.18, 28.30] | 25.06 [22.61, 28.30] | 24.95 [22.31, 27.56] | 0.109 |
| eGFR (mean (SD)) | 29.63 (15.62) | 13.42 (7.36) | 52.01 (22.11) | 83.44 (13.48) | < 0.001 |
|
Blood parameters Creatinine (mg/dL) (median [IQR]) |
2.35 [1.53, 3.12] | 4.74 [3.15, 6.69] | 1.19 [1.02, 1.79] | 0.90 [0.80, 0.98] | < 0.001 |
| Urea (mg/dL) (median [IQR]) | 89.50 [55.25, 124.50] | 49.50 [30.75, 87.00] | 57.00 [41.25, 84.75] | 36.00 [31.50, 43.50] | < 0.001 |
| Uric acid (mg/dL) (mean (SD)) | 6.50 (1.98) | 5.90 (1.28) | 5.82 (1.27) | 5.00 (0.94) | 0.007b |
| Albumin (g/dL) (median [IQR]) | 3.70 [3.52, 3.88] | 3.90 [3.65, 3.95] | 4.20 [4.10, 4.40] | 4.20 [3.88, 4.60] | < 0.001 |
| Na (mEq/L) (median [IQR]) | 139.00 [135.25, 140.75] | 138.50 [136.00, 140.00] | 140.00 [139.00, 141.00] | 140.00 [140.00, 140.25] | 0.062 |
| K (mEq/L) (median [IQR]) | 4.60 [4.20, 4.90] | 5.00 [4.50, 5.18] | 4.50 [4.03, 4.68] | 4.05 [4.00, 4.50] | 0.002c |
| Ca (mg/dL) (mean (SD)) | 9.09 (0.80) | 8.95 (1.00) | 9.79 (0.53) | 9.18 (0.49) | < 0.001 |
| P (mg/dL) (median [IQR]) | 3.60 [3.30, 4.25] | 6.30 [5.43, 7.20] | 3.10 [2.80, 3.50] | 3.40 [3.05, 3.65] | < 0.001 |
| Glucose (mg/dL) (median [IQR]) | 81.00 [75.00, 86.00] | 88.00 [79.00, 98.00] | 81.50 [74.00, 93.50] | 87.50 [80.50, 92.50] | 0.139 |
| CRP (mg/dL) (median [IQR]) | 0.23 [0.07, 0.50] | 0.45 [0.37, 0.53] | 0.25 [0.12, 0.38] | 0.30 [0.12, 0.40] | 0.078 |
| CKD stage (%) | |||||
| CKD1 | 0 ( 0.0) | 0 ( 0.0) | 2 ( 4.8) | 0 ( 0.0) | |
| CKD2 | 0 ( 0.0) | 0 ( 0.0) | 10 (23.8) | 0 ( 0.0) | |
| CKD3 | 11 (45.8) | 0 ( 0.0) | 21 (50.0) | 0 ( 0.0) | |
| CKD4 | 8 (33.3) | 0 ( 0.0) | 7 (16.7) | 0 ( 0.0) | |
| CKD5 | 5 (20.8) | 22 (100.0) | 2 ( 4.8) | 0 ( 0.0) | |
| Prevalent comorbidities | |||||
| Diabetes = Yes (%) | 6 (25.0) | 5 ( 22.7) | 6 (14.3) | 0 ( 0.0) | 0.056 |
| Hypertension = Yes (%) | 8 (33.3) | 1 ( 4.5) | 0 ( 0.0) | 4 (15.4) | < 0.001 |
| Cardiovascular disease = Yes (%) | 4 (16.7) | 2 ( 9.1) | 5 (11.9) | 0 ( 0.0) | 0.223 |
| Main drug therapy | |||||
| Xanthine oxidase inhibitor = Yes (%) | 14 (58.3) | 10 ( 45.5) | 18 (42.9) | 0 ( 0.0) | < 0.001 |
| Proton pump inhibitor = Yes (%) | 12 (50.0) | 10 ( 45.5) | 15 (35.7) | 0 ( 0.0) | < 0.001 |
| Vitamin B = Yes (%) | 1 ( 4.2) | 7 ( 31.8) | 13 (31.0) | 1 ( 3.8) | 0.004 |
| Vitamin D = Yes (%) | 15 (62.5) | 7 ( 31.8) | 27 (64.3) | 1 ( 3.8) | < 0.001 |
| Statins = Yes (%) | 7 (29.2) | 4 ( 18.2) | 19 (45.2) | 0 ( 0.0) | < 0.001 |
| Beta-blockers = Yes (%) | 7 (29.2) | 2 ( 9.1) | 9 (21.4) | 0 ( 0.0) | 0.020 |
| Insulin = Yes (%) | 6 (25.0) | 5 ( 22.7) | 6 (14.3) | 0 ( 0.0) | 0.056 |
| Main immunosuppressants | |||||
| Prednisone = Yes (%) | 0 ( 0.0) | 0 ( 0.0) | 34 (81.0) | 0 ( 0.0) | < 0.001 |
| MMF = Yes (%) | 0 ( 0.0) | 0 ( 0.0) | 26 (61.9) | 0 ( 0.0) | < 0.001 |
| TAC = Yes (%) | 0 ( 0.0) | 0 ( 0.0) | 27 (64.3) | 0 ( 0.0) | < 0.001 |
aCKD vs. HC (Games-Howell test, p = 0.011); bCKD vs. HC (p = 0.02), Tx vs. HC (p = 0.03); cCKD vs. HC (p = 0.04), HD vs. HC (p = 0.05)
CKD: non-dialysis Chronic Kidney Disease; HD: Hemodialysis; Tx: Kidney transplant; HC: Healthy Controls; BMI: Body Mass Index; CRP: C-Reactive Protein; eGFR: estimated Glomerular Filtration Rate; MMF: Mycophenolate mofetil; TAC: Tacrolimus
Increased levels of circulating and fecal lanthionine are related to kidney dysfunction
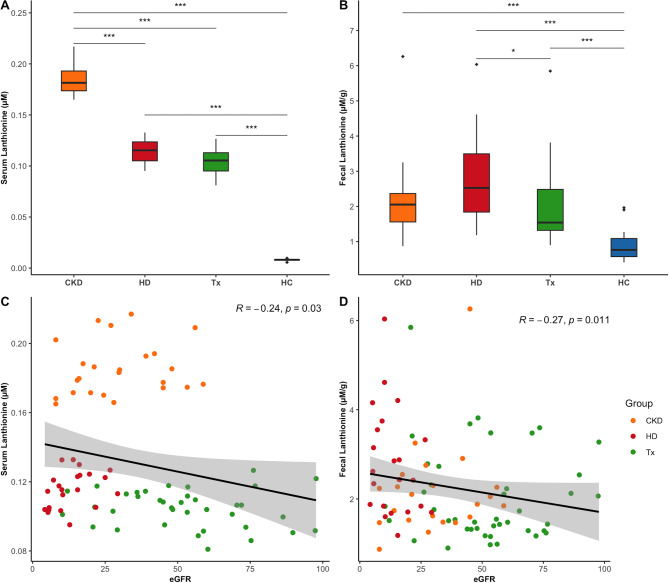
Serum lanthionine concentrations were increased tenfold in the CKD population compared to healthy controls. The undergoing treatment influenced lanthionine retention, with non-dialysis CKD patients exhibiting the highest levels, followed by hemodialysis and transplant patients (Fig. 1A, Table S3). The significant positive correlation with markers of kidney function, including creatinine, urea, and uric acid blood levels (Fig S1), along with the negative correlation with eGFR (Fig. 1C), indicated that lanthionine accumulation in the bloodstream of CKD patients is influenced by kidney dysfunction. Fecal concentrations were also significantly increased in each patient group compared to healthy controls (Fig. 1B, Table S3). This increase was negatively associated with eGFR (Fig. 1D) and positively correlated with blood levels of CKD markers, such as creatinine, urea, and uric acid (Fig S1). Moreover, fecal levels were mildly correlated with serum lanthionine across the entire cohort, though this correlation was not significant when focusing solely on the CKD population (Fig S1).
Fig. 1.
Distribution of serum and fecal lanthionine levels in CKD patients and healthy controls, and their correlation with kidney function. (A) Serum lanthionine levels (Kruskal-Wallis, p < 2.2e-16); (B) Fecal lanthionine levels (Kruskal-Wallis, p = 3.3e-11); (C) Spearman’s correlation between serum lanthionine levels and eGFR; (D) Spearman’s correlation between fecal lanthionine levels and eGFR. Dunn’s post hoc test was applied for pairwise group comparisons (***p ≤ 0.001, *p ≤ 0.05 after Benjamini-Hochberg correction). CKD (non-dialysis Chronic Kidney Disease), HD (Hemodialysis), Tx (Kidney Transplant), HC (Healthy Controls), and eGFR (estimated Glomerular Filtration Rate).
H2S is decreased in the circulation of patients receiving kidney replacement therapy, while the fecal content is unaltered
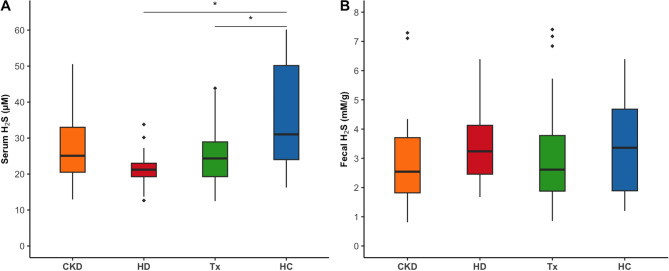
Circulating levels of H2S were significantly reduced in hemodialysis and transplant patients compared to healthy controls (Fig. 2A, Table S3) and inversely associated with both circulating and intestinal levels of lanthionine (Fig S1). No differences in fecal levels of H2S were observed between CKD patients and healthy controls (Fig. 2B, Table S3), nor were fecal and serum concentrations of H2S associated (Fig S1).
Fig. 2.
Distribution of serum and fecal H2S levels in CKD patients and healthy controls. (A) Serum H2S (p = 0.002); (B) Fecal H2S (p = 0.37). Dunn’s post hoc test was applied for pairwise comparisons (* p ≤ 0.05 after Benjamini-Hochberg correction). CKD: non-dialysis Chronic Kidney Disease, HD: Hemodialysis, Tx: Kidney transplant, HC: Healthy Controls.
Gut microbiota dysbiosis in CKD
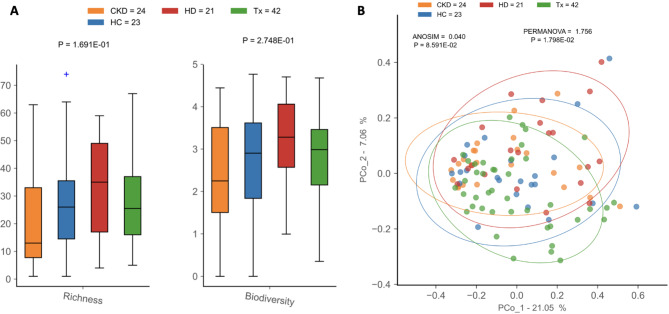
Alpha diversity measures were not significantly different among patient groups or compared to healthy controls (Fig. 3A, Table S4). However, hemodialysis and transplant patients had lower microbial load than healthy controls, indicating a decrease in the overall bacterial abundance of these patients (Fig S2). Beta diversity analysis revealed differences in microbial composition between patients and healthy controls (PERMANOVA, p = 1.8e-02). Such differences were not detected by ANOSIM, which showed higher dissimilarity among samples within the same group than between samples from different patient groups (p = 8.6e-02) (Fig. 3B).
Fig. 3.
Diversity analysis of gut microbiota in CKD patients and healthy controls. (A) Alpha (within-sample) diversity and (B) beta (between-sample) diversity of CKD: non-dialysis Chronic Kidney Disease, HD: Hemodialysis, Tx: Kidney transplant patients, and HC: Healthy Controls.
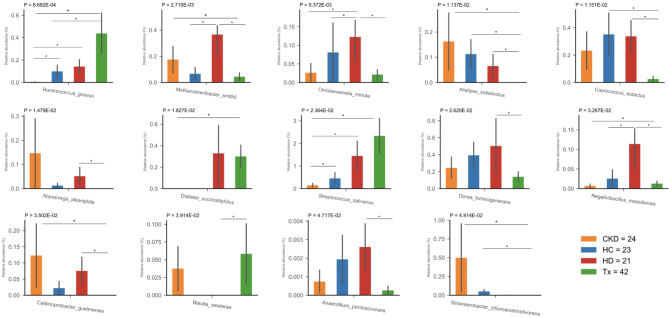
The differential analysis revealed distinct microbial compositions between CKD patients and healthy individuals, regardless of treatment. Specifically, nine bacterial species were unique to the CKD population: Acidaminococcus intestini, Anaerotruncus rubiinfantis, Clostridium perfringens, Megasphaera massiliensis, Streptococcus anginosus, Streptococcus koreensis, Streptococcus lutetiensis, Streptococcus vestibularis, and Variimorphobacter saccharofermentans (Table S5). Fourteen species were differentially abundant among the groups studied. Compared to healthy individuals, CKD patients showed uneven distributions of Ruminococcus gnavus, which was higher in transplant patients and lower in non-dialysis CKD patients. Additionally, transplant patients exhibited a depletion in short-chain fatty acid (SCFA) bacteria, such as Alistipes indistinctus and Coprococcus eutactus, whereas hemodialysis patients had a higher abundance of Methanobrevibacter smithii, Christensenella minuta, and Negativibacillus massiliensis (Fig. 4, Table S5).
Fig. 4.
Differential abundance analysis among CKD patients and healthy controls. Multiple comparison analyses depicted significant differences in the abundance of 14 species across the study groups. Species abundance was normalized by microbial load. Each abundance barplot shows the p-value from the Kruskal-Wallis test and Mann–Whitney U pairwise comparison (non-FDR, * p ≤ 0.05).
Non-dialysis CKD patients had a decreased abundance of Streptococcus salivarius compared to healthy controls, hemodialysis, and transplant patients. They also exhibited significantly lower levels of R. gnavus and N. massiliensis, along with depleted Dialister succinatiphilus and enriched M. smithii, A. indistinctus, and Caldicoprobacter guelmensis compared to transplant patients. Additionally, R. gnavus and C. minuta were significantly less abundant in non-dialysis CKD patients compared to hemodialysis patients (Fig. 4, Table S5).
The microbial communities of hemodialysis and transplant patients showed the highest dissimilarity, with ten species differentially abundant between them. Hemodialysis patients had higher levels of M. smithii, C. minuta, A. indistinctus, C. eutactus, Dorea formicigenerans, N. massiliensis, C. guelmensis, and Anaerofilum pentosovorans, while Blautia wexlerae was more abundant in transplant patients (Fig. 4, Table S5). Notably, most differences in microbial abundance among the treatment groups were not observed after 5% FDR correction, except for the abundance of R. gnavus significantly higher in transplant patients than in non-dialysis CKD patients (Table S5).
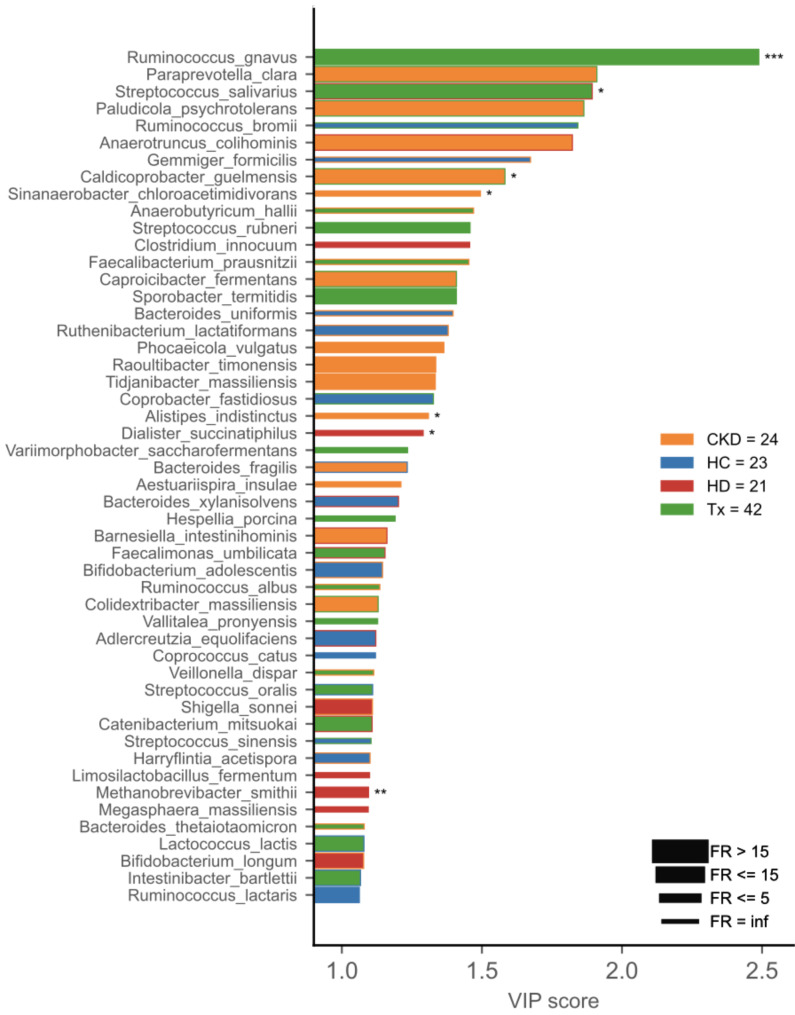
PLS-DA identified seven differentially abundant species as discriminant markers for the patient groups, including R. gnavus and S. salivarius as markers for transplant patients, C. guelmensis for non-dialysis CKD, and M. smithii as a marker for hemodialysis patients (Fig. 5). The covariate analysis showed that differences in dietary habits and sustained immunosuppressive therapy explained about 3% of the observed variations in the microbial populations among the study participants (Fig S4, Table S2).
Fig. 5.
Variable Importance Plot (VIP) shows (i) discriminant species after PLS-DA in descending order of VIP score (bar length); (ii) the cohort group with the highest (central bar color) and the lowest (edge bar color) species abundance; (iii) fold ratio (FR) of the highest vs. the lowest species abundance (bar thickness), and (iv) significant difference after Mann–Whitney U test (non-FDR, ***p ≤ 0.001, **p ≤ 0.01, *p ≤ 0.05).
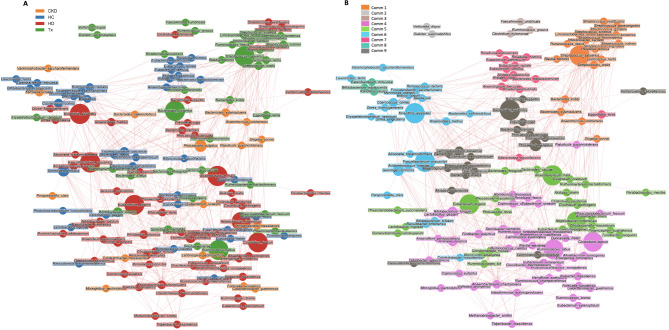
We conducted a network analysis to uncover microbial communities associated with different CKD groups (Fig. 6). Nine communities were retrieved; communities 1, 2, and 3 harbored most species with higher prevalence in transplant patients (17/25, 68%), including R. gnavus and S. salivarius, previously identified as markers for this group. Hemodialysis-related species were most prevalent in communities 4 and 5 (36/66, 55%), while healthy control-related species, such as A. indistinctus, were mainly found in community 7 (9/12, 75%) (Fig. 6B). Considering the network analysis, A. indistinctus is not a reliable biomarker for non-dialysis CKD patients, given its higher prevalence in the healthy group. Similarly, D. succinatiphilus was identified as a transplant-related species in the network analysis, highlighting it as a non-reliable marker for hemodialysis patients as previously identified through PLS-DA (Fig. 6A).
Fig. 6.
Network analysis shows clusters of microbial species and positive or negative correlations of their abundances. (A) Nodes (representing species) were colored according to the patient group in which species had the highest mean abundance. (B) Nodes were colored according to the detected communities using the Louvain algorithm. Node size is directly proportional to the centrality of the species within the overall network. Edge thickness is inversely proportional to the Pearson p-value (10% Benjamini–Hochberg two-stages FDR), and it is colored according to the positive (red) or negative (blue) Pearson’s coefficient. CKD: non-dialysis Chronic Kidney Disease, HD: Hemodialysis, Tx: Kidney transplant), HC: Healthy Controls, Comm: community.
Gut bacteria associated with circulating and intestinal levels of lanthionine and H2S in CKD
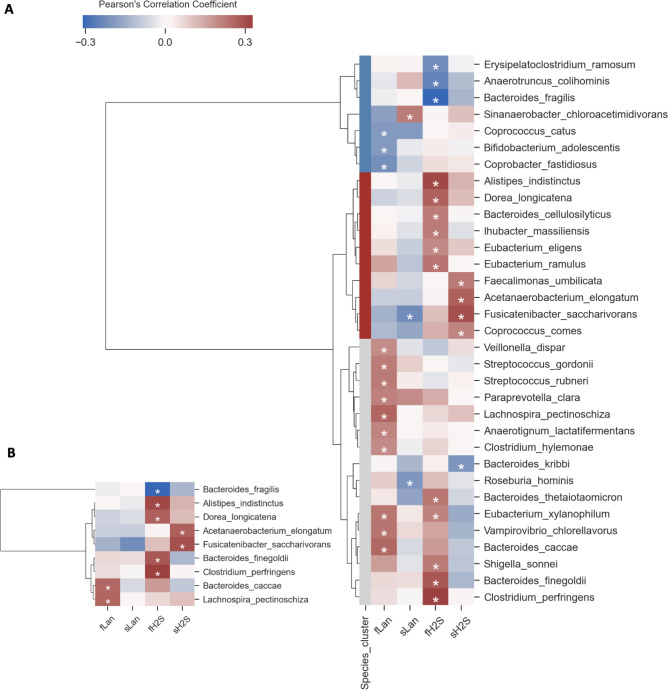
Multivariate Pearson correlation revealed 33 bacterial species significantly correlated with metabolite concentrations and organized into three clusters by Hierarchical Clustering Analysis (HCA) (Fig. 7A). The red cluster mainly consisted of potential beneficial species as they were positively associated with serum and fecal levels of H2S. This cluster included previously identified healthy control-related species in the network analysis, such as A. indistinctus, Fusicatenibacter saccharivorans, and Coprococcus comes. Nine bacterial species remained correlated with the metabolites’ concentrations after FDR, including Acetanaerobacterium elongatum and F. saccharivorans, positively associated with serum levels of H2S and Bacteroides caccae and Lachnospira pectinoschiza, positively related to fecal levels of lanthionine (Fig. 7B).
Fig. 7.
Correlogram of bacterial species and sulfur metabolites shows positive or negative Pearson’s correlation on normalized and standardized abundances and metabolite concentrations. Only species having at least one significant correlation with sulfur metabolites were reported. (A) A p-value ≤ 0.05 with no FDR correction was considered significant to highlight all significant correlations. Hierarchical Clustering Analysis (HCA) (metric = “Bray-Curtis”, method = “complete linkage”) was applied to identify clusters of correlated species shown as blue, red, and light gray. (B) Significant correlations after 10% two-stage Benjamini-Hochberg correction of p-values. fLan: fecal lanthionine, sLan: serum lanthionine, fH2S: fecal H2S, sH2S: serum H2S.
Bacterial sulfur pathways are not altered in the cohort
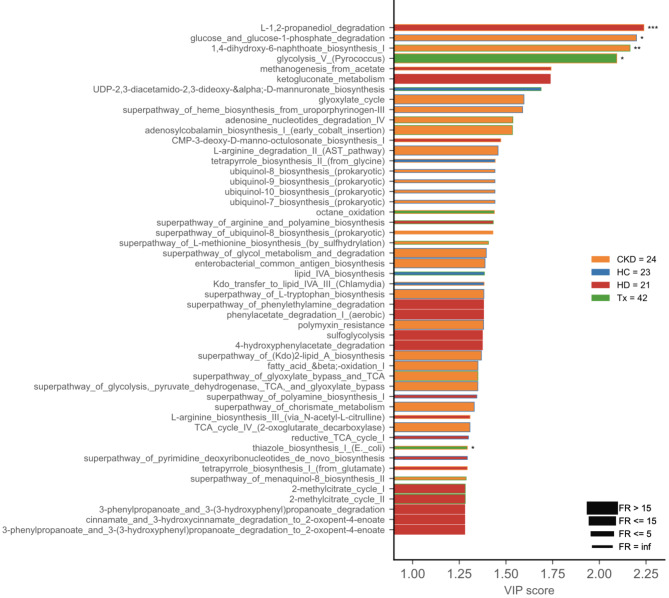
To identify altered metabolic pathways in CKD patients, we performed a PLS-DA analysis and VIP visualization based on KEGG pathways predicted by PICRUSt2. The analysis revealed five pathways with differences in metabolic activity among patient groups. Sulfide-related pathways, such as L-methionine biosynthesis and sulfoglycolysis, were not altered between CKD patients or compared to healthy controls (Fig. 8).
Fig. 8.
Microbial functional profile predicted with PICRUSt2. Variable Importance Plot (VIP) shows (i) discriminant metabolic pathways after PLS-DA in descending order of VIP score (bar length); (ii) the cohort group with the highest (central bar color) and the lowest (edge bar color) activity of a pathway; (iii) fold ratio (FR) of the highest vs. the lowest activity of a pathway (bar thickness), and (iv) significant difference after Mann–Whitney U test (non-FDR, *** p ≤ 0.001, ** p ≤ 0.01, * p ≤ 0.05). CKD: non-dialysis Chronic Kidney Disease, HD: Hemodialysis, Tx: Kidney transplant, HC: Healthy Controls.
Discussion
We assessed whether changes in gut microbial composition contributed to the metabolic disorder of H2S and lanthionine in CKD. The circulating metabolic profile showed increased lanthionine levels associated with decreased H2S compared to healthy individuals. Interestingly, hemodialysis patients had lower lanthionine levels than non-dialysis CKD patients despite a worse kidney function, indicating partial lanthionine removal during hemodialysis. Previous research also reported a significant increase of lanthionine by two orders of magnitude in hemodialysis patients compared to healthy individuals and a 50% reduction in lanthionine after a single dialysis session [6]. In contrast, a later study reported higher serum lanthionine levels in hemodialysis patients than in non-dialysis CKD patients. This discrepancy in findings may be attributed to the patients’ different mix of dialysis modalities (hemodialysis and hemodiafiltration) or filter material composition [36].
Lower plasma H2S has also been reported in uremic conditions associated with reduced expression of CBS and CSE in blood mononuclear cells, increased uremic toxicity, and cardiovascular risk [5, 6, 10]. The accumulation of retention solutes may be partially responsible for the reduced levels of H2S. For instance, indoxyl-sulfate was found to be negatively associated with plasma H2S in CKD patients [5], and lanthionine was observed to inhibit H2S generation by interfering with CBS activity in hepatocarcinoma and endothelial cells at concentrations comparable to those found in uremia [6, 37].
The intestinal bioavailability of H2S was not affected or correlated with the bloodstream profile in CKD, suggesting that H2S synthesis by gut bacteria and endogenous metabolism remains relatively stable and does not directly impact circulating H2S in these patients. Our inferred functional analysis revealed no alterations in bacterial pathways involved in sulfide biosynthesis, further supporting the likelihood of unaltered H2S production by gut bacteria.
Analyzing the gut microbial composition revealed significant differences between CKD patients and healthy controls. R. gnavus showed an uneven distribution compared to healthy controls, with higher levels in transplant patients and lower levels in non-dialysis CKD patients. Additionally, transplant patients exhibited a depletion of SCFA-producing bacteria, including A. indistinctus and C. eutactus. Previous studies have similarly reported a decreased abundance of C. eutactus and Alistipes, along with other SCFA-producing bacteria, such as Roseburia spp. and Faecalibacterium prausnitzii, in transplant patients [38–40]. The lower abundance of these bacteria has been linked to increased inflammatory markers (e.g., CRP) in ESKD, suggesting that the depletion of SCFA-producing bacteria likely contributes to CKD-associated inflammation [21].
We also observed enriched abundances of various species in hemodialysis patients compared to healthy individuals, including C. minuta and M. smithii. In line with our results, previous studies have observed an enriched abundance of Christensenellaceae and its genus Christensenellaceae_R_7_group in hemodialysis patients compared to age, gender, and BMI-matched controls without impaired kidney function (eGFR ≥ 60) [41]. Previous research has proposed that decreased levels of C. eutactus and M. smithii may indicate CKD progression [42]. Our study found a significant reduction in C. eutactus in transplant patients compared to healthy controls, suggesting that such a decrease might serve as a biomarker for CKD progression in transplant patients. However, our findings regarding M. smithii deviated from the previous study [38]. Our cohort showed a significant increase in M. smithii in ESKD patients undergoing maintenance hemodialysis compared to healthy individuals. The enriched M. smithii abundance could contribute to the high prevalence of constipation events frequently reported among these patients, given its association with reduced frequency of bowel movements [43, 44].
The confounder effect of immunosuppressive therapy was reflected in the taxonomic profile of transplant patients, as the enriched abundance of R. gnavus and depleted A. indistinctus correlated with the use of prednisone, tacrolimus, and mycophenolate mofetil (Fig. S3). R. gnavus has been associated with both negative and positive health outcomes. It has been associated with inflammatory bowel disease, colorectal cancer, and metabolic diseases, as well as found enriched in ESKD patients and proposed as a CKD biomarker [23, 25, 45]. However, certain strains of R. gnavus enhance the expression of the antimicrobial peptide Reg3g involved in gut homeostasis, decrease colitis inflammation, and SCFA production. Ultimately, the role of R. gnavus in health and disease is host-dependent and strain-specific, highlighting the importance of studying microbial signatures at the strain level. Variability in microbial abundance is apparent across different taxonomic levels. For instance, while previous studies have shown a decrease in the overall abundance of the genus Ruminococcus in transplant patients [38], our study revealed an increased abundance of R. gnavus as a biomarker for transplant patients. This indicates that genus-level abundance does not always accurately reflect specific species’ abundance.
Among the differentially abundant species identified, M. smithii, C. minuta, A. indistinctus, D. succinatiphilus, and A. pentosovorans are producers of H2S, while R. gnavus, C. eutactus, S. salivarius, and D. formicigenerans are producers of both H2S and lanthionine [15, 46, 47]. These species characterized the dysbiotic microbial profile of the studied cohort, and its association with the deranged sulfur metabolic profile would suggest a potential contribution of microbial dysbiosis to the observed metabolic deregulation. However, none of the sulfidogenic bacteria were significantly associated with H2S and lanthionine concentrations, implying that factors other than gut microbiota dysbiosis (e.g., uremic toxicity) are the source of these metabolic alterations. We should acknowledge that 16 S amplicon sequencing does not directly provide information about functional repertoires associated with H2S/lanthionine metabolic deregulation. Therefore, the possibility of a functional association that may exist but was not captured at the compositional level cannot be completely ruled out. Further research assessing sulfur pathways of the gut microbiota, along with in vitro and in vivo studies, may provide a deeper understanding of this relationship.
Additional limitations of our study include the confounding effects of varying dietary habits and the administration of immunosuppressants among transplant patients, which influenced the observed microbial variation. Furthermore, genetic information was unavailable and, therefore, not assessed as a potential confounder of the gut microbiota. The mean ages between the non-dialysis CKD patients and control groups were not matched, potentially introducing variability in the results. However, it is worth noting that age was not identified as a significant covariate of microbial variability in this population (Table S2). Additionally, we did not measure H2S and lanthionine concentrations in the urine, thus limiting the evidence for the association between altered sulfur metabolism and kidney dysfunction.
Conclusions
Our study aimed to elucidate the impact of gut microbiota dysbiosis on the metabolic alterations of H2S and lanthionine levels in CKD patients. We found that decreased H2S and increased lanthionine levels in the bloodstream characterized the dysregulation of these methionine-derived sulfur compounds. The accumulation of lanthionine was associated with kidney dysfunction and uremic toxicity, supporting its emerging role as a novel uremic toxin. Significant alterations in microbial composition were observed among CKD patients and compared to healthy controls. Despite identifying dysbiosis in several sulfidogenic bacteria within the gut microbiota, we did not find a link between these microbial changes and the disrupted metabolism of H2S and lanthionine. Instead, our findings suggest that impaired kidney function and associated uremic toxicity may be the primary drivers of the observed sulfur metabolic disorder in CKD patients. These results highlight the importance of investigating the metabolism of these compounds at a functional level within the sulfur pathways of the gut microbiome to gain deeper insights into their roles in maintaining H2S and lanthionine homeostasis.
Electronic supplementary material
Below is the link to the electronic supplementary material.
Acknowledgements
We thank Raffaella Vigilante and Michele Cavasso for supporting the patients’ enrollment and Luigi Mele for assisting with the flow cytometry measurements.
Abbreviations
- CKD
Chronic Kidney Disease
- H2S
Hydrogen Sulfide
- CBS
Cystathionine-β-synthase
- CSE
Cystathionine-γ-lyase
- HD
Hemodialysis
- Tx
Transplant recipients
- HC
Healthy Controls
- CRP
C-Reactive Protein
- LC-MS/MS
Liquid Chromatography with Tandem Mass Spectrometry
- MRM
Multiple Reaction Monitoring
- ASVs
Amplicon Sequence Variants
- PCoA
Principal Coordinate Analysis
- ANOSIM
Analysis of Similarities
- PERMANOVA
Permutational Multivariate Analysis of Variance
- PLS-DA
Partial Least Square Discriminant Analysis
- VIP
Variable Importance Plot
- FDR
False Discovery Rate
- PICRUSt2
Phylogenetic Investigation of Communities by Reconstruction of Unobserved States
- eGFR
estimated Glomerular Filtration Rate
- HCA
Hierarchical Clustering Analysis
- KEGG
Kyoto Encyclopedia of Genes and Genomes
- SCFA
Short-Chain Fatty Acid
- ESKD
End-Stage Kidney Disease
Author contributions
Y.G.M: concept/design, patients’ enrollment, sample and data collection, sulfur compounds quantification, 16 S amplicon sequencing, bioinformatics and statistical analyses, interpretation, writing original manuscript, manuscript edition, visualization; E.A and A.W: 16 S amplicon sequencing and visualization; V.I: bioinformatics and statistical analyses, interpretation, and visualization; C.Ferravante and G.F: bioinformatics analysis and visualization; M.S and A.A: lanthionine quantification and visualization; M.B, D.I, F.T, and A.F.P: concept/design, analysis, interpretation, manuscript edition, visualization, and supervision. All authors read and approved the final manuscript.
Funding
YGM, DI, and AFP are beneficiaries of the project “System Omics to Unravel the Gut-Kidney Axis in Chronic Kidney Disease” (STRATEGY-CKD) funded by the European Union’s Horizon 2020 research and innovation program under grant agreement No [860329]. EA was supported by Fondazione Umberto Veronesi.
Data availability
Sequence data that support the findings of this study have been deposited in the European Nucleotide Archive (https://www.ebi.ac.uk/ena/browser/home) with the primary accession code PRJEB67373. The manuscript and supplementary information files provide all relevant data generated or analyzed during this study.
Declarations
Ethics approval and consent to participate
All participants provided written informed consent before participating in the study, and the experimental protocol was approved by the University Hospital Luigi Vanvitelli’s Ethics Committee on January 17, 2020 (Protocol Number AOU 27966/19) under the title “System omics to unravel the gut-kidney axis in Chronic Kidney Disease”. The research followed the Helsinki Declaration as revised in 2013.
Consent for publication
Not applicable.
Competing interests
The authors declare no competing interests.
Footnotes
Publisher’s note
Springer Nature remains neutral with regard to jurisdictional claims in published maps and institutional affiliations.
References
- 1.Kovesdy CP. Epidemiology of chronic kidney disease: an update 2022. Kidney Int Suppl. 2022;12:7. [DOI] [PMC free article] [PubMed] [Google Scholar]
- 2.Evenepoel P, Meijers BKI, Bammens BRM, Verbeke K. Uremic toxins originating from colonic microbial metabolism. Kidney Int. 2009;76:S12–9. [DOI] [PubMed] [Google Scholar]
- 3.Nigam SK, Bush KT. Uremic syndrome of chronic kidney disease: altered remote sensing and signaling. Nat Rev Nephrol. 2019;15:301. [DOI] [PMC free article] [PubMed] [Google Scholar]
- 4.Perna AF, Ingrosso D. Low hydrogen sulphide and chronic kidney disease: a dangerous liaison. Nephrol Dial Transpl. 2012;27:486–93. [DOI] [PubMed] [Google Scholar]
- 5.Kuang Q, Xue N, Chen J, Shen Z, Cui X, Fang Y, et al. Low plasma hydrogen sulfide is Associated with impaired renal function and Cardiac Dysfunction. Am J Nephrol. 2018;47:361–71. [DOI] [PubMed] [Google Scholar]
- 6.Perna AF, Di Nunzio A, Amoresano A, Pane F, Fontanarosa C, Pucci P, et al. Divergent behavior of hydrogen sulfide pools and of the sulfur metabolite lanthionine, a novel uremic toxin, in dialysis patients. Biochimie. 2016;126:97–107. [DOI] [PubMed] [Google Scholar]
- 7.Perna AF, Zacchia M, Trepiccione F, Ingrosso D. The sulfur metabolite lanthionine: evidence for a role as a novel Uremic Toxin. Toxins. 2017;9. [DOI] [PMC free article] [PubMed]
- 8.Perna AF, Anishchenko E, Vigorito C, Zacchia M, Trepiccione F, D’Aniello S, et al. Zebrafish, a novel model system to study uremic toxins: the case for the sulfur amino acid lanthionine. Int J Mol Sci. 2018;19:1–16. [DOI] [PMC free article] [PubMed] [Google Scholar]
- 9.Coppola A, Vigorito C, Lombari P, Martínez YG, Borriello M, Trepiccione F, et al. Uremic Toxin Lanthionine induces endothelial cell mineralization in Vitro. Biomed. 2022;10:444. [DOI] [PMC free article] [PubMed] [Google Scholar]
- 10.Perna AF, Luciano MG, Ingrosso D, Pulzella P, Sepe I, Lanza D, et al. Hydrogen sulphide-generating pathways in haemodialysis patients: a study on relevant metabolites and transcriptional regulation of genes encoding for key enzymes. Nephrol Dial Transplant off Publ Eur Dial Transpl Assoc -. Eur Ren Assoc. 2009;24:3756–63. [DOI] [PubMed] [Google Scholar]
- 11.Aminzadeh MA, Vaziri ND. Downregulation of the renal and hepatic hydrogen sulfide (H2S)-producing enzymes and capacity in chronic kidney disease. Nephrol Dial Transplant off Publ Eur Dial Transpl Assoc -. Eur Ren Assoc. 2012;27:498–504. [DOI] [PubMed] [Google Scholar]
- 12.Shen X, Carlström M, Borniquel S, Jädert C, Kevil CG, Lundberg JO. Microbial regulation of host hydrogen sulfide bioavailability and metabolism. Free Radic Biol Med. 2013;60:195–200. [DOI] [PMC free article] [PubMed] [Google Scholar]
- 13.Flannigan KL, Mccoy KD, Wallace JL. Eukaryotic and prokaryotic contributions to colonic hydrogen sulfide synthesis. Am J Physiol Gastrointest Liver Physiol. 2011;301:188–93. [DOI] [PubMed] [Google Scholar]
- 14.Carbonero F, Benefiel AC, Alizadeh-Ghamsari AH, Gaskins HR. Microbial pathways in colonic sulfur metabolism and links with health and disease. Front Physiol. 2012;3 NOV:448. [DOI] [PMC free article] [PubMed]
- 15.Wolf PG, Cowley ES, Breister A, Matatov S, Lucio L, Polak P et al. Diversity and distribution of sulfur metabolic genes in the human gut microbiome and their association with colorectal cancer. Microbiome. 2022;10. [DOI] [PMC free article] [PubMed]
- 16.McAuliffe O, Ross RP, Hill C. Lantibiotics: structure, biosynthesis and mode of action. FEMS Microbiol Rev. 2001;25:285–308. [DOI] [PubMed] [Google Scholar]
- 17.Willey JM, Van Der Donk WA. Lantibiotics: peptides of diverse structure and function. Annu Rev Microbiol. 2007;61:477–501. [DOI] [PubMed] [Google Scholar]
- 18.Vasstrand EN, Hofstad T, Endresen C, Jensen HB. Demonstration of lanthionine as a natural constituent of the peptidoglycan of Fusobacterium nucleatum. Infect Immun. 1979;25:775. [DOI] [PMC free article] [PubMed] [Google Scholar]
- 19.Vasstrand EN, Jensen HB, Miron T, Hofstad T. Composition of peptidoglycans in Bacteroidaceae: determination and distribution of lanthionine. Infect Immun. 1982;36:114. [DOI] [PMC free article] [PubMed] [Google Scholar]
- 20.Sampaio-Maia B, Simões-Silva L, Pestana M, Araujo R, Soares-Silva IJ. The role of the gut microbiome on chronic kidney disease. Adv Appl Microbiol. 2016;96:65–94. [DOI] [PubMed] [Google Scholar]
- 21.Jiang S, Xie S, Lv D, Zhang Y, Deng J, Zeng L, et al. A reduction in the butyrate producing species Roseburia spp. and Faecalibacterium prausnitzii is associated with chronic kidney disease progression. Antonie Van Leeuwenhoek Int J Gen Mol Microbiol. 2016;109:1389–96. [DOI] [PubMed] [Google Scholar]
- 22.Li FX, Wang MH, Wang JP, Li RS, Zhang YQ. Alterations to the gut microbiota and their correlation with inflammatory factors in chronic kidney disease. Front Cell Infect Microbiol. 2019;9:206. [DOI] [PMC free article] [PubMed] [Google Scholar]
- 23.Lun H, Yang W, Zhao S, Jiang M, Xu M, Liu F, et al. Altered gut microbiota and microbial biomarkers associated with chronic kidney disease. MicrobiologyOpen. 2019;8:1–10. [DOI] [PMC free article] [PubMed] [Google Scholar]
- 24.Hu X, Ouyang S, Xie Y, Gong Z, Du J. Characterizing the gut microbiota in patients with chronic kidney disease. Postgrad Med. 2020;132:495–505. [DOI] [PubMed] [Google Scholar]
- 25.Wang X, Yang S, Li S, Zhao L, Hao Y, Qin J, et al. Aberrant gut microbiota alters host metabolome and impacts renal failure in humans and rodents. Gut. 2020;69:2131–42. [DOI] [PMC free article] [PubMed] [Google Scholar]
- 26.Perna AF, Pane F, Sepe N, Fontanarosa C, Pinto G, Zacchia M, et al. Lanthionine and other relevant Sulfur amino acid metabolites: detection of prospective uremic toxins in serum by multiple reaction monitoring Tandem Mass Spectrometry. Methods Mol Biol Clifton NJ. 2019;2007:9–17. [DOI] [PubMed] [Google Scholar]
- 27.Strocchi A, Furne JK, Levitt MD. A modification of the methylene blue method to measure bacterial sulfide production in feces. J Microbiol Methods. 1992;15:75–82. [Google Scholar]
- 28.Gryp T, Glorieux G, Joossens M, Vaneechoutte M. Comparison of five assays for DNA extraction from bacterial cells in human faecal samples. J Appl Microbiol. 2020;129:378–88. [DOI] [PMC free article] [PubMed] [Google Scholar]
- 29.Falony G, Joossens M, Vieira-Silva S, Wang J, Darzi Y, Faust K, et al. Population-level analysis of gut microbiome variation. Science. 2016;352:560–4. [DOI] [PubMed] [Google Scholar]
- 30.Vandeputte D, Kathagen G, D’Hoe K, Vieira-Silva S, Valles-Colomer M, Sabino J et al. Quantitative microbiome profiling links gut community variation to microbial load. Nat. 2017 5517681 2017;551:507–11. [DOI] [PubMed]
- 31.Pedregosa FABIANPEDREGOSAF, Michel V, Grisel OLIVIERGRISELO, Blondel M, Prettenhofer P, Weiss R, et al. Scikit-learn: machine learning in Python. J Mach Learn Res. 2011;12:2825–30. [Google Scholar]
- 32.Jari Oksanen GL, Simpson F, Guillaume Blanchet R, Kindt P, Legendre PR, Minchin et al. vegan: Community Ecology Package. R package version 2.6-4. 2022 n.d.
- 33.Iebba V, Zanotta N, Campisciano G, Zerbato V, Di Bella S, Cason C et al. Profiling of oral microbiota and cytokines in COVID-19 patients. Front Microbiol. 2021;12. [DOI] [PMC free article] [PubMed]
- 34.Blondel VD, Guillaume JL, Lambiotte R, Lefebvre E. Fast unfolding of communities in large networks. J Stat Mech Theory Exp. 2008;2008:P10008. [Google Scholar]
- 35.Douglas GM, Maffei VJ, Zaneveld JR, Yurgel SN, Brown JR, Taylor CM, et al. PICRUSt2 for prediction of metagenome functions. Nat Biotechnol. 2020;38:685–8. [DOI] [PMC free article] [PubMed] [Google Scholar]
- 36.Perna AF, Russo L, D’esposito V, Formisano P, Bruzzese D, Vigorito C et al. Lanthionine, a Novel Uremic Toxin, in the vascular calcification of chronic kidney disease: the role of Proinflammatory cytokines. Int J Mol Sci. 2021;22. [DOI] [PMC free article] [PubMed]
- 37.Vigorito C, Anishchenko E, Mele L, Capolongo G, Trepiccione F, Zacchia M et al. Uremic Toxin Lanthionine interferes with the Transsulfuration Pathway, Angiogenetic Signaling and increases intracellular calcium. Int J Mol Sci. 2019;20. [DOI] [PMC free article] [PubMed]
- 38.García-Martínez Y, Borriello M, Capolongo G, Ingrosso D, Perna AF. The gut microbiota in kidney transplantation: a target for personalized therapy? Biol. 2023;12:163. [DOI] [PMC free article] [PubMed] [Google Scholar]
- 39.Swarte JC, Douwes RM, Hu S, Vila AV, Eisenga MF, van Londen M et al. Characteristics and dysbiosis of the gut microbiome in renal transplant recipients. J Clin Med. 2020;9. [DOI] [PMC free article] [PubMed]
- 40.Souai N, Zidi O, Mosbah A, Kosai I, Manaa JE, Mokhtar NB, et al. Impact of the post-transplant period and Lifestyle diseases on human gut microbiota in kidney graft recipients. Microorganisms. 2020;8:1–19. [DOI] [PMC free article] [PubMed] [Google Scholar]
- 41.Koshida T, Gohda T, Sugimoto T, Asahara T, Asao R, Ohsawa I, et al. Gut Microbiome and Microbiome-Derived metabolites in patients with end-stage kidney disease. Int J Mol Sci. 2023;24:11456. [DOI] [PMC free article] [PubMed] [Google Scholar]
- 42.Wang H, Ainiwaer A, Song Y, Qin L, Peng A, Bao H, et al. Perturbed gut microbiome and fecal and serum metabolomes are associated with chronic kidney disease severity. Microbiome. 2023;11:1–16. [DOI] [PMC free article] [PubMed] [Google Scholar]
- 43.Ghoshal U, Shukla R, Srivastava D, Ghoshal UC. Irritable bowel syndrome, particularly the constipation-predominant form, involves an increase in Methanobrevibacter smithii, which is Associated with higher methane production. Gut Liver. 2016;10:932–8. [DOI] [PMC free article] [PubMed] [Google Scholar]
- 44.Ikee R, Yano K, Tsuru T. Constipation in chronic kidney disease: it is time to reconsider. Ren Replace Ther. 2019;5:51. [Google Scholar]
- 45.Crost EH, Coletto E, Bell A, Juge N. Ruminococcus gnavus: friend or foe for human health. FEMS Microbiol Rev. 2023;47:1–23. [DOI] [PMC free article] [PubMed] [Google Scholar]
- 46.Walsh CJ, Guinane CM, O’Toole PW, Cotter PD. A Profile Hidden Markov Model to investigate the distribution and frequency of LanB-encoding lantibiotic modification genes in the human oral and gut microbiome. PeerJ. 2017;5. [DOI] [PMC free article] [PubMed]
- 47.Dischinger J, Basi Chipalu S, Bierbaum G, Lantibiotics. Promising candidates for future applications in health care. Int J Med Microbiol. 2014;304:51–62. [DOI] [PubMed] [Google Scholar]
Associated Data
This section collects any data citations, data availability statements, or supplementary materials included in this article.
Supplementary Materials
Data Availability Statement
Sequence data that support the findings of this study have been deposited in the European Nucleotide Archive (https://www.ebi.ac.uk/ena/browser/home) with the primary accession code PRJEB67373. The manuscript and supplementary information files provide all relevant data generated or analyzed during this study.


