Abstract
Background
The role of histone methyltransferase SETDB1 in renal ischemia–reperfusion (I/R) injury has not been explored yet. This study aims to investigate the potential mechanism of SETDB1 in regulating renal I/R injury and its impact on mitochondrial damage and oxidative stress.
Methods
The in vivo model of renal I/R in mice and the in vitro model of hypoxia/reoxygenation (H/R) in human renal tubular epithelial cells (HK-2) were constructed to detect the expression of SETDB1. Next, the specific inhibitor (R,R)-59 and knockdown viruses were used to inhibit SETDB1 and verify its effects on mitochondrial damage and oxidative stress. Chromatin immunoprecipitation (ChIP) and coimmunoprecipitation (CoIP) were implemented to explore the in-depth mechanism of SETDB1 regulating renal I/R injury.
Results
The study found that SETDB1 had a regulatory role in mitochondrial damage and oxidative stress during renal I/R injury. Notably, SESN2 was identified as a target of SETDB1, and its expression was under the influence of SETDB1. Besides, SESN2 mediated the regulation of SETDB1 on renal I/R injury. Through deeper mechanistic studies, we uncovered that SETDB1 collaborates with heterochromatin HP1β, facilitating the labeling of H3K9me3 on the SESN2 promoter and impeding SESN2 expression.
Conclusions
The SETDB1/HP1β-SESN2 axis emerges as a potential therapeutic strategy for mitigating renal I/R injury.
Supplementary Information
The online version contains supplementary material available at 10.1186/s12915-024-02048-z.
Keywords: SETDB1, SESN2, Mitochondrial damage, Oxidative stress, Renal ischemia–reperfusion injury
Background
Renal ischemia–reperfusion (I/R) injury poses an unavoidable challenge in kidney transplantation and other renal surgeries, often resulting in renal dysfunction and, in severe cases, renal failure [1]. Enhancing our understanding and addressing renal I/R injury is crucial for improving the success rates of kidney surgeries and reducing patient mortality [2]. Current strategies for preventing and treating renal I/R injury include medications, ischemic preconditioning, ischemic post-treatment, and normothermic perfusion [3]. However, many of these approaches are still experimental, lacking specific treatment measures and drugs targeting the mechanisms of renal I/R injury. The threat of renal failure, stemming from I/R injury, and its associated high mortality risk continue to jeopardize patients’ lives and well-being [4]. There is an urgent need to delve deeper into the mechanisms of renal I/R injury to unveil new insights and offer innovative approaches for its prevention and treatment.
The mechanism underlying renal ischemia/reperfusion (I/R) injury remains incompletely understood, with current consensus attributing a significant role to oxidative stress induced by mitochondrial damage [5]. Ischemia reperfusion creates an imbalance in oxygen supply and demand, culminating in mitochondrial dysfunction [6]. During ischemia, adenosine-triphosphate (ATP) production diminishes within mitochondria, resulting in the accumulation of reactive oxygen species (ROS) and other detrimental molecules. Paradoxically, reperfusion, aimed at restoring oxygen supply, exacerbates oxidative stress by promoting ROS production. These ROS can inflict damage upon cellular components such as lipids, proteins, and DNA, ultimately causing kidney damage [7].
SETDB1 is a member of the protein family characterized by the presence of the SET domain, a conserved region exhibiting histone methyltransferase (HMT) activity. Alongside the SET domain, SETDB1 features additional structural domains such as pre-SET, SET, and post-SET, playing roles in substrate recognition and catalysis [8]. Notably, SETDB1 encompasses the Tudor domain crucial for recognizing and binding methylated histones. Its principal function involves the methylation of histone H3 at lysine 9 (H3K9), resulting in H3K9 methylation and the formation of heterochromatin—a densely packed and transcriptionally repressive chromatin form. H3K9 methylation typically correlates with the suppression of gene expression by impeding the entry of transcriptional mechanisms into DNA [9]. Aberrant expression or dysregulation of SETDB1 is implicated in various diseases, including cancer, intestinal inflammation, and neurological disorders [10–12]. Its significance in epigenetic regulation positions it as a potential target for therapeutic interventions aiming to modulate gene expression patterns [13]. Recent studies have confirmed that SETDB1 could serve as a therapeutic target for ischemia–reperfusion (I/R) in the liver and intestines, providing a new perspective for the treatment of I/R [14, 15]. However, the role of SETDB1 in renal I/R injury remains unexplored.
Sestrin2 (SESN2) is a conserved stress-induced protein with a pivotal role as an antioxidant, inhibiting reactive oxygen species (ROS) and modulating signaling pathways related to hypoxia and nutritional stress responses through AMP-dependent protein kinase (AMPK) and mammalian target of rapamycin complex 1 (mTORC1) [16]. Additionally, SESN2 appears to be involved in preserving mitochondrial function, a critical aspect of cellular health [17]. Research on SESN2 in renal diseases predominantly centers around its potential protective effects against renal injury and its contribution to maintaining renal function [18]. Several studies suggest that SESN2 may exert a protective influence in various kidney diseases, positioning it as a reliable target for kidney disease treatment [19–21]. Consequently, regulating SESN2 expression during kidney ischemia/reperfusion (I/R) injury represents a promising therapeutic strategy.
In this study, we investigated the mechanism by which SETDB1 regulated renal IR injury and clarified the relationship between SETDB1 and SESN2, providing a theoretical basis for the treatment of renal I/R injury.
Results
SETDB1 was upregulated in vivo and in vitro
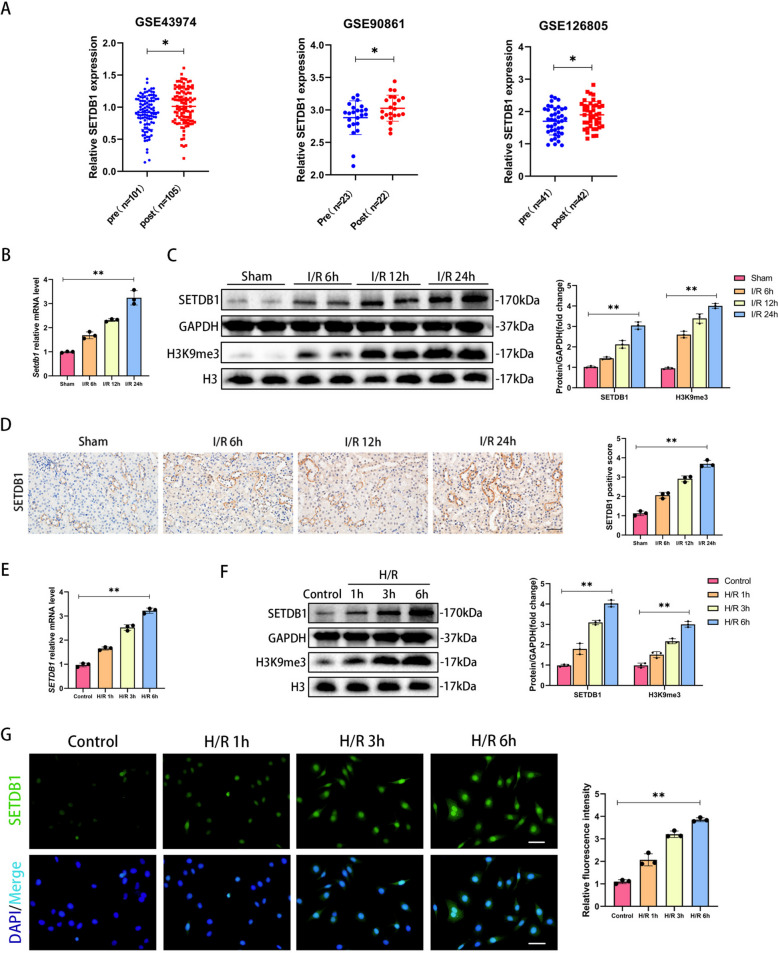
By analyzing data (GSE43974, GSE90861, GSE126805) from the public database GEO (https://www.ncbi.nlm.nih.gov/geo/), we focused on SETDB1, an important histone methyltransferase during I/R, which was upregulated in human renal tissue after I/R (Fig. 1A). To investigate the role of SETDB1, we constructed in vitro and in vivo models of renal I/R injury. The results showed that the mRNA levels of SETDB1 significantly increased with prolonged reperfusion time (6 h, 12 h, 24 h) in the mouse I/R model compared to the sham group (Fig. 1B). The protein expression of SETDB1 and H3K9me3 showed the same results (Fig. 1C). The immunohistochemistry (IHC) results showed that the protein staining degree of SETDB1 was significantly increased in the renal tubules of mice after I/R stimulation, and the degree of protein staining was positively correlated with reperfusion time (Fig. 1D). The 24 h reperfusion time was set as the condition of subsequent I/R model. Next, we established an in vitro H/R model of HK-2 cells. Consistent with in vivo findings, in vitro experiments showed a significant increase in the mRNA levels of SETDB1 and protein expression of SETDB1 and H3K9me3 in HK-2 cells after H/R stimulation compared to the control group (Fig. 1E and F). The immunofluorescence (IF) experiment of SETDB1 protein in HK-2 cells showed that the fluorescence intensity significantly increased with prolonged reoxygenation time (1 h, 3 h, 6 h) (Fig. 1G). The 6 h reoxygenation time was set as the condition of subsequent H/R model. These results indicated that SETDB1 might be involved in the process of renal I/R injury.
Fig. 1.
SETDB1 was upregulated in I/R model of mice and H/R model of HK-2 cells. A Analysis of SETDB1 expression in human kidney tissue pre-ischemia (pre) and post-reperfusion (post) using GEO dataset (GSE43974, GSE90861, GSE126805). B qPCR detection of SETDB1 mRNA levels in mice kidney tissues. C WB detection of SETDB1 and H3K9me3 protein levels in mice kidney tissues. D Representative images of immunohistochemistry of SETDB1 in mice kidney tissues (left) and related quantitative analysis (right). Bar = 50 μm. E qPCR detection of SETDB1 mRNA levels in HK-2 cells. F WB detection of SETDB1 protein levels in HK-2 cells. G Representative images of immunofluorescence (green) of SETDB1 in HK-2 cells (left) and related quantitative analysis (right). Bar = 50 μm. Values are expressed as the mean ± SEM. N = 3. The * represents differences between groups, and p < 0.05. The ** represents differences between groups, and p < 0.01
Inhibiting SETDB1 alleviated oxidative stress in vivo and in vitro
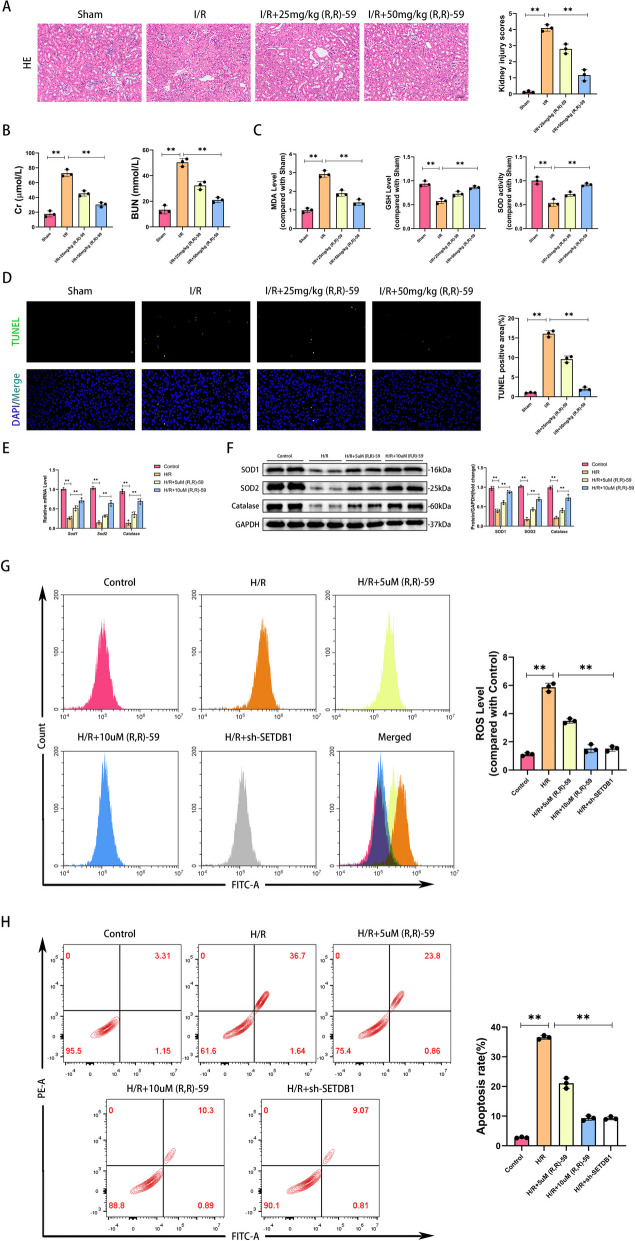
To investigate the regulatory effect of SETDB1 on renal I/R injury, we used a SETDB1 specific inhibitor, (R,R)-59 [14]. (R,R)-59 could effectively inhibit H3K9me3 during renal ischemia–reperfusion in mice (Supplementary Fig. S1A), and it does not have nephrotoxicity (Supplementary Fig. S1B and C). To eliminate non-specific factors, we applied (R,R)-59 to SETDB1 knockdown HK-2 cells. The CCK8 experiment results showed that (R,R)-59 did not have any additional effects on SETDB1 knockdown HK-2 cells during H/R period (Supplementary Fig. S1D). As shown in Fig. 2A, after I/R injury, renal tubules swell, fuse, and nuclear detachment occur, with interstitial inflammatory cell infiltration. After the application of (R,R)-59, renal tissue damage was significantly improved, and the treatment effect of the high concentration (50 mg/kg) group was better than that of the low concentration (25 mg/kg) group. Similarly, the renal function reflected by Cr and BUN of mice was significantly improved (Fig. 2B). During renal I/R injury, there was a significant increase in oxidative substances (malondialdehyde, MDA), a reduce in antioxidant substances (glutathione, GSH), and a decrease in the activity of antioxidant enzyme (superoxide dismutase, SOD). These changes were significantly reversed with the application of drugs (Fig. 2C). Inhibiting SETDB1 could significantly decrease I/R-induced dUTP Nick-End Labeling (TUNEL) positive cells (Fig. 2D). Subsequently, we conducted experimental validation in the H/R model of HK-2 cells. Compared with the control group, the mRNA and protein levels of antioxidant enzymes (SOD1, SOD2, and Catalase) in HK-2 cells of the H/R group were significantly reduced. With (R,R)-59 treatment, the expression of antioxidant enzymes was restored, and compared to 5 µM (R,R)-59, 10 µM (R,R)-59 had better effects (Fig. 2E and F). The increased cellular ROS content after H/R stimulation labeled by MDCFH-DA was significantly suppressed by (R,R)-59, which had the same effect with SETDB1 genetic inhibition (Fig. 2G). SETDB1 knockdown efficiency was shown in Supplementary Fig. S2A. In addition, drug or genetic inhibiting SETDB1 significantly improves H/R induced apoptosis of HK-2 cells (Fig. 2H). These findings illustrated that SETDB1 played an important role in renal I/R-induced oxidative stress.
Fig. 2.
Inhibition of SETDB1 mitigated oxidative stress in vivo and in vitro. A Representative images of HE staining in mice kidney tissues (left) and related quantitative analysis (right). Bar = 50 μm. B Detection of Cr and BUN in mice serum. C Detection of the level of MDA, GSH, and the activity of SOD in mice kidney tissues. D Representative images of TUNEL staining in mice kidney tissues (left) and related quantitative analysis (right). Bar = 100 μm. E qPCR detection of SOD1, SOD2, and Catalase mRNA levels. F WB detection of SOD1, SOD2, and Catalase protein levels. G Detection of ROS levels in HK-2 cells by flow cytometry. H Detection of apoptosis rate in HK-2 cells by flow cytometry. Values are expressed as the mean ± SEM. N = 3. The ** represents differences between groups, and p < 0.01
Inhibiting SETDB1 maintained mitochondrial health in vivo and in vitro
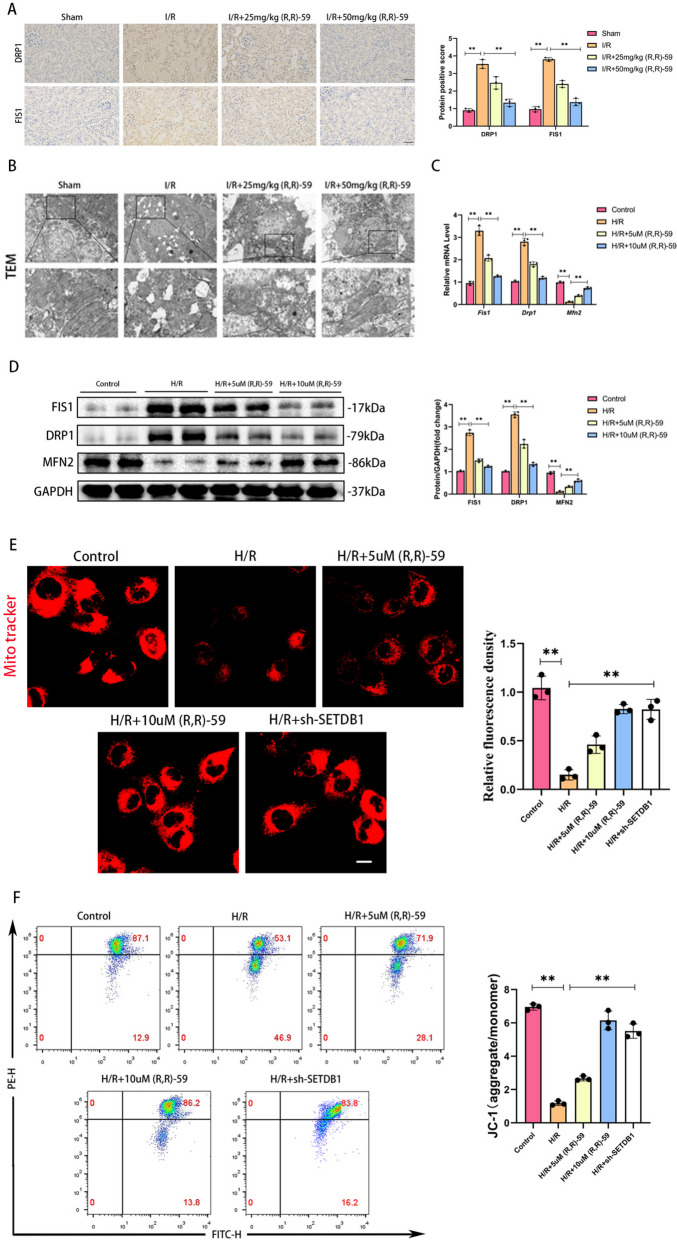
As is well known, mitochondrial damage is an important factor of inducing oxidative stress. Therefore, we investigated whether SETDB1 could regulate mitochondrial damage. The IHC results showed a significant increase of protein staining intensity in mitochondrial dynamic proteins DRP1 and FIS1 during renal I/R injury, and inhibition of SETDB1 could reverse these changes (Fig. 3A). Through transmission electron microscopy (TEM), we observed mitochondrial rupture, mitochondrial cristae rupture, and vacuole formation in renal I/R injury. After using SETDB1 inhibitors, the mitochondrial structure was significantly improved (Fig. 3B). Compared with the control group, the mRNA and protein expression of mitochondrial fission related molecules (FIS1 and DRP1) in HK-2 cells of the H/R group significantly increased, while the mRNA and protein expression of mitochondrial fusion related molecule (MFN2) significantly decreased. Inhibiting SETDB1 could improve these mitochondrial dynamics abnormalities (Fig. 3C and D). Mito-tracker staining of HK-2 cells revealed fragmented punctate structures and decreased fluorescence intensity in mitochondria after H/R stimulation. Drug or genetic inhibiting SETDB1 could significantly improve morphology of mitochondria, presenting a continuous network structure, and increased fluorescence intensity (Fig. 3E). JC-1 detection showed that the ratio of JC-1 aggregate to monomer reflecting mitochondrial membrane potential (MMP) decreased after H/R stimulation, and drug or genetic inhibiting SETDB1 restore the mitochondrial membrane potential (MMP) (Fig. 3F). These results suggested that SETDB1 participated in regulating mitochondrial damage.
Fig. 3.
Inhibition of SETDB1 improved mitochondrial morphology and function in vivo and in vitro. A Representative images of immunohistochemistry of DRP1 and FIS1 in mice kidney tissues (left) and related quantitative analysis (right). Bar = 50 μm. B Representative images of TEM in mice kidney tissues. Bar = 20 μm (up), bar = 10 μm (down). C qPCR detection of FIS1, DRP1, and MFN2 mRNA levels. D WB detection of FIS1, DRP1, and MFN2 protein levels. E Representative images of Mito Tracker Red CMXRos in HK-2 cells (left) and related quantitative analysis (right). Bar = 30 μm. F Detection of JC-1 in HK-2 cells by flow cytometry. Values are expressed as the mean ± SEM. N = 3. The ** represents differences between groups, and p < 0.01
SETDB1 regulated the expression of Sestrin2
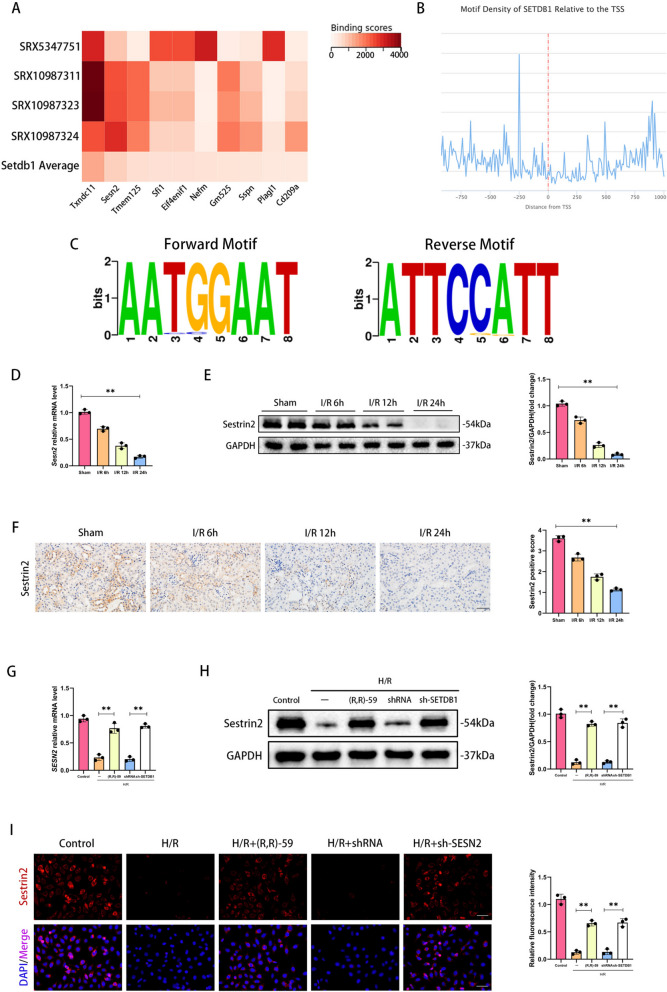
By screening SETDB1 related dataset (SRX5347751, SRX10987311, SRX10987323, SRX10987324) from the public database ChIP-Atlas (chip-atlas.org), we identified the top 10 targeted genes of SETDB1 (Txndc11, Sesn2, Tmem125, Sfi1, Eif4enif1, Nefm, Gm525, Sspn, Plagl1, Cd209a) (Fig. 4A). The SESN2 gene encoded a stress protein Sestrin2 that was widely involved in mitochondrial protection and antioxidant stress processes, and was therefore selected as the target of this study. By querying public databases ChIPBase (rnasysu.com/chipbase3/index.php), we found that SETDB1 was enriched in the promoter region (Fig. 4B), and its module sequence was AATGGAAT (Fig. 4C). Notably, the mRNA and protein level of Sestrin2 were significantly downregulated with the prolonged reperfusion time during renal I/R injury (Fig. 4D and E). The IHC results showed that the protein expression of Sestrin2 was significantly decreased in the renal tubules of mice after I/R stimulation, and the level of expression was negatively correlated with reperfusion time (Fig. 4F). Drug inhibition or gene inhibition of SETDB1 could significantly restore the loss of Sestrin2 on mRNA and protein induced by H/R (Fig. 4G and H). The IF detection of Sestrin2 protein in HK-2 cells showed the same observation (Fig. 4I). These findings indicated that SETDB1 could regulate the expression of Sestrin2.
Fig. 4.
Sestrin2 was downregulated in vivo and in vitro and regulated by SETDB1. A The heatmap of top 10 targeted genes of SETDB1 (Txndc11, Sesn2, Tmem125, Sfi1, Eif4enif1, Nefm, Gm525, Sspn, Plagl1, Cd209a). B The motif density of SETDB1 relative to the TSS. C The forward and reverse motif logo of SETDB1. D qPCR detection of SESN2 mRNA levels in mice kidney tissues. E WB detection of Sestrin2 protein levels in mice kidney tissues. F Representative images of immunohistochemistry of Sestrin2 in mice kidney tissues (left) and related quantitative analysis (right). Bar = 50 μm. G qPCR detection of SESN2 mRNA levels in HK-2 cells. H WB detection of Sestrin2 protein levels in HK-2 cells. I Representative images of immunofluorescence (red) of Sestrin2 in HK-2 cells (left) and related quantitative analysis (right). Bar = 50 μm. Values are expressed as the mean ± SEM. N = 3. The ** represents differences between groups, and p < 0.01
SETDB1 mediated H3K9me3 at the promoters of SESN2
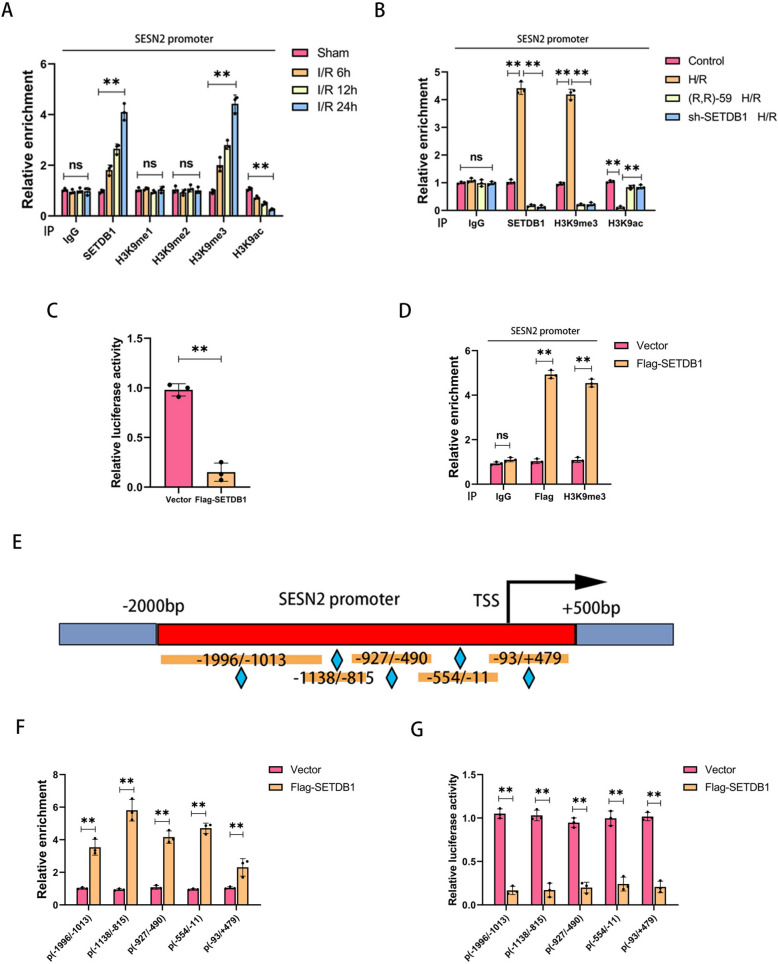
According to reports, the expression of Sestrin2 was regulated by histone H3K9 modification [22]. To investigate the in-depth mechanism of SETDB1 regulating Sestrin2, we conducted the ChIP experiment on the promoter of SESN2. As shown in Fig. 5A, the enrichment of SETDB1 and tri-methylated histone H3K9 (H3K9me3) on the SESN2 promoter gradually increased with the prolongation of reperfusion time, while the antagonistic marker of H3K9me, acetylated H3K9 (H3K9ac), significantly decreased. No significant changes were observed in H3K9me and H3K9me2. By comparison, no significant accumulation of SETDB1, H3K9me1/2/3, or H3K9ac bound to the region of GAPDH (Supplementary Fig. S3A). Both drug and gene inhibition of SETDB1 led to a decrease in the enrichment of SETDB1 and H3K9me3, as well as an increase in the enrichment of H3K9ac during H/R in HK-2 cells (Fig. 5B). Similarly, no significant accumulation of SETDB1, H3K9me3, or H3K9ac bound to the region of GAPDH (Supplementary Fig. S3B). Meanwhile, the luciferase reporter gene assay showed that overexpression of SETDB1 could significantly reduce the activity of the SESN2 promoter (Fig. 5C). Moreover, SETDB1 (Flag-tagged) accumulated on SESN2 promoter and promoted the recruitment of H3K9me3 to the reporter construct which was transfected in HK-2 cells (Fig. 5D). Subsequently, we constructed promoters of SESN2 with different lengths (Fig. 5E). SETDB1 could enrich on different lengths of SESN2 promoters (Fig. 5F) and inhibit their activity (Fig. 5G). These findings demonstrated that SETDB1 regulated the transcription of SESN2 by mediating histone H3K9me3 modification.
Fig. 5.
SETDB1 regulates H3K9me3 on the SESN2 promoter. A ChIP detection of the enrichment of SETDB1, H3K9me1, H3K9me2, H3K9me3, and H3K9ac on SESN2 promoter in vivo. B ChIP detection of SETDB1, H3K9me3, and H3K9ac on SESN2 promoter in vitro. C Detection of luciferase activity by the SESN2 promoter reporter gene in HK-2 cells. D ChIP detection of the enrichment of Flag and H3K9me3 on SESN2 promoter in HK-2 cells. E Schematic diagram of SESN2 promoters with different lengths. F ChIP detection of the enrichment of SETDB1 on SESN2 promoters with different lengths in HK-2 cells. G Detection of luciferase activity by the reporter gene of SESN2 promoters with different lengths in HK-2 cells. Values are expressed as the mean ± SEM. N = 3. The ** represents differences between groups, and p < 0.01
SETDB1 maintained mitochondrial health dependently of SESN2
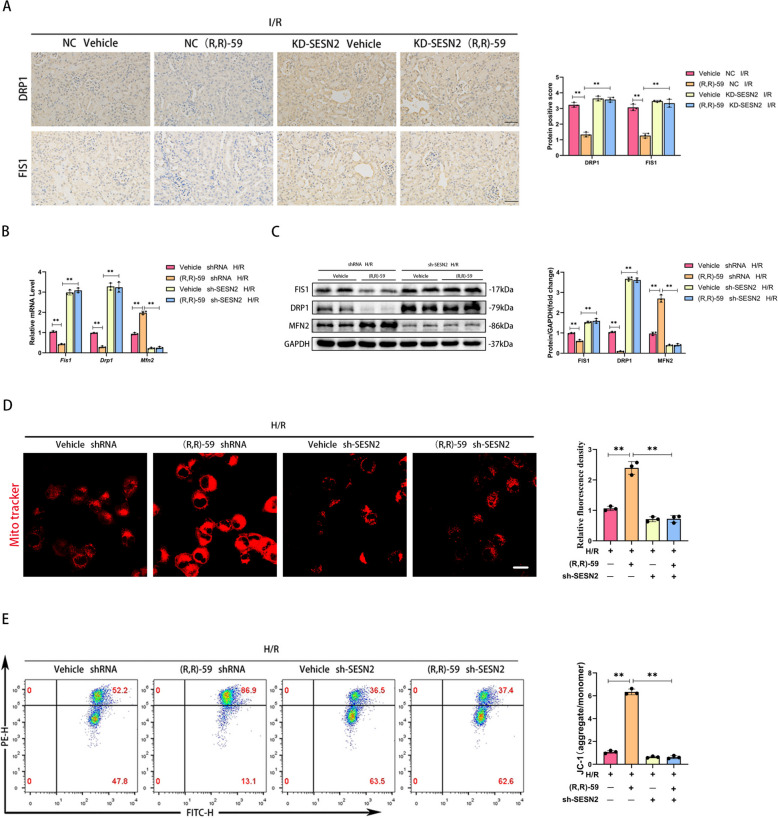
To investigate whether SESN2 mediated the ability of SETDB1 to regulate mitochondria, we constructed in vivo and in vitro SESN2 knockdown models. The IHC staining showed that inhibiting SETDB1 could reduce the expression of DRP1 and FIS1 in I/R, but knockdown of SESN2 reversed and exacerbated this process (Fig. 6A). During H/R, knockdown of SESN2 reversed the effects of (R,R)-59 on inhibiting mitochondrial fission related molecules (FIS1 and DRP1) and promoting mitochondrial fusion related molecule (MFN2) at mRNA and protein level during H/R and had an additional effect in the opposite direction (Fig. 6B and C). In addition, knockdown of SESN2 aggravated mitochondrial damage and eliminated the protective effect of (R,R)-59 on mitochondrial morphology of HK-2 cells (Fig. 6D). Similarly, the recovery effect of (R,R)-59 on MMP during H/R process was eliminated by knockdown of SESN2 (Fig. 6E). These results proved that the effect of SETDB1 on mitochondria was mediated by SESN2.
Fig. 6.
Knockdown of SESN2 eliminated mitochondrial protection mediated by (R,R)-59 in vivo and in vitro. A Representative images of immunohistochemistry of DRP1 and FIS1 in mice kidney tissues (left) and related quantitative analysis (right). Bar = 50 μm. B qPCR detection of FIS1, DRP1, and MFN2 mRNA levels. C WB detection of FIS1, DRP1, and MFN2 protein levels. D Representative images of Mito Tracker Red CMXRos in HK-2 cells (left) and related quantitative analysis (right). Bar = 30 μm. E Detection of JC-1 in HK-2 cells by flow cytometry. Values are expressed as the mean ± SEM. N = 3. The ** represents differences between groups, and p < 0.01
SETDB1 modulated oxidative stress dependently of SESN2
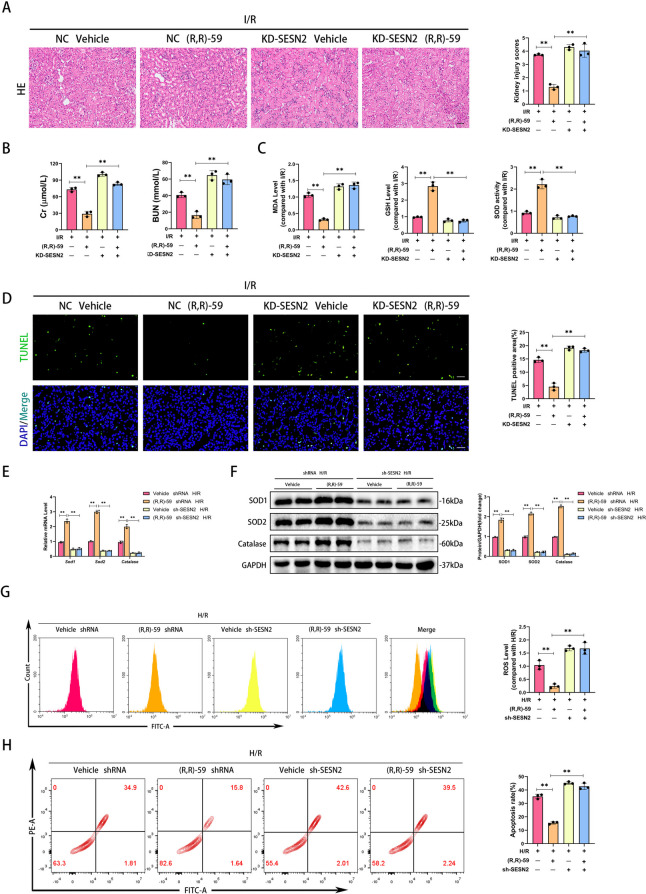
Next, to explore whether SESN2 mediated the regulation of oxidative stress by SETDB1, we constructed a SESN2 knockdown model in mice (Supplementary Fig. S2B). The HE staining results showed that knockdown of SESN2 deteriorated renal tissue damage and eliminated the protective effect of (R,R)-59 during I/R (Fig. 7A). Similarly, the therapeutic effect of (R,R)-59 on renal function during I/R was disrupted and exacerbated by knockdown of SESN2 (Fig. 7B). In addition, the decrease in MDA, increase in GSH, and increase in SOD activity caused by (R,R)-59 during I/R were reversed by knockdown of SESN2 (Fig. 7C). The TUNEL staining indicated that the anti I/R-induced apoptotic effect of (R,R)-59 was blocked by knockdown of SESN2 (Fig. 7D). During H/R, the administration of (R,R)-59 reduced the mRNA and protein expression of antioxidant molecules, while knockdown of SESN2 reversed it (Fig. 7E and F). Moreover, (R,R)-59 could reduce the production of ROS induced by H/R, but knockdown of SESN2 obviated this effect (Fig. 7G). Notably, (R,R)-59 treatment did not alleviate apoptosis induced by H/R in SESN2 knockdown HK-2 cells (Fig. 7H). These findings indicated that SESN2 mediated the regulation of SETDB1 on oxidative stress.
Fig. 7.
Knockdown of SESN2 hindered the treatment of oxidative stress mediated by (R,R)-59 in vivo and in vitro. A Representative images of HE staining in mice kidney tissues (left) and related quantitative analysis (right). Bar = 50 μm. B Detection of Cr and BUN in mice serum. C Detection of the level of MDA, GSH, and the activity of SOD in mice kidney tissues. D Representative images of TUNEL staining in mice kidney tissues (left) and related quantitative analysis (right). Bar = 100 μm. E qPCR detection of SOD1, SOD2, and Catalase mRNA levels. F WB detection of SOD1, SOD2, and Catalase protein levels. G Detection of ROS levels in HK-2 cells by flow cytometry. H Detection of apoptosis rate in HK-2 cells by flow cytometry. Values are expressed as the mean ± SEM. N = 3. The ** represents differences between groups, and p < 0.01
HP1β collaborated with SETDB1 to inhibit the expression of SESN2
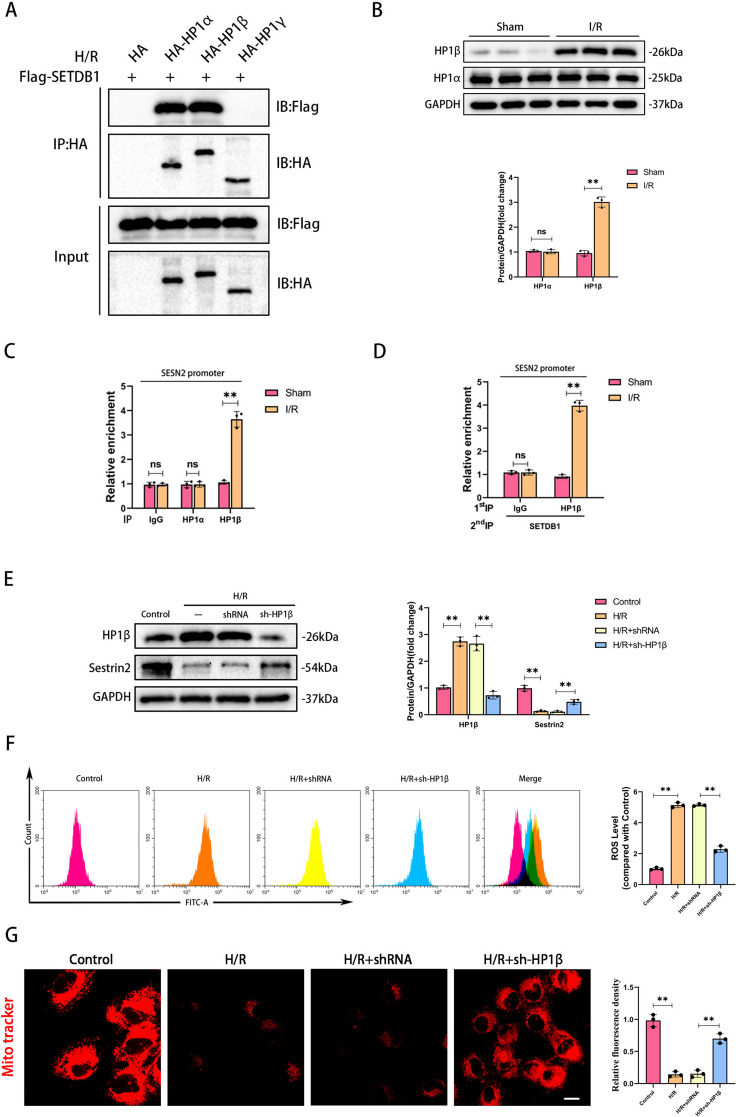
Heterochromatin protein 1 (HP1) is a key factor in H3K9 methylation modification process, including HP1α, HP1β, and HP1γ [23]. Thus, we proposed a hypothesis that HP1 mediated the modification of H3K9me3 on SESN2 promoter by SETDB1. To verify our hypothesis, we performed a CoIP assay and examined the interactions between SETDB1 and HP1s in HK-2 cells during H/R. Importantly, SETDB1 presented the strong interaction with HP1α and HP1β (Fig. 8A). Notably, only HP1β was dramatically increased and enriched on SESN2 promoter in kidney undergoing an I/R operation (Fig. 8B and C). The Re-ChIP assay demonstrated that HP1β collaborated with SETDB1 enriched on SESN2 promoter during I/R (Fig. 8D). Inhibiting HP1β could restore the reduced expression of SESN2 caused by H/R stimulation (Fig. 8E). Notably, inhibiting HP1β could also alleviate ROS production and mitochondrial damage during H/R (Fig. 8F and G). These findings provided evidence that cooperation of SETDB1 with HP1β suppressed SESN2 expression and regulated oxidative stress and mitochondrial damage.
Fig. 8.
HP1β interacted with SETDB1 to jointly regulate SESN2. A CoIP results of SETDB1 and different HP1. B WB detection of HP1α and HP1β protein levels. C ChIP detection of the enrichment of HP1α and HP1β on SESN2 promoter in vivo. D Re-ChIP detection of the enrichment of SETDB1 combined with HP1β on SESN2 promoter in vivo. E WB detection of HP1β and Sestrin2 protein levels. F Detection of ROS levels in HK-2 cells by flow cytometry. G Representative images of Mito Tracker Red CMXRos in HK-2 cells (left) and related quantitative analysis (right). Bar = 30 μm. Values are expressed as the mean ± SEM. N = 3. The ** represents differences between groups, and p < 0.01
Discussion
Renal ischemia–reperfusion (I/R) injury, marked by a dismal prognosis and elevated mortality rates, currently lacks effective therapeutic interventions [24]. Identifying reliable therapeutic targets to alleviate the substantial medical burden associated with renal I/R injury is of paramount importance [25]. Here, we found that SETDB1 was upregulated during renal I/R injury, and inhibition of SETDB1 could significantly improve renal function and renal tissue damage. Scrutinizing the regulatory mechanisms governing SETDB1 in the context of renal ischemia–reperfusion injury could offer a fresh perspective for its treatment, addressing the critical need for more efficacious therapeutic strategies in this challenging clinical scenario.
Mitochondria are both a source and a target of oxidative stress during I/R. On one hand, damaged mitochondria release more ROS into the cell, contributing to oxidative stress. On the other hand, the oxidative damage to mitochondrial components further impairs their function, creating a vicious cycle [26]. Mitochondrial damage and oxidative stress contribute to cell death and tissue injury during I/R [27]. The release of pro-apoptotic factors from damaged mitochondria can activate apoptotic pathways, leading to programmed cell death [28]. Additionally, the disruption of mitochondrial function can compromise cellular energy balance, ion homeostasis, and contribute to inflammation. Strategies aimed at preserving mitochondrial function and reducing oxidative stress have been explored as potential therapeutic approaches to mitigate I/R injury [29]. Previous study has shown that SETDB1 mediated mitochondrial dysfunction in cockayne syndrome [30]. Our study elucidated the role of SETDB1 in regulating mitochondrial function and oxidative stress during renal I/R injury. Inhibiting SETDB1 could significantly improve mitochondrial morphology and function, maintain mitochondrial dynamic balance, and reduce ROS production during renal I/R injury.
SETDB1 functions as a histone methyltransferase, contributing to the epigenetic regulation of gene expression by modifying histone proteins, particularly H3K9 methylation, and influencing chromatin structure. This activity is important for various cellular processes, including development, differentiation, and the maintenance of genomic integrity [31–33]. According to reports, SETDB1 regulated hematopoietic function through H3K9me3 modification and chromatin remodeling [34]. In addition, Cao et al.’s study suggested that SETDB1 could bind to the p21 promoter and regulate its H3K9me3 enrichment level [35]. Our study revealed that SESN2 serves as the target of SETDB1, with SETDB1 being enriched on the SESN2 promoter and mediating H3K9me3 modification. Consequently, SETDB1 indirectly influences mitochondrial function and oxidative stress by modulating SESN2 transcription.
H3K9me3 is a hallmark of heterochromatin, which is a densely packed and transcriptionally silent form of chromatin [36]. The trimethylation of H3K9 is a key step in the establishment and maintenance of heterochromatin, contributing to the compaction of chromatin structure [37]. The function of HP1 is primarily associated with heterochromatin. HP1 protein functions by recruiting other chromatin modifying enzymes and proteins. Maeda and Tachibana’s study indicated that HP1 could maintain the protein stability of H3K9 methyltransferase and demethylase [38]. Here, we have identified a type of HP1, HP1β, involved in regulating the transcription of SESN2. HP1β was found to directly interact with SETDB1, collectively influencing the H3K9me3 modification on the SESN2 promoter.
Conclusions
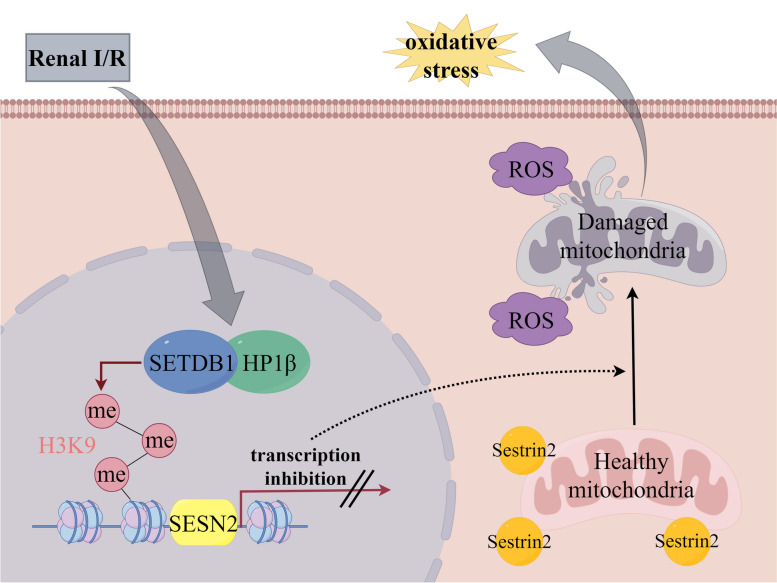
In summary, our investigation reveals that SETDB1 has a regulatory role in mitochondrial damage and oxidative stress during renal ischemia–reperfusion injury. Furthermore, we have identified SESN2 as a target of SETDB1, and its expression is under the influence of SETDB1. Through additional mechanistic studies, we have uncovered that SETDB1 collaborates with heterochromatin HP1β, facilitating the labeling of H3K9me3 on the SESN2 promoter and impeding SESN2 expression. Consequently, the SETDB1/HP1β-SESN2 axis emerges as a potential therapeutic strategy for mitigating renal ischemia–reperfusion injury (Fig. 9).
Fig. 9.
SETDB1 collaborates with heterochromatin HP1β, facilitating the labeling of H3K9me3 on the SESN2 promoter and impeding SESN2 expression. Loss of Sestrin2 induces mitochondrial damage and subsequent oxidative stress
Methods
Mice model and treatment
Male C57BL/6 mice (20–25 g, 6–8 weeks) were purchased from the Experimental Animal Center of the Medical College of Wuhan University (Wuhan, China). Renal I/R injury model was constructed as previously method [39]. Briefly, after removing the right kidney, non-invasive vascular clamps were utilized to occlude the left renal pedicle for 30 min. The left kidney was collected at different time points after releasing the clamp. The sham group mice only had their right kidney removed.
To inhibit SETDB1 activity in vivo, (R,R)-59 (MedChemExpress, HY-141539, USA) was injected intraperitoneally at a concentration of 25 mg/kg or 50 mg/kg and a volume of 100 µl for 3 consecutive days before surgery in mice. DMSO of the same volume was applied as negative control.
The procedures were performed in accordance with the principles of Animal Care of Wuhan University (Wuhan, China). This study was approved by the Laboratory Animal Committee of Wuhan University (IACUC Issue NO. 20230304B). The mice were anesthetized by 2% isoflurane, and euthanasia was performed by dislocating the cervical vertebrae of mice after anesthesia.
Cell model and culture
The human proximal renal tubular epithelial cells (HK-2, China Center for Type Culture Collection) were cultured in complete medium under normal condition (37 °C and 5% CO2). Hypoxia/reoxygenation (H/R) model was constructed as previously method [40]. Briefly, HK-2 cells were cultured in sugar-free and serum-free DMEM under hypoxic condition (37 °C and 1% O2, 5% CO2) for 1 h, and then were transferred to complete medium under normal conditions for different reoxygenation times. HK-2 cultured under normal condition serves as the control group.
To inhibit SETDB1 activity in vitro, (R,R)-59 was applied at a concentration of 5 µM or 10 µM for 24 h before H/R stimulation. DMSO was applied as negative control.
Transduction and transfection
For in vivo knockdown of SESN2 in mice, the recombined adenoviruses mediating SESN2 knockdown were constructed and applied as previously described [41]. Briefly, we use the recombined adenoviruses carrying short hairpin RNA against SESN2, and all carriers were injected to mice via tail vein 2 weeks before inducing I/R. For in vitro knockdown of SETDB1, SESN2, and HP1β in HK-2, the lentiviruses were packaged using a double packing plasmid system. The lentiviruses transducted into HK-2 to obtain stable cell lines. For coimmunoprecipitation (CoIP), SETDB1, HP1α, HP1β, and HP1γ products were obtained through PCR and were subcloned into pHAGE-flag or pcDNA5-HA vectors, and then transfected into the corresponding cells. All the primers were listed in Table 1.
Table 1.
The primers used in the study
| Genes | Species | Sequences |
|---|---|---|
| SETDB1 | Human |
Forward: 5′-AGGAACTTCGGCATTTCATCG-3′ Reverse: 5′-TGTCCCGGTATTGTAGTCCCA-3′ |
| Setdb1 | Mouse |
Forward: 5′-GGAGGAACTTCGTCAGTACATTG-3′ Reverse: 5′-TCTTTCTGTAGTACCCACGTCTC-3′ |
| SESN2 | Human |
Forward: 5′-AAGGACTACCTGCGGTTCG-3′ Reverse: 5′-CGCCCAGAGGACATCAGTG-3′ |
| Sesn2 | Mouse |
Forward: 5′-GAGTGCCATTCCGAGATCAAG-3′ Reverse: 5′-TAGTCCGGGTGTAGACCCATC-3′ |
| SOD1 | Human |
Forward: 5′-GACTGACTGAAGGCCTGCAT-3′ Reverse: 5′-ATCGGCCACACCATCTTTGT-3′ |
| SOD2 | Human |
Forward: 5′-GGCCTACGTGAACAACCTGA-3′ Reverse: 5′-CCGTTAGGGCTGAGGTTTGT-3′ |
| CATALASE | Human |
Forward: 5′-AGTGATCGGGGGATTCCAGA-3′ Reverse: 5′-AAGTCTCGCCGCATCTTCAA-3′ |
| FIS1 | Human |
Forward: 5′-GTCCAAGAGCACGCAGTTTG-3′ Reverse: 5′-ATGCCTTTACGGATGTCATCATT-3′ |
| DRP1 | Human |
Forward: 5′-CTGCCTCAAATCGTCGTAGTG-3′ Reverse: 5′-GAGGTCTCCGGGTGACAATTC-3′ |
| MFN2 | Human |
Forward: 5′-CTCTCGATGCAACTCTATCGTC-3′ Reverse: 5′-TCCTGTACGTGTCTTCAAGGAA-3′ |
| GAPDH | Human |
Forward: 5′-GGAGCGAGATCCCTCCAAAAT-3′ Reverse: 5′-GGCTGTTGTCATACTTCTCATGG-3′ |
| Gapdh | Mouse |
Forward: 5′-AGGTCGGTGTGAACGGATTTG-3′ Reverse: 5′-GGGGTCGTTGATGGCAACA-3′ |
| SESN2 promoter | Human |
Forward: 5′-GCAGGAGATGGATGTCAAGA-3′ Reverse: 5′-TTTGGTGCTGGACTCTTCCC-3′ |
| Sesn2 promoter | Mouse |
Forward: 5′-CTGGCAGTGTTCAGGGTAAAT-3′ Reverse: 5′-CCTTATCCCTTGGGTTCTGCC-3′ |
|
SESN2 promoter p(-93/ + 479) |
Human |
Forward: 5′-GACCTCTGATTGGCTGGACC-3′ Reverse: 5′-GAGGCTCAGACGCGGTTC-3′ |
|
SESN2 promoter p(-554/-11) |
Human |
Forward: 5′-AAGGCTTTTCCTGAGGCTCC-3′ Reverse: 5′-TCTGACACCAGCAGTTCAGC-3′ |
|
SESN2 promoter p(-927/-490) |
Human |
Forward: 5′-GTGAAGGAAGAGGCTCCGTT-3′ Reverse: 5′-GGGAAGCTCCAAAGATGCGA-3′ |
|
SESN2 promoter p(-1138/-815) |
Human |
Forward: 5′-GCTCAGGGGAGGGTGAGATTA-3′ Reverse: 5′-TCACTTCCTGGCCTTCAACTC-3′ |
|
SESN2 promoter p(-1996/-1013) |
Human |
Forward: 5′-GTGACATAGAGCAGGAGATGG-3′ Reverse: 5′-GATAAGACCCCCAAGTCCCC-3′ |
Real-time quantitative real-time qPCR (RT-qPCR)
Total RNA from kidney tissues or HK-2 cells was extracted using the RNAiso Plus (TaKaRa Biotechnology). Reverse transcriptase reactions were performed using a SuperScript First-strand Synthesis System (Invitrogen). RT-qPCR reactions were performed with GAPDH as internal control. Gene levels were shown as fold change relative to control calculated by the 2 − ΔΔCT method. Primers used for qPCR were listed in Table 1.
Western blot (WB)
The total proteins were extracted using RIPA buffer (BL509A, Biosharp) with protease inhibitor cocktail tablet. The protein were separated by 10–15% SDS–polyacrylamide gel electrophoresis and then transferred onto polyvinylidene difluoride membranes (PVDF; Millipore, USA). Subsequently, the membranes were blocked with 5% skim dry milk for 2 h, following by incubating at 4 °C overnight with corresponding primary antibodies (summarized in Table 2). After washing thrice with Tris-buffered saline with Tween 20 (TBST), the membranes were incubated with secondary goat anti-rabbit or goat anti-mouse antibodies (listed in Table 2) in TBST for 2 h at room temperature. After incubation, the blots were developed by the Chemiluminescent HRP Substrate (WBKLS, Millipore). The intensity of immunoreactive band was analyzed using Image J software (NIH, USA).
Table 2.
The antibodies used in the study
| Proteins | Company | Catalog | Dilution |
|---|---|---|---|
| SETDB1 | Invitrogen | PA5-29,101 | 1:1000(WB), 1:500(IHC), 1:200(IF), 1:100(IP) |
| Sestrin2 | Proteintech | 10,795–1-AP | 1:2000(WB), 1:200(IHC), 1:100(IF) |
| SOD1 | Proteintech | 10,269–1-AP | 1:2000(WB) |
| SOD2 | Proteintech | 24,127–1-AP | 1:2000(WB) |
| Catalase | Proteintech | 21,260–1-AP | 1:1000(WB) |
| FIS1 | Proteintech | 10,956–1-AP | 1:1000(WB), 1:200(IHC) |
| DRP1 | Proteintech | 12,957–1-AP | 1:2000(WB), 1:200(IHC) |
| MFN2 | Proteintech | 12,186–1-AP | 1:5000(WB) |
| GAPDH | Proteintech | 10,494–1-AP | 1:5000(WB) |
| HP1α | Abcam | ab109028 | 1:1000(WB), 1:50(IP) |
| HP1β | Abcam | ab10811 | 1:1000(WB), 1:25(IP) |
| HP1γ | Abcam | ab217999 | 1:30(IP) |
| H3K9me | Abcam | ab176880 | 1:10(IP) |
| H3K9me2 | Abcam | ab1220 | 1:10(IP) |
| H3K9me3 | Abcam | ab8898 | 1:10(IP) |
| H3K9ac | Abcam | ab32129 | 1:1000(WB), 1:10(IP) |
| H3 | Abcam | ab1791 | 1:1000(WB) |
| Flag | Servicebio | GB15938 | 1:1000(WB), 1:50(IP) |
| HA | Servicebio | GB12939 | 1:1000(WB), 1:50(IP) |
| HRP-conjugated Affinipure Goat Anti-Rabbit IgG(H + L) | Proteintech | SA00001-2 | 1:5000(WB) |
| HRP-conjugated Affinipure Goat Anti-Mouse IgG(H + L) | Proteintech | SA00001-1 | 1:5000(WB) |
Immunohistochemistry (IHC)
Paraffin sections of kidney tissues were dewaxed in xylene and then rehydrated in 100%, 90%, and 70% concentrations of alcohol. Immunohistochemical staining was performed with the UltraSensitiveTM SP (mouse/rabbit) IHC Kit (KIT-9710, MXB Biotechnologies). Briefly, tissue sections were subjected to antigen repair, blocking nonspecific binding and blocking, followed by incubation of sections with related primary antibodies (listed in Table 2) were incubated overnight at 4 °C. The secondary antibody was incubated at room temperature the next day and labeled with horseradish peroxidase. Subsequently, DAB was used for color development and the nuclei were restained with hematoxylin. The positive score was calculated using relative mean integrated optical density (IOD) measured by Image-Pro Plus (version 6.0).
Immunofluorescence (IF)
HK-2 cells were spread on cell crawl sheets, and after completing treatment according to experimental needs, they were fixed with 4% paraformaldehyde for 15 min, followed by permeabilization with 0.5% TritonX-100 at room temperature for 10 min, and then closed with 10% goat serum at room temperature for 60 min. Incubate with relevant antibodies (listed in Table 2) overnight at 4 °C. The next day, incubate with the secondary antibody at room temperature and in the dark for 60 min. The nuclei were stained with DAPI before sealing the slices. Subsequently, randomly field of view was observed using a fluorescence microscopy (Olympus IX51).
Hematoxylin and eosin (H&E) staining
Renal tissues were sectioned into 4 μm thickness and then were stained with hematoxylin and eosin. Two experienced renal pathologists, blinded to the groups, performed morphological assessment. The 5-point scale reflected varying degrees of renal tubular injury.
Renal function testing
Blood samples (0.2 ml) were collected and centrifuged to obtain supernatants. According to the manufacturer’s instructions, the levels of blood urea nitrogen (BUN) (NO. C013-2–1) and creatinine (Cr) (NO. C011-2–1) were measured with the relevant kits (Nanjing Jiancheng company, China).
Determination of malondialdehyde (MDA), glutathione (GSH) levels, and superoxide dismutase (SOD) activity
The kidney tissues were homogenized and centrifuged at 12,000 rpm for 20 min at 4 °C. The levels of MDA and GSH and the activity of SOD were evaluated using MDA (S0131S, Beyotime Biotechnology), GSH (S0053, Beyotime Biotechnology), and SOD (S0101S, Beyotime Biotechnology) assay kits according to the manufacturer’s protocols, respectively.
Cell viability assay
A CCK-8 assay kit (Biosharp, Hefei, China) was used to evaluate cell viability following manufacturer’s instructions. HK-2 cells were seeded into 96 well plates at 5 × 10³ cells/well. After different treatments, 10 μl CCK-8 were added to each well and incubated in the dark for 2 h. Then, the cell viability of different treatment groups (treatment group optical density/control group optical density × 100%) was compared by measuring the absorbance at 450 nm with molecular devices (Molecular Devices, USA).
TdT-mediated dUTP Nick-End Labeling (TUNEL)
The apoptotic cells in mouse kidney tissue were evaluated by a TUNEL Assay Kit (C1090, Beyotime Biotechnology) according to the manufacturer’s instructions. The TUNEL positive area was measured using randomly field of view observed by a fluorescence microscopy (Olympus IX51).
Mitochondrial morphology analysis
For in vivo experiments, mouse kidney tissues were observed using transmission electron microscopy (TEM) after fixed with electron microscope fixative (G1102, Servicebio). For in vitro experiments, HK-2 cells were stained using Mito Tracker Red CMXRos (C1035, Beyotime Biotechnology) after spread on cell crawlers.
Flow cytometry
For measurement of apoptosis, HK-2 cells after treatment were stained using Annexin V-FITC/PI apoptosis kit (A01122, Multi Sciences) at room temperature (20–25 °C) in the dark for 10–20 min, and subsequently detected of FITC-A and PE-A signals by Beckman flow cytometry (Beckman Coulter Biotechnology, China).
For measurement of ROS, HK-2 cells after treatment were labeled using MDCFH-DA (S0033S, Beyotime Biotechnology) at 37 °C in the dark for 20 min, and then quantified the count of FITC-A using flow cytometry.
For measurement of mitochondrial membrane potential (MMP), HK-2 cells after treatment were incubated with JC-1 (C2006, Beyotime Biotechnology) at 37 °C in the dark for 20 min. JC-1 complex was reflected by PE-H signal, while JC-1 monomer was reflected by FITC-H signal using flow cytometry.
The relevant data was analyzed by FlowJo (version 10.0, USA) software.
Chromatin immunoprecipitation (ChIP) and re-ChIP
ChIP and re-ChIP were performed according to the established method [42]. The obtained samples were incubated overnight at 4 °C with related antibodies (listed in Table 2). ChIP was performed by using elution buffer (1% SDS, 100 mM NaHCO3) to elute immune complexes, and then using ChIP buffer (1% Triton X-100, 2 mM EDTA, 150 mM NaCl, 20 mM Tris, pH 8.1) to dilute immune complexes. As for Re-ChIP, immunoprecipitation was performed with the second target antibody. ChIP-enriched DNA analyzed by qPCR with the primers in Table 1. Primers designed for ChIP analysis were ranged from − 2000 bp to transcription start site (TSS), which was obtained from www.ncbi.nlm.nih.gov/gene.
Coimmunoprecipitation (CoIP)
The protein samples obtained from specific experiments were incubated with corresponding antibodies (listed in Table 2) overnight. Protein A/G agarose beads were introduced and incubated with agitation for 2 h at 4 °C. Non-specific binding proteins and impurities were removed by washing multiple times with buffer solution (0.1% SDS, 500 mM NaCl, 1% NP40, 0.02% NaN3, pH 7.5). The proteins bound to the beads were eluted using elution buffer (0.1 M glycine–HCl, pH 2.5) and subsequently analyzed through immunoblotting (IB) using the specified antibodies.
Luciferase reporter assays
Sangon Biotech (Shanghai, China) designed and synthesized the SESN2 promoter reporter vector. Reporter gene plasmids and transcription factor expression plasmids were co-transfected in cells using Lipofectamine 3000 reagent (Invitrogen, Carlsbad, CA, USA), according to the manufacturer’s instructions. HK-2 cells were subjected to H/R after 48 h of transfection. A dual-luciferase reporter assay system (Promega, Madison, WI, USA) was used to detect luciferase activity.
Statistical analysis
Statistical analysis was performed using GraphPad Prism software (version 8.0, USA); all data were expressed as the mean ± standard error of mean (SEM). More than three replicates for each experimental operation. The difference between two groups was assessed by Student’s t-test. Multiple comparisons were evaluated using ANOVA with Tukey–Kramer test. Statistical significance was determined at p < 0.05.
Supplementary Information
Additional file 1: Supplementary Fig. S1 (A) WB detection of H3K9me3 protein levels in mice kidney tissues. (B) Representative images of HE staining in mice kidney tissues (up) and related quantitative analysis (down). Bar = 50 μm. (C) Detection of Cr and BUN in mice serum. (D) Cell viability detected by CCK8 upon H/R stimulation in the indicated groups. Values are expressed as the mean ± SEM. N = 3. The ** represents differences between groups, and p < 0.01. The ns represents no differences between groups. Supplementary Fig. S2 (A) mRNA and protein levels of SETDB1 in HK-2 cells of knockdown (KD) group and negative control (NC) group. (B) mRNA and protein levels of SESN2 in renal tissues of knockdown (KD) group and negative control (NC) group. Values are expressed as the mean ± SEM. N = 3. The ** represents differences between groups, and p < 0.01. Supplementary Fig. S3 (A) ChIP detection of the enrichment of SETDB1, H3K9me1, H3K9me2, H3K9me3, and H3K9ac on GAPDH in vivo. (B) ChIP detection of SETDB1, H3K9me3, and H3K9ac on GAPDH in vitro. Values are expressed as the mean ± SEM. N = 3. The ns represents no differences between groups.
Additional file 2: Original western blots shown in the figure.
Acknowledgements
Figure 9 was created by Figdraw (www.figdraw.com).
Abbreviations
- ATP
Adenosine-triphosphate
- AMPK
AMP-dependent protein kinase
- BUN
Blood urea nitrogen
- ChIP
Chromatin immunoprecipitation
- CoIP
Coimmunoprecipitation
- Cr
Creatinine
- DCFH-DA
Dichlorodihydrofluorescein diacetate
- DMSO
Dimethyl sulfoxide
- GSH
Glutathione
- H3K9
Histone H3 at lysine 9
- HE
Hematoxylin and eosin
- HK-2
Human proximal renal tubular epithelial cells
- HMT
Histone methyltransferase
- H/R
Hypoxia-reoxygenation (H/R)
- IF
Immunofluorescence
- IHC
Immunohistochemistry
- I/R
Ischemia-reperfusion
- MDA
Malondialdehyde
- MMP
Mitochondrial membrane potential
- mTORC1
Mammalian target of rapamycin complex 1
- ROS
Reactive oxygen species
- RT-qRCR
Real-time quantitative PCR
- SEM
Standard error of the mean
- SESN2
Sestrin2
- SOD
Superoxide dismutase
- TEM
Transmission electron microscopy
- TUNEL
DUTP Nick-End Labeling
- WB
Western blot
Authors’ contributions
K.X, L.W, and ZY.C conceived and designed the study. QM.Q, JC.Z, and H.C collected samples. K.X, YM.H, and L.Z analyzed and interpreted the data. K.X and L.Z wrote the manuscript draft. XH.L, L.W, and ZY.C provided funding support. All authors read, revised, and approved the final manuscript.
Funding
This study was supported by the National Natural Science Foundation of China (No. 82372200 and No. 82000639).
Data availability
All data generated or analyzed during this study are included in this published article and its supplementary information files, or are available from the corresponding author on reasonable request. The gene expression profile (GSE43974, GSE90861, GSE126805) were downloaded from GEO (https://www.ncbi.nlm.nih.gov/geo/), and the ChIP dataset (SRX5347751, SRX10987311, SRX10987323, SRX10987324) were obtained from ChIP-Atlas (chip-atlas.org).
Declarations
Ethics approval and consent to participate
The procedures were performed in accordance with the principles of Animal Care of Wuhan University (Wuhan, China). This study was approved by the Laboratory Animal Committee of Wuhan University (IACUC Issue NO. 20230304B).
Consent for publication
Not applicable.
Competing interests
The authors declare that they have no conflict of interests.
Footnotes
Publisher’s Note
Springer Nature remains neutral with regard to jurisdictional claims in published maps and institutional affiliations.
Kang Xia, Yumin Hui, and Long Zhang contributed equally to this work.
Contributor Information
Xiuheng Liu, Email: drliuxh@hotmail.com.
Lei Wang, Email: drwanglei@whu.edu.cn.
Zhiyuan Chen, Email: chenzhiyuan163@163.com.
References
- 1.Kwong AM, Luke PPW, Bhattacharjee RN. Carbon monoxide mechanism of protection against renal ischemia and reperfusion injury. Biochem Pharmacol. 2022;202:115156. [DOI] [PubMed] [Google Scholar]
- 2.Lerink LJS, de Kok MJC. Preclinical models versus clinical renal ischemia reperfusion injury: a systematic review based on metabolic signatures. Am J Transplant. 2022;22(2):344–70. [DOI] [PMC free article] [PubMed] [Google Scholar]
- 3.Najafi H, Abolmaali SS, Heidari R, Valizadeh H, Tamaddon AM, Azarpira N. Integrin receptor-binding nanofibrous peptide hydrogel for combined mesenchymal stem cell therapy and nitric oxide delivery in renal ischemia/reperfusion injury. Stem Cell Res Ther. 2022;13(1):344. [DOI] [PMC free article] [PubMed] [Google Scholar]
- 4.Zhang G, Han H, Zhuge Z, Dong F, Jiang S, Wang W, Guimarães DD, Schiffer TA, Lai EY, Ribeiro Antonino Carvalho LR, et al. Renovascular effects of inorganic nitrate following ischemia-reperfusion of the kidney. Redox Biol. 2021;39:101836. [DOI] [PMC free article] [PubMed] [Google Scholar]
- 5.Zhao M, Wang Y, Li L, Liu S, Wang C, Yuan Y, Yang G, Chen Y, Cheng J, Lu Y, et al. Mitochondrial ROS promote mitochondrial dysfunction and inflammation in ischemic acute kidney injury by disrupting TFAM-mediated mtDNA maintenance. Theranostics. 2021;11(4):1845–63. [DOI] [PMC free article] [PubMed] [Google Scholar]
- 6.Cai Y, Huang C, Zhou M, Xu S, Xie Y, Gao S, Yang Y, Deng Z, Zhang L, Shu J, et al. Role of curcumin in the treatment of acute kidney injury: research challenges and opportunities. Phytomedicine. 2022;104:154306. [DOI] [PubMed] [Google Scholar]
- 7.Xia K, Qiu T, Jian Y, Liu H, Chen H, Liu X, Chen Z, Wang L. Degradation of histone deacetylase 6 alleviates ROS-mediated apoptosis in renal ischemia-reperfusion injury. Biomed Pharmacother. 2023;165:115128. [DOI] [PubMed] [Google Scholar]
- 8.Strepkos D, Markouli M. Histone methyltransferase SETDB1: a common denominator of tumorigenesis with therapeutic potential. Cancer Res. 2021;81(3):525–34. [DOI] [PubMed] [Google Scholar]
- 9.Wu J, Li J. Atf7ip and Setdb1 interaction orchestrates the hematopoietic stem and progenitor cell state with diverse lineage differentiation. Proc Natl Acad Sci 2023;120(1):e2209062120. [DOI] [PMC free article] [PubMed] [Google Scholar]
- 10.Griffin GK, Wu J, Iracheta-Vellve A. Epigenetic silencing by SETDB1 suppresses tumour intrinsic immunogenicity. Nature. 2021;595(7866):309–14. [DOI] [PMC free article] [PubMed] [Google Scholar]
- 11.Južnić L, Peuker K, Strigli A, Brosch M, Herrmann A, Häsler R, Koch M, Matthiesen L, Zeissig Y, Löscher BS. SETDB1 is required for intestinal epithelial differentiation and the prevention of intestinal inflammation. Gut. 2021;70(3):485–98. [DOI] [PMC free article] [PubMed] [Google Scholar]
- 12.Markouli M, Strepkos D, Chlamydas S, Piperi C. Histone lysine methyltransferase SETDB1 as a novel target for central nervous system diseases. Prog Neurobiol. 2021;200:101968. [DOI] [PubMed] [Google Scholar]
- 13.Zhang SM, Cai WL, Liu X, Thakral D, Luo J, Chan LH, McGeary MK. KDM5B promotes immune evasion by recruiting SETDB1 to silence retroelements. Nature. 2021;598(7882):682–7. [DOI] [PMC free article] [PubMed] [Google Scholar]
- 14.Xia K, Wang T, Chen Z, Guo J, Yu B, Chen Q, Qiu T, Zhou J. Hepatocellular SETDB1 regulates hepatic ischemia-reperfusion injury through targeting lysine methylation of ASK1 signal. Research (Wash D C). 2023;6:0256. [DOI] [PMC free article] [PubMed] [Google Scholar]
- 15.Ikenoue M, Choijookhuu N, Yano K, Fidya Takahashi N, Ishizuka T, Shirouzu S, Yamaguma Y, Kai K, Higuchi K, et al. The crucial role of SETDB1 in structural and functional transformation of epithelial cells during regeneration after intestinal ischemia reperfusion injury. Histochem Cell Biol. 2024;161(4):325–36. [DOI] [PubMed] [Google Scholar]
- 16.Wolfson RL, Chantranupong L, Saxton RA, Shen K, Scaria SM, Cantor JR, Sabatini DM. Sestrin2 is a leucine sensor for the mTORC1 pathway. Science (New York, NY). 2016;351(6268):43–8. [DOI] [PMC free article] [PubMed] [Google Scholar]
- 17.Piochi LF, Machado IF, Palmeira CM, Rolo AP. Sestrin2 and mitochondrial quality control: potential impact in myogenic differentiation. Ageing Res Rev. 2021;67:101309. [DOI] [PubMed] [Google Scholar]
- 18.Yang Y, Cuevas S, Yang S, Villar VA, Escano C, Asico L, Yu P, Jiang X, Weinman EJ, Armando I, et al. Sestrin2 decreases renal oxidative stress, lowers blood pressure, and mediates dopamine D2 receptor-induced inhibition of reactive oxygen species production. Hypertension (Dallas, Tex : 1979). 2014;64(4):825–32. [DOI] [PMC free article] [PubMed] [Google Scholar]
- 19.Song S, Shi C, Bian Y, Yang Z, Mu L, Wu H. Sestrin2 remedies podocyte injury via orchestrating TSP-1/TGF-β1/Smad3 axis in diabetic kidney disease. Cell Death Dis. 2022;13(7):663. [DOI] [PMC free article] [PubMed] [Google Scholar]
- 20.Wang BJ, Wang S, Xiao M, Zhang J, Wang AJ, Guo Y, Tang Y, Gu J. Regulatory mechanisms of Sesn2 and its role in multi-organ diseases. Pharmacol Res. 2021;164:105331. [DOI] [PubMed] [Google Scholar]
- 21.Che X, Chai J, Fang Y, Zhang X, Zu A, Li L, Sun S. Sestrin2 in hypoxia and hypoxia-related diseases. Redox Rep. 2021;26(1):111–6. [DOI] [PMC free article] [PubMed] [Google Scholar]
- 22.Montanaro A, Kitara S, Cerretani E, Marchesini M, Rompietti C, Pagliaro L, Gherli A, Su A, Minchillo ML, Caputi M, et al. Identification of an Epi-metabolic dependency on EHMT2/G9a in T-cell acute lymphoblastic leukemia. Cell Death Dis. 2022;13(6):551. [DOI] [PMC free article] [PubMed] [Google Scholar]
- 23.Machida S, Takizawa Y, Ishimaru M, Sugita Y, Sekine S, Nakayama JI, Wolf M, Kurumizaka H. Structural basis of heterochromatin formation by human HP1. Mol Cell. 2018;69(3):385-397.e388. [DOI] [PubMed] [Google Scholar]
- 24.Lorenzen JM, Batkai S, Thum T. Regulation of cardiac and renal ischemia-reperfusion injury by microRNAs. Free Radic Biol Med. 2013;64:78–84. [DOI] [PubMed] [Google Scholar]
- 25.Mohamed ME, Elmorsy MA. Renal ischemia/reperfusion mitigation via geraniol: the role of Nrf-2/HO-1/NQO-1 and TLR2,4/MYD88/NFκB pathway. Antioxidants. 2022;11(8):1568. [DOI] [PMC free article] [PubMed] [Google Scholar]
- 26.Jiang Z, Hu Z, Zeng L, Lu W, Zhang H, Li T, Xiao H. The role of the Golgi apparatus in oxidative stress: is this organelle less significant than mitochondria? Free Radical Biol Med. 2011;50(8):907–17. [DOI] [PubMed] [Google Scholar]
- 27.Granata S, Votrico V, Spadaccino F, Catalano V, Netti GS. Oxidative stress and ischemia/reperfusion injury in kidney transplantation: focus on ferroptosis, mitophagy and new antioxidants. Antioxidants (Basel). 2022;11(4):769. [DOI] [PMC free article] [PubMed] [Google Scholar]
- 28.Glinton KE, Ma W, Lantz C, Grigoryeva LS, DeBerge M, Liu X, Febbraio M, Kahn M, Oliver G, Thorp EB. Macrophage-produced VEGFC is induced by efferocytosis to ameliorate cardiac injury and inflammation. J Clin Investig. 2022;132(9):e140685. [DOI] [PMC free article] [PubMed] [Google Scholar]
- 29.Cao H, Cheng Y, Gao H, Zhuang J, Zhang W, Bian Q, Wang F, Du Y, Li Z. In vivo tracking of mesenchymal stem cell-derived extracellular vesicles improving mitochondrial function in renal ischemia-reperfusion injury. ACS Nano. 2020;14(4):4014–26. [DOI] [PubMed] [Google Scholar]
- 30.Lee JH, Demarest TG, Babbar M, Kim EW, Okur MN, De S, Croteau DL, Bohr VA. Cockayne syndrome group B deficiency reduces H3K9me3 chromatin remodeler SETDB1 and exacerbates cellular aging. Nucleic Acids Res. 2019;47(16):8548–62. [DOI] [PMC free article] [PubMed] [Google Scholar]
- 31.Li J, Zheng S, Dong Y, Xu H, Zhu Y, Weng J, Sun D, Wang S, Xiao L, Jiang Y. Histone methyltransferase SETDB1 regulates the development of cortical Htr3a-positive interneurons and mood behaviors. Biol Psychiatry. 2023;93(3):279–90. [DOI] [PubMed] [Google Scholar]
- 32.Padeken J, Methot SP. Establishment of H3K9-methylated heterochromatin and its functions in tissue differentiation and maintenance. Nat Rev Mol Cell Biol. 2022;23(9):623–40. [DOI] [PMC free article] [PubMed] [Google Scholar]
- 33.Adoue V, Binet B, Malbec A, Fourquet J, Romagnoli P, van Meerwijk JPM, Amigorena S, Joffre OP. The histone methyltransferase SETDB1 controls T helper cell lineage integrity by repressing endogenous retroviruses. Immunity. 2019;50(3):629-644.e628. [DOI] [PubMed] [Google Scholar]
- 34.Koide S, Oshima M, Takubo K, Yamazaki S, Nitta E, Saraya A, Aoyama K, Kato Y, Miyagi S, Nakajima-Takagi Y, et al. Setdb1 maintains hematopoietic stem and progenitor cells by restricting the ectopic activation of nonhematopoietic genes. Blood. 2016;128(5):638–49. [DOI] [PubMed] [Google Scholar]
- 35.Cao N, Yu Y, Zhu H, Chen M, Chen P, Zhuo M, Mao Y, Li L, Zhao Q, Wu M. SETDB1 promotes the progression of colorectal cancer via epigenetically silencing p21 expression. Cell Death Dis. 2020;11(5):351. [DOI] [PMC free article] [PubMed] [Google Scholar]
- 36.Xu R, Li S, Wu Q, Li C, Jiang M, Guo L, Chen M, Yang L, Dong X, Wang H, et al. Stage-specific H3K9me3 occupancy ensures retrotransposon silencing in human pre-implantation embryos. Cell Stem Cell. 2022;29(7):1051-1066.e1058. [DOI] [PubMed] [Google Scholar]
- 37.Nicetto D, Donahue G, Jain T, Peng T, Sidoli S. H3K9me3-heterochromatin loss at protein-coding genes enables developmental lineage specification. Science. 2019;363(6424):294–7. [DOI] [PMC free article] [PubMed] [Google Scholar]
- 38.Maeda R, Tachibana M. HP1 maintains protein stability of H3K9 methyltransferases and demethylases. EMBO Rep. 2022;23(4):e53581. [DOI] [PMC free article] [PubMed] [Google Scholar]
- 39.Liu H, Wang L, Weng X, Chen H, Du Y, Diao C, Chen Z, Liu X. Inhibition of Brd4 alleviates renal ischemia/reperfusion injury-induced apoptosis and endoplasmic reticulum stress by blocking FoxO4-mediated oxidative stress. Redox Biol. 2019;24:101195. [DOI] [PMC free article] [PubMed] [Google Scholar]
- 40.Liu H, Wang W, Weng X, Chen H, Chen Z, Du Y, Liu X, Wang L. The H3K9 histone methyltransferase G9a modulates renal ischemia reperfusion injury by targeting Sirt1. Free Radic Biol Med. 2021;172:123–35. [DOI] [PubMed] [Google Scholar]
- 41.Xia K, Guo J, Yu B, Wang T, Qiu Q, Chen Q, Qiu T, Zhou J, Zheng S. Sentrin-specific protease 1 maintains mitochondrial homeostasis through targeting the deSUMOylation of sirtuin-3 to alleviate oxidative damage induced by hepatic ischemia/reperfusion. Free Radical Biol Med. 2023;210:378–89. [DOI] [PubMed] [Google Scholar]
- 42.Zhang Y, Xue W, Zhang W. Histone methyltransferase G9a protects against acute liver injury through GSTP1. Cell Death Differ. 2020;27(4):1243–58. [DOI] [PMC free article] [PubMed] [Google Scholar]
Associated Data
This section collects any data citations, data availability statements, or supplementary materials included in this article.
Supplementary Materials
Additional file 1: Supplementary Fig. S1 (A) WB detection of H3K9me3 protein levels in mice kidney tissues. (B) Representative images of HE staining in mice kidney tissues (up) and related quantitative analysis (down). Bar = 50 μm. (C) Detection of Cr and BUN in mice serum. (D) Cell viability detected by CCK8 upon H/R stimulation in the indicated groups. Values are expressed as the mean ± SEM. N = 3. The ** represents differences between groups, and p < 0.01. The ns represents no differences between groups. Supplementary Fig. S2 (A) mRNA and protein levels of SETDB1 in HK-2 cells of knockdown (KD) group and negative control (NC) group. (B) mRNA and protein levels of SESN2 in renal tissues of knockdown (KD) group and negative control (NC) group. Values are expressed as the mean ± SEM. N = 3. The ** represents differences between groups, and p < 0.01. Supplementary Fig. S3 (A) ChIP detection of the enrichment of SETDB1, H3K9me1, H3K9me2, H3K9me3, and H3K9ac on GAPDH in vivo. (B) ChIP detection of SETDB1, H3K9me3, and H3K9ac on GAPDH in vitro. Values are expressed as the mean ± SEM. N = 3. The ns represents no differences between groups.
Additional file 2: Original western blots shown in the figure.
Data Availability Statement
All data generated or analyzed during this study are included in this published article and its supplementary information files, or are available from the corresponding author on reasonable request. The gene expression profile (GSE43974, GSE90861, GSE126805) were downloaded from GEO (https://www.ncbi.nlm.nih.gov/geo/), and the ChIP dataset (SRX5347751, SRX10987311, SRX10987323, SRX10987324) were obtained from ChIP-Atlas (chip-atlas.org).


