

Abstract
Background
Crohn’s disease (CD) is characterized by chronic intestinal inflammation. Diet is a key modifiable factor influencing the gut microbiome (GM) and a risk factor for CD. However, the impact of diet modulation on GM function in CD patients is understudied. Herein, we evaluated the effect of a high-fiber, low-fat diet (the Mi-IBD diet) on GM function in CD patients. All participants were instructed to follow the Mi-IBD diet for 8 weeks. One group of CD patients received one-time diet counseling only (Gr1); catered food was supplied for the other three groups, including CD patients (Gr2) and dyads of CD patients and healthy household controls (HHCs) residing within the same household (Gr3-HHC dyads). Stool samples were collected at baseline, week 8, and week 36, and analyzed by liquid chromatography-tandem mass spectrometry.
Results
At baseline, the metaproteomic profiles of CD patients and HHCs differed. The Mi-IBD diet significantly increased carbohydrate and iron transport and metabolism. The predicted microbial composition underlying the metaproteomic changes differed between patients with ileal only disease (ICD) or colonic involvement: ICD was characterized by decreased Faecalibacterium abundance. Even on the Mi-IBD diet, the CD patient metaproteome displayed significant underrepresentation of carbohydrate and purine/pyrimidine synthesis pathways compared to that of HHCs. Human immune-related proteins were upregulated in CD patients compared to HHCs.
Conclusions
The Mi-IBD diet changed the microbial function of CD patients and enhanced carbohydrate metabolism. Our metaproteomic results highlight functional differences in the microbiome according to disease location. Notably, our dietary intervention yielded the most benefit for CD patients with colonic involvement compared to ileal-only disease.
Video Abstract
Supplementary Information
The online version contains supplementary material available at 10.1186/s40168-024-01927-5.
Keywords: Crohn’s disease, Diet intervention, Gut microbiota, Metaproteomics, Functional analysis
Background
Crohn’s disease (CD) is an inflammatory bowel disease (IBD) that is characterized by transmural inflammation of the gastrointestinal tract, most commonly affecting the terminal ileum and colon [1]. Development of CD involves genetic susceptibility, a dysregulated immune response, epithelial barrier dysfunction, and an altered microbiome [2]. Diet is another epidemiologic risk factor, with a higher amount of ultra-processed foods and animal fats linked to increased CD risk [3–5]. Diet also impacts the microbiome and represents a point of intervention to potentially deter the development of CD [6]. Importantly, treatment of CD has been revolutionized by the advent of biologic and small molecule (JAK inhibitor) therapies, which heal intestinal ulcerations and improve clinical symptoms yet do not fully restore quality of life [7, 8].
Unfortunately, we still lack the ability to translate microbiome findings into an actionable treatment strategy. As many as 80–89% of patients seek dietary advice to alleviate their CD symptoms [9]. Several recent studies have carefully studied the impact of a therapeutic diet on clinical symptoms of CD with parallel examination of the microbiome [10]. They demonstrated that consumption of certain diets (the specific carbohydrate diet (SCD), exclusive enteral nutrition (EEN), or the CD treatment-with-eating diet (CD-TREAT)) alters the abundance of bacteria, reduces levels of fecal calprotectin (a marker of intestinal inflammation), and can reduce symptoms or even achieve remission [11, 12]. Notably, the various bacterial taxa influenced by these dietary interventions included species from the Firmicutes phylum—a phylum that contains many bacteria that produce short-chain fatty acids (SCFAs), such as Faecalibacterium prausnitzii and species that are known pathobionts, such as Escherichia coli. In an earlier diet intervention study, we provided a high-fiber, low-fat diet (the Mi-IBD diet) to ulcerative colitis (UC) patients [13]. UC patients demonstrated more improvements in biochemical parameters following the Mi-IBD diet than after following a standard American diet. Our microbiome data demonstrated that the Mi-IBD diet increased the abundance of Prevotella, a commensal bacteria.
While the gut microbiota is altered in CD, the exact nature of the complex host-microbiota relationship remains unclear. Earlier studies using 16S rRNA gene sequencing as well as metagenomic sequencing of stool have reported lower diversity of the bacterial community in patients with CD than in healthy individuals, including a lower abundance of Firmicutes [14–17]. Several studies have examined differences in mucosa-associated bacteria by region of the bowel. In healthy individuals, there is substantial spatial heterogeneity in the mucosa-associated microbiota throughout the intestine (biopsies taken from sites including the terminal ileum, four different regions of the colon, and rectum) [18]. This spatial heterogeneity is shaped by oxygen, pH, and glycan gradients [19]. Thus, the location affected by IBD in patients likely has differential effects on the microbiome. Indeed, CD patients were found to exhibit alterations of the mucosa-associated microbiome in the ileum and colon that predicted subsequent ileal inflammation [20]. However, the functional differences in the microbiome between healthy individuals and people with CD have not yet been fully characterized.
Whereas proteomics describes all proteins produced by one organism, metaproteomics characterizes all proteins produced by a microbial community containing a multitude of organisms (e.g., the gut microbiome). Thus, metaproteomic analyses provide a window into the function of the gut microbiota, revealing key changes in metabolic and cellular functions as well as interactions between the gut metaproteome and the host proteome [21, 22]. Although multi-omic analyses are relatively new in the field of CD, with only a dozen such publications to date, a principal finding emerging from these studies is that the gut microbial signature of CD includes a depletion of Firmicutes and decreases in their related functions [23–32]. Dietary interventions have also been shown to influence the metaproteome in a pediatric CD population [11]. However, few metaproteomic studies of CD patients have been longitudinal and conducted in a protocolized way and none have included comprehensive dietary information to permit analysis of the functional microbiome effects.
In the current study, we wanted to examine the metaproteome of patients with CD in the context of a controlled diet intervention. To date, no diet intervention studies in CD have examined the effect on the metaproteome. We aimed to assess how the metaproteome diet-induced changes varied between patients with CD versus healthy household controls (HHCs) eating the same diet. Finally, we were interested in longitudinal shifts in the metaproteome of CD patients, since little is known about the stability of the metaproteome over time in this population. To achieve these aims, we leveraged stool samples collected from CD patients and HHCs who participated in a previous dietary intervention. CD patients and HHCs were given catered high-fiber, low-fat meals for 8 weeks or simply given dietary advice. Samples were collected at baseline, immediately following the catered portion of the study (week 8) and then again when patients had returned to eating their baseline diets (week 36). Our study allows us to look at the relationship between diet and changes in the metaproteome while accounting for inflammatory state, disease phenotype (fibrostenotic, inflammatory, perforating), and disease location. The results of our study provide foundational information for understanding the functional deficits of the metaproteome in CD and the ability to mold this through a carefully designed diet.
Materials and methods
Study design
The present study involved an analysis of data collected during a study that evaluated the effect of a short-term diet intervention (the Mi-IBD diet) on the outcomes of CD patients [33]. Recruitment and study completion occurred between January 7, 2020, and July 10, 2023. Adult CD patients (aged 18–70 years) were eligible for inclusion if they had mild/moderate or inactive disease (score on the Short Crohn’s Disease Activity Index (sCDAI) of less than 400), stable medication for 2–4 weeks prior to baseline (depending on the medication used), and no antibiotic or probiotic use within 2 weeks prior to screening. Notably, the affected location can vary across CD patients and is associated with differential risks, microbiome alterations, and health outcomes [34–38]; thus, we also recorded details regarding disease phenotype (Montreal classification, disease location; Fig. 1).
Fig. 1.
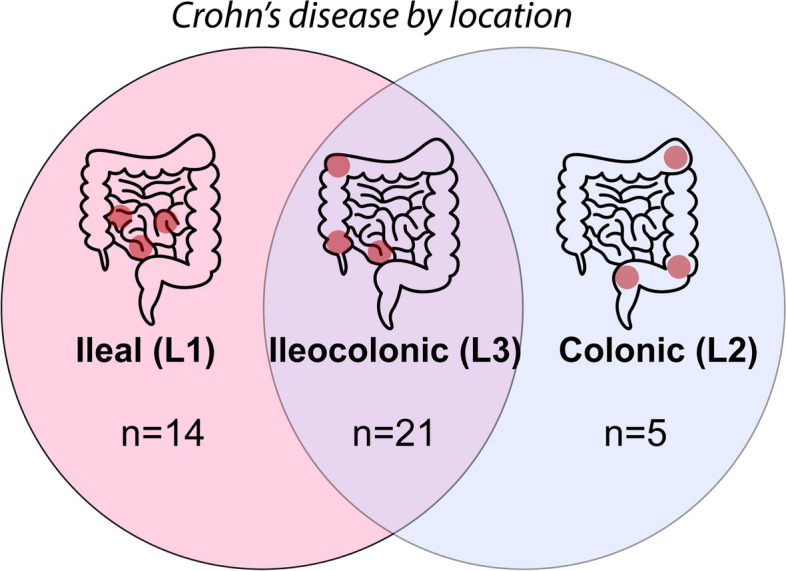
Differences in CD phenotype according to disease location. Numbers reflect the distribution of patients in the current study
Subjects were divided into four main groups, with three groups consisting of CD patients and one group consisting of HHCs. Group 1 (Gr1) received a one-time diet counseling session describing the recommended Mi-IBD diet but selected food for themselves thereafter. Group 2 (Gr2), group 3 (Gr3), and the HHC group received the catered Mi-IBD diet for 8 weeks. Subjects from Gr3 and the HHC group additionally received dyadic psychosocial support during the intervention. Further details about the exclusion criteria and the dyadic psychosocial support intervention are provided in Additional file 1. Stool samples were collected at baseline, week 8, and week 36 and stored at − 80 °C until processing.
Diet intervention
The Mi-IBD diet included breakfast, lunch, dinner, and snacks and was provided by national catering companies that used minimally processed, high-quality ingredients. The catered meals and snacks met 100% of the participants’ nutritional needs considering their body mass index, age, gender, and physical activity levels. Catered meals had approximately 20% calories from fat, a target omega-6/omega-3 fatty acid ratio of 1:1, and 25–35 g of fiber per day. Further details have been provided elsewhere [33].
Sample processing and LC–MS/MS analysis
Stool samples were processed as follows. Protein extraction and tryptic digestion were performed with 300 mg of fecal material as previously described [39]. In brief, the bacterial pellet was isolated through differential centrifugation and proteins were extracted by resuspending it in 300 μL of lysis buffer (4% SDS, 100 mM dithiothreitol in 50 mM Tris–HCl, at pH 8) and performing sonication with a probe (VCX 130 VibraCell Ultrasonic Liquid Processor, Sonics & Materials Inc, Newtown, CT, USA), applying 25% amplitude for 3 cycles of 30 s. The protein content was measured with the 2D QuanKit (GE Healthcare, Chicago, Illinois, USA), and enzymatic digestion of 50 μg of proteins was conducted with the filter-aided sample preparation procedure [40]. Sequencing-grade trypsin (Promega, Milan, Italy) was used as a proteolytic enzyme at a 1:50 ratio with respect to the proteins. The recovered tryptic peptide solution was dried by speedvac, and the pellet was suspended in a 2% acetonitrile, 1% trifluoroacetic acid aqueous solution. The total peptide concentration was measured by spectrophotometry (NanoDrop 2000, Thermo Fisher Scientific), using a standard curve of E. coli digest (Waters, Milford, USA).
Peptides (3.2 μg) were desalted and focused on line with a C18 μ-precolumn cartridge and then separated by nanoHPLC using a 500-mm packed C18 column on an UltiMate3000 RSLCnano system, as previously described [39]. A linear gradient was applied, ramping from 5 to 25% acetonitrile (ACN) in H2O (0.1% formic acid was present in the mobile phases) over 150 min, followed by a second 5-min step up to 95% ACN, which was maintained for 5 min, to clean the column. Eluted compounds were ionized on the EASY-Spray NG source of a Tribrid Orbitrap Fusion mass spectrometer (Thermo Fisher Scientific, USA). The acquisition method was set as a data-dependent analysis for label-free quantification (LFQ). In the present study, data acquisition was performed using the Orbitrap analyzer (120 K resolution) for precursor ion detection (MS1) and the linear ion trap to scan HCD fragments (MS2), setting a dynamic exclusion of 10 s after a single MS2 scan on a selected precursor. Two technical replicates were recorded for each sample.
Metaproteomic bioinformatics pipeline
Raw data were processed with MetaLab software (desktop version 2.3) and MaxQuant (version 2.1.3, not embedded in the application) to build a sample-specific database (SSDB). We started from the “integrated reference catalog of the human gut microbiome” database (IGC DB; http://meta.genomics.cn/), which is the best available option for stool metaproteomics in the absence of a metagenomics-derived database (DB) [41]. An automated bioinformatics pipeline was applied as illustrated in Fig. S1, modifying the version already employed elsewhere [39]. In brief, a first SSDB was obtained by MetaLab via preliminary spectra clustering, followed by application of the MetaProIQ iterative strategy [42, 43]. The resulting SSDB was further reduced by removing less represented accession codes (ACs) from the IGC fasta file. Namely, a search was performed on the SSDB for each sample using Proteome Discoverer 2.5 (Thermo Fisher Scientific) to retrieve the lists of ACs detected, without filtering the identification entries. ACs not detected in at least 5% of the whole sample set were subsequently filtered out to reduce the SSDB size from 419 MB (68,4081 entries) to 219 MB (43,2056 entries). The reduced SSDB was then used to perform the final protein identification (ID) and LFQ in MaxQuant. Carbamidomethylation of cysteine was set as a fixed modification, while protein N-term acetylation and oxidation of methionine were set as variable modifications. Output files were returned into MetaLab and merged together to yield a single informative matrix reporting the normalized MaxLFQ intensity values for each protein group (PG), the functional annotation, and the taxonomy, as assigned by the lowest common ancestor (LCA) algorithm.
The resulting PG list was reduced by excluding PGs not identified by at least two unique peptides and those sharing peptides with host proteins. The matrix was refined by removing PGs with valid values in < 50% of the whole dataset or within a subject group, depending on the analysis performed. Data were further normalized by a log10 transformation [44]. Missing values were replaced using an imputation strategy based on a statistical model, combining missing-at-random and missing not-at-random values [45].
Host proteins were identified by searching against the UniProtKB/Swiss-Prot “Homo sapiens” DB (version 2022_01) and analyzed separately. In this analysis, we included only proteins detected in ≥ 25% of all samples before imputing values due to the low number of entries and the presence of more missing values in the HHC group. Using a higher threshold (e.g., 50%) could have lost inflammatory proteins not present in the HHCs.
Statistical analyses
Analyses were performed with R version 4.3 (R Core Team, 2021). β-diversity was calculated with the Bray–Curtis index, and principal coordinate analysis plots were generated to display the results. Permutational multivariate analysis of variance (PERMANOVA) was used to evaluate the association between β-diversity and confounding factors using the “vegan” R package. First, data normality was evaluated with the Shapiro–Wilk test. Comparisons of bacterial PGs involved a t test to detect significant differences in the LFQ-intensity ratio. For dependent data (e.g., comparisons of groups across time points), paired t tests were applied. Only PGs with fold-change values ≥ 1.60 and ≤ 0.63 were included. Significance was determined with a p value threshold of ≤ 0.05.
For comparisons of human proteins, the Wilcoxon-Mann–Whitney test (a non-parametric, two-tailed test) was used to detect significant differences in the abundance ratio (calculated in the LFQ analysis) when comparing two groups. Functional annotation and enrichment analysis were performed with the Metascape web application [46].
Results
Study design
Stool samples from 70 participants (48 CD patients and 22 HHCs) that were collected at baseline, week 8 (at the end of catering), and week 36 (after an ad libitum diet), were analyzed by liquid chromatography-tandem mass spectrometry (LC–MS/MS). A total of 209 stool samples were processed because a CD patient in Gr1 had a missing stool sample at week 36. Samples that yielded fewer than 2000 identified bacterial PGs were excluded from the subsequent analyses. Individuals missing results for baseline or week 8 were discarded because those two time points were the primary focus, whereas those missing results for week 36 were retained (Fig. 2). The final number of subjects included in the analysis was reduced to 63 (34 males and 29 females, aged 21 to 66 years; Table 1).
Fig. 2.

Participant sample sizes and experimental flowchart. Illustration created using icons from BioRender and Noun Project
Table 1.
Demographic and clinical characteristics of participants analyzed (n = 62)
|
Group 1 (n = 9) |
Group 2 (n = 13) |
Group 3 (n = 19) |
HHCs (n = 21) |
|
|---|---|---|---|---|
| Age, median (range) | 33 (23–57) | 27 (22–66) | 34 (23–64) | 37 (25–68) |
| Female, n (%) | 7 (77.8%) | 6 (46%) | 8 (42.1%) | 12 (57.1%) |
| Race, n (%) | ||||
| White | 9 (100%) | 11 (84.6%) | 17 (89.5%) | 16 (76.2%) |
| Black | 0 | 0 | 0 | 1 (4.8%) |
| Asian | 0 | 2 (15.4%) | 2 (10.5%) | 4 (19%) |
| Ethnicity, n (%) | ||||
| Hispanic | 4 (44.4%) | 8 (61.5%) | 7 (36.8%) | 6 (28.6%) |
| Non-Hispanic | 5 (55.6%) | 5 (38.5%) | 11 (57.9%) | 15 (71.4%) |
| Birth country, n (%) | ||||
| USA | 5 (55.6%) | 7 (53.8%) | 12 (63.2%) | 9 (42.9%) |
| Other | 4 (44.4%) | 6 (46.2%) | 7 (36.8%) | 12 (57.1%) |
| Age at diagnosis, median (range) | 20 (9–40) | 22 (16–35) | 24 (12–57) | – |
| History of GI surgery, n (%) | 5 (55.6%) | 9 (69.2%) | 11 (57.9%) | – |
| HBI score, mean ± SD | 2.67 ± 2.12 | 2.46 ± 2.26 | 2.89 ± 2.81 | – |
| aRemission, n (%) | 8 (88.9%) | 11 (84.6%) | 17 (89.5%) | – |
| aActive disease, n (%) | 1 (11.1%) | 2 (15.4%) | 2 (10.5%) | – |
| Disease location | ||||
| L1–terminal ileum | 2 (22.2%) | 3 (23.1%) | 9 (47.4%) | – |
| L2–colon | 1 (11.1%) | 2 (15.4%) | 2 (10.5%) | – |
| L3–ileocolon | 6 (66.7%) | 9 (69.2%) | 8 (42.1%) | – |
| L4–upper GI | 0 | 1 (7.7%) | 1 (5.3%) | – |
| Montreal classification | ||||
| B1–inflammatory | 5 (55.6%) | 8 (61.5%) | 11 (57.9%) | – |
| B2–fibrostenotic | 4 (44.4%) | 3 (15.4%) | 4 (21.1%) | – |
| B3–perforating | 0 | 3 (23.1%) | 4 (21.1%) | – |
CD Crohn’s disease, HBI Harvey-Bradshaw Index, GI gastrointestinal, SD standard deviation
aDisease activity was assessed with the modified HBI: an HBI score ≤ 5 indicates remission, while an HBI score > 5 indicates active disease
Demographic and clinical characteristics
Data from a subset of participants (n = 62) from our original study ([33], n = 95) were included in the present analysis. There were approximately equal numbers of men and women, Hispanic and non-Hispanic individuals, and participants born in the USA or in another country (Table 1). The majority of participants were white. Among the CD patients, over half had a history of gastrointestinal surgery and most were in remission, contributing to the low mean Harvey-Bradshaw index (HBI) score.
Dietary intake
Our dietary intervention was designed to increase fiber intake and reduce the percentage of calories derived from fat. Further details are available elsewhere [33]. Here, we present only the dietary intake data of the participants included in the present analysis (Fig. 3). The catered diet increased fiber and protein intake and reduced the percentage of calories derived from fat. However, participants had largely returned to their baseline dietary patterns by week 36.
Fig. 3.
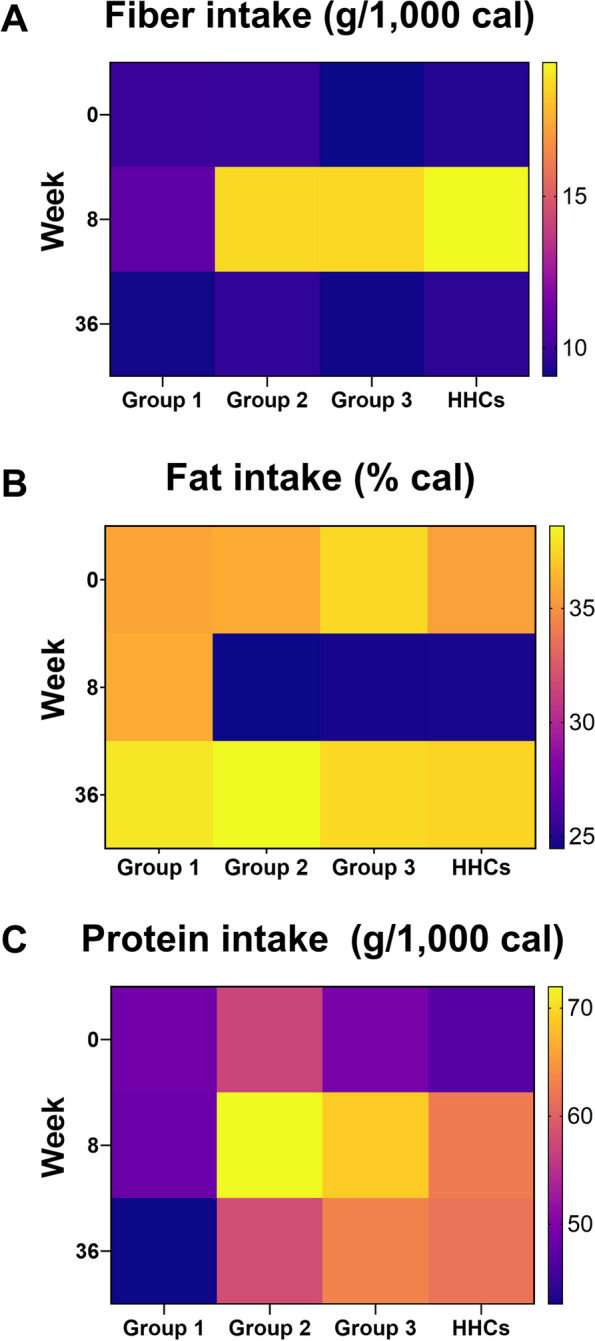
Mean daily macronutrient intake. A Fiber intake, B fat intake, and C protein intake of participants in each group at the three time points (baseline, after consuming the catered food for 8 weeks, and at the end of the study period). Catered food was provided before week 8 data collection. Lighter colors reflect increased intake; darker colors reflect decreased intake
Protein identification and filtering
Overall, the metaproteomic analysis generated a total identification list consisting of 63,338 bacterial PGs and 703 human proteins. Among the 334,160 peptide sequences identified in the SSDB, 168,507 were unique to bacterial PGs and only 784 were shared with the 5621 sequences identified in the host DB. The bacterial PGs and human proteins were reduced to 29,175 and 307, respectively, after excluding IDs with less than two unique peptides and those containing peptide sequences detected in both microbial and human DBs. We included only entries with at least two unique peptides to make our LFQ analysis more robust, as this approach reduces bias due to shared peptides, especially for PGs identified with low sequence coverage. All details about peptides and protein IDs in each sample included in the analysis are shown in Table S1.
Taxonomic analysis returned the association of numerous identified peptide sequences with a bacterial taxon (n = 256,991), with 122,597 at the genus level and 60,877 at the species level, which falls within the expected range for such studies. This depth of peptide characterization allowed us to explore the associations of metabolic functions with bacteria at more specific taxonomic levels. To the best of our knowledge, the final cohort (including data from three time points) represents the largest cohort of CD patients studied in a diet intervention to date.
CD patients have a higher proportion of immune response-related human proteins in stool samples than HHCs
The number of human proteins detected in this dataset was limited because the fecal-sample preparation protocol focused on the retrieval of microbial proteins. The percentage of human proteins (i.e., the number of human proteins/the number of human and bacterial proteins) was 5.2%, 5.2%, 5.6%, and 3.3% in Gr1, Gr2, Gr3, and HHCs, respectively. This percentage was significantly higher in CD patients than in HHCs (permutational test; p < 0.001). Moreover, a higher percentage of human proteins was observed in samples that produced a bacterial PG count lower than 3000 (Table 2). The overall percentage of human peptides (number out of all proteins) was low (~ 2%), but the quantitative abundance of these human peptides was high, accounting for 11% of the overall intensity of all peptides in HHC samples and 25% of peptides in CD patient samples (Fig. S2).
Table 2.
Identified bacterial protein groups (PGs) and human proteins
| Group | Bacterial PGs (mean ± SD) |
Human proteins (mean ± SD) |
% of human proteins, > 3000 PGs ID | % of human proteins, < 3000 PGs ID |
|---|---|---|---|---|
| 1 | 4212.5 ± 1220.6 | 229.7 ± 43.2 | 4.6% | 8.5% |
| 2 | 4224.9 ± 929.7 | 233.1 ± 53.6 | 5.1% | 7.8% |
| 3 | 4430.4 ± 891.9 | 212.0 ± 40.1 | 4.5% | 7.9% |
| HHC | 5068.7 ± 828.9 | 175.3 ± 40.2 | 3.3% | 9.3%a |
| Total | 4,573.9 ± 993.4 | 206.5 ± 49.5 | 4.1% | 8.2% |
The percentages of human proteins are reported for samples with > 3000 identified PGs and < 3000 identified PGs
aOnly one sample in the HHC group had less than 3,000 identified PGs
Quantitative analysis of human proteins was performed to identify human proteins upregulated in CD patients compared to HHCs. The results showed upregulated proteins associated with immune response, defense mechanisms against bacteria, and response to inflammation in CD patients (Fig. S3). Across groups or disease location, analyses designed to reveal the influence of the dietary intervention yielded very few differentially expressed proteins at each time point. In other words, it was not possible to identify any diet-induced effects on human proteins. The differentially expressed human proteins identified in each of the performed comparisons are shown in Additional file 2. These data suggest patients with CD exhibit greater shedding of mucosal cells (i.e., epithelial cells, inflammatory cells) than healthy people. Our finding further suggests that the more inflammation (and thus mucosal cell shedding) there is, the lower the bacterial protein diversity.
Disease location influences beta-diversity between CD patients and healthy household controls
In our preliminary evaluation of the LC–MS/MS data, we counted the taxon-specific peptides identified and plotted the relative abundance of their summed intensity at baseline (data are shown in Table S2). Before the diet intervention, we did not observe specific features with substantial differences between the CD patient groups. Grouping CD patients by disease phenotype (Montreal classification) did not reveal shared characteristics between individuals of the same group (Fig. S4). Most patients were in clinical remission; therefore, we did not stratify by active disease versus remission during our analyses.
In contrast, stratifying CD patients by disease location revealed significant differences between ileal only disease (L1) and ileocolonic (L2) or colonic disease (L3) (Fig. 4). Specifically, the relative abundance of taxon-specific peptides associated with Bacteroidetes (t test; p = 0.03), Proteobacteria (p = 0.028), and Akkermansia (p = 0.021) was higher in patients with ileal Crohn’s disease (ICD) (L1), while those associated with Faecalibacterium (p = 0.018) were higher in patients with colonic involvement (L2/L3).
Fig. 4.

Summed intensity of taxon-specific peptides identified in Crohn’s disease (CD) samples at baseline. Bars are grouped according to disease location. L1: ileal CD, L2: ileocolonic CD, L3: colonic CD. To simplify the figure, if the algorithm assigned the LCA at the species level, the corresponding genus is displayed. Colors indicate the LCA assigned to the peptide sequence
A Kruskal–Wallis test did not reveal any significant differences in mean age among the groups (p = 0.284). No significant Bray–Curtis β-diversity was observed when grouping subjects by sex at any time point (baseline: p = 0.225, week 8: p = 0.528; week 36: p = 0.314; Fig. 5A). Significant β-diversity was observed between HHCs and CD patients at all time points, both when pooling data from all CD patients (baseline: p = 0.005, week 8: p = 0.006; week 36: p = 0.001; Fig. 5B) and when compared to each CD patient group (baseline: p = 0.007, week 8: p = 0.024; week 36: p = 0.002; Fig. 5C). In CD patients who received the catered diet (Gr2 and Gr3), there was no significant β-diversity (baseline: p = 0.29, week 8: p = 0.121; week 36: p = 0.414; Fig. 5D). In contrast, among these same CD patients, grouping by location revealed significant β-diversity between L1 and L2/L3 at baseline (p = 0.005) and at week 8 (p = 0.003) (Fig. 5E). There was no significant β-diversity between disease location groups by week 36 (p = 0.613). This absence of β-diversity at week 36 is not surprising given that the diet intervention ceased after week 8, with a subsequent loss of dietary adherence. Significant β-diversity was also observed at all time points (baseline: p = 0.003, week 8: p = 0.004, and week 36: p = 0.008) in comparisons of CD patients consuming the catered diet (Gr2 and Gr3) with HHCs (Fig. S5). Overall, these findings demonstrate that at a high level, CD patients and healthy controls have metaproteomes that differ from each other even when fed the same catered food (i.e., at week 8). The greatest β-diversity was found between disease location groups and was driven by ileal only disease.
Fig. 5.

Principal coordinate plots displaying data from stool samples collected at each time point. The PERMANOVA was performed on a Bray–Curtis dissimilarity matrix calculated on the LFQ intensity for each protein group (significance: p < 0.05). A CD patients categorized by sex. B All CD patients compared with all HHCs. C All participants, categorized by group. D CD patients who received the catered diet, categorized by the presence (Gr2) or absence (Gr3) of dyadic psychosocial support. E CD patients who received the catered diet, categorized by disease location (L1 = ileal only; L2/L3 = colonic involvement)
A high-fiber diet promotes GM functional changes in carbohydrate metabolism
To date, no diet studies in CD patients have increased fiber and decreased fat intake at the same time; thus, we lack data on the impact of a high-fiber, low-fat diet on the metaproteome. Given that patients with CD have an altered microbiome, we first asked which metabolic pathways exhibit the greatest change in response to the Mi-IBD diet in these patients. Of note, in addition to being high in fiber and low in fat, the Mi-IBD diet had higher protein than most participants’ baseline diets. We compared baseline data with week 8 data within each group. In the LFQ analysis, the PG list was first refined by removing PGs with valid values in < 50% of the whole dataset; the remaining 1,922 PGs were quantified.
In Gr1, there were very few PGs with significant changes in abundance when comparing baseline and week 8 data (Fig. 6A). This is probably due to the fact that these patients received diet counseling only and made no substantive changes in their diet (Fig. 3). This group also had a smaller sample size available for analysis (n = 9).
Fig. 6.

Numbers of protein groups (PGs) with increased or decreased abundance according to within- and between-group comparisons. These PGs were determined by LFQ analysis and are shown with the most representative COG categories and KEGG pathways. To simplify the figure, if the algorithm assigned the LCA at the species level, the corresponding genus is displayed. Colors indicate the LCA assigned to the peptide sequence. A Within-group analysis comparing baseline and week 8 data. B Comparison of ileal CD (L1) and colonic and ileocolonic CD (L2 + L3) groups with the HHC group. C Comparisons between and within groups of patients stratified by disease location
Although both Gr2 and Gr3 received the same catered diet, comparisons of baseline and week 8 data revealed different changes in PG abundance over time (Fig. 6A). At a broad functional level, PGs are associated with clusters of orthologous groups (COG) categories. Gr2 showed both increased and decreased abundance of PGs associated with carbohydrate metabolism (COG category G), amino acid transport and metabolism (COG category E), and nucleotide transport and metabolism (COG category F). In terms of carbohydrate metabolism (COG category G), taxonomic analysis showed that the increased PGs were mainly assigned to Eubacteriales (at the order level) and Subdoligranulum (at the genus level), while the decreased PGs were principally associated with Bifidobacterium sp. In terms of metabolic pathways from the Kyoto Encyclopedia of Genes and Genomes (KEGG), PGs associated with purine and pyrimidine metabolism belonged to either COG category F (nucleotide metabolism) or COG category K (transcription). PGs with decreased abundance were assigned to Collinsella aerofaciens and Faecalibacterium prausnitzii.
In contrast to Gr2, Gr3 showed a marked increase of bacterial functions from baseline to week 8, with very few significantly decreased PGs. The most represented COG categories were carbohydrate metabolism (COG category G), with approximately 40 PGs that exhibited increased abundance by week 8, followed by amino acid transport and metabolism (COG category E), translation (COG category J), cell wall and membrane biogenesis (COG category M), and inorganic ion metabolism (COG category P). The main KEGG metabolic function that was increased was ABC transporters (associated with COG categories G and E), with PGs were associated with Eubacteriales (at the order level) and with Blautia (at the genus level) and other Lachnospiraceae species. We also observed increases in the abundance of some outer membrane proteins and proteins associated with cell wall/membrane/envelope biogenesis (COG category M) and inorganic ion transport and metabolism (COG category P) at week 8; these increases were ascribed to increased activity of Bacteroides and Phocaeicola species (Fig. 6A).
The HHC group showed an increased abundance of PGs associated with Eubacteriales and F. prausnitzii at the end of the diet intervention; the functional changes were diffuse but especially involved ABC transporters and other pathways linked to carbohydrate metabolism (Fig. 6A). In terms of amino acid metabolism (COG category E), the PGs with increased abundance were associated with diverse Eubacteriales species, while those with decreased abundance were mainly associated with C. aerofaciens. A decreased abundance of PGs assigned to C. aerofaciens and associated with translation and ribosomal activity (COG category E) was also observed.
These data demonstrate that diet impacts metabolic pathways in CD patients and HHCs, although the taxa associated with these metabolic pathways differed between CD patients and healthy individuals. We further show that whereas the HHCs exhibit a broad increase in activity of carbohydrate and amino acid metabolism pathways, the response to the diet was more varied between CD groups receiving catered meals.
Identifying differences in the GM function of CD patients compared to healthy controls
Next, we utilized our control group of healthy individuals (HHCs) to identify differences in the gut microbiome (GM) function of CD patients, both at baseline and after consuming the catered diet. First, given the design of the study, we conducted comparisons by group. We observed substantial variability when comparing Gr1 and the HHC group at all three time points, preventing a clear interpretation of these changes in function (Fig. S6A). This variability is likely attributable to the lack of a controlled, catered diet in Gr1 patients. Therefore, we focused on subjects who received the catered diet only (Gr2, Gr3, and HHCs). As expected, the catered diet provided far better experimental control. When comparing all CD patients (Gr2 + Gr3) with HHCs, we observed similar trends in the PGs with changes in abundance at the three time points. The majority of PGs were increased in HHCs regardless of the diet (Fig.S6B). For the complete list of PGs with significant changes in abundance from all comparisons performed (within and between groups), see Additional file 3.
Our results presented up to this point suggest that the differences observed between Gr2 and Gr3 are potentially due to the higher proportion of ICD patients in Gr3 (9 out of 19) than in Gr2 (3 out of 14). In other words, we conclude that CD location had a larger impact on the diet-induced GM changes than the presence of a household member who consumed the same diet and provided dyadic psychosocial support. Hereafter, we focus on differences between groups according to disease location.
Specifically, we combined the CD patient groups and compared PG abundance by disease location (L1 and L2/L3 groups versus the HHC group) (Fig. 6B). In the L1 group, we observed a significantly lower abundance of 443 PGs at baseline and 539 PGs at week 8 (Additional file 3) compared to the abundance in HHCs. There were far fewer PGs with significantly higher abundance in L1 CD patients (28 PGs at baseline and 42 PGs at week 8). The functional trends and the involved taxa were very similar between the two time points. Patients with ICD exhibited a clear deficit in GM functions, especially carbohydrate metabolism (COG category G). More specifically, they exhibited a deficit in glycolysis, starch, and sucrose metabolism as well as the pentose phosphate pathway. The other clearly reduced functions were translation and ribosomal activity (COG category J), energy production and conversion (COG category C), and amino acid transport and metabolism (COG category E). Taxa involved in such activities were mainly Eubacteriales (at the order level), Lachnospiraceae (at the family level), and Subdoligranulum, Ruminococcus, and Clostridium species as well as F. prausnitzii (at the genus and species level). In other words, we observed clear and consistent differences between L1 patients and HHCs over time; in particular, L1 patients exhibited reduced activity of F. prausnitzii and other Eubacteriales species. Although we conducted similar analyses of the week 36 data, these results were less clear given the marked decline of dietary adherence after week 8 (by week 36, CD patients and HHC had mostly returned to their baseline fat or fiber intake (Fig. 3).
In contrast, comparisons of the HHC group with the L2/L3 group revealed that CD patients with colonic involvement exhibited fewer differences from healthy individuals than CD patients with ileal involvement (i.e., fewer PGs with decreased abundance at both time points; see Additional file 3). At baseline, the PGs with decreased abundance in the L2/L3 group were mainly ascribed to a decrease in the activity of Bacteroidales (Bacteroides, Phocaeicola, and Prevotella at the genus level) and Eubacteriales (mainly Subdoligranulum, Ruminococcus, and Faecalibacterium at the genus level). At week 8, we observed fewer decreased PGs associated with Bacteroidales in the L2/L3 group (Fig. 6B). Interestingly, there were more decreased PGs related to pyruvate metabolism and glycolysis and associated with F. prausnitzii at week 8 than at baseline in the L2/L3 group. This is probably due to greater increases in F. prausnitzii activity in HHCs, rather than decreased activity of F. prausnitzii in CD patients because it is unlikely that the diet led to reduced F. prausnitzii activity. Instead, it is possible that the GM of CD patients is less likely to change with diet due to the altered gut environment (inflammation, oxidative stress, pH changes, etc.). Overall, although the catered diet was high in fiber and low in fat, the CD patient groups continued to exhibit a very different metaproteomic profile from that of HHCs.
Stratification of CD patients by disease location reveals specific effects of diet on bacterial functions
We further investigated differences between patients with ICD and those with colonic involvement. Because these analyses focused on CD patients only, we slightly changed the filtering criteria to remove PGs not identified in at least 50% of the samples within Gr2 or Gr3 and performed imputation by location. This increased the number of quantified PGs to 2460 and increased the number of significant differential PGs detected. L1 patients and L2/L3 patients had very similar patterns both at baseline and at week 8 (Fig. 6C, left); in other words, there were no differences in the impact of the diet on the two disease location subgroups according to visual inspection. This lack of difference is likely because the impact of disease location overwhelmed the effect of diet. Additionally, L1 patients showed marked decreases in Eubacteriales and F. prausnitzii activity compared to L2/L3 patients at both time points (Fig. 6C,left). This lower F. prausnitzii activity impacted a wide variety of metabolic functions and pathways, especially carbohydrate metabolism.
We next conducted within-group comparisons of baseline and week 8 data. We observed fewer changes in bacterial function in L1 patients than in L2/L3 patients, and the affected taxa were mostly undefined Eubacteriales species. However, there were clear differences between L1 and L2/L3 patients at more specific taxonomic levels. Specifically, we observed increased abundance of PGs associated with Blautia and B. obeum in L1 patients only, and we observed decreased abundance of PGs associated with Collinsella, C. aerofaciens, and Bifidobacterium in L2/L3 patients only (Fig. 6C, right). The PGs with significant changes in abundance from all the comparisons performed on L1 and L2/L3 are shown in Additional file 4.
We observed that PGs mainly increased in abundance after the dietary intervention (at week 8) in the L2/L3 group and, to a lesser extent, in the L1 group. Many of these PGs with increased abundance represented enzymes directly involved in SCFA metabolism (Fig. 7). Pyruvate ferredoxin reductase (COG0674), pyruvate-formate lyase (COG1882), and acetyl-CoA acetyltransferase (COG0183) are involved in the pathway from pyruvate to acetyl-CoA and acetoacetyl-CoA; this pathway is shared by pyruvate, butanoate (also known as butyrate), and propanoate metabolism. In terms of butanoate metabolism, the other enzymes involved in the pathway from acetoacetyl-CoA to butanoyl-CoA were 3-hydroxyacyl-CoA dehydrogenase (COG1250), alcohol dehydrogenase (COG1454), and the acyl-CoA dehydrogenase related to the alkylation response protein AidB (COG1960). Interestingly, we observed that some PGs did not significantly increase in abundance in the L1 or L2/L3 groups after the dietary intervention (from baseline to week 8) but were nonetheless more abundant in the L2/L3 group compared with the L1 group at week 8.
Fig. 7.

Diet-induced changes in pathways related to SCFA metabolism. Protein groups associated with pyruvate, propanoate, and butanoate (butyrate) metabolism were increased in abundance by the dietary intervention. The COG name is displayed for each enzyme reported. COG0574: phosphoenolpyruvate carboxykinase; COG0674, COG1013: pyruvate:ferredoxin oxidoreductase; COG1882: pyruvate formate lyase; COG0282: acetate kinase; COG0183: acetyl-CoA acetyltransferase; COG1250: 3-hydroxyacyl-CoA dehydrogenase; COG1053: succinate dehydrogenase; COG1979: alcohol dehydrogenase YqhD, Fe-dependent ADH family; COG1884: methylmalonyl-CoA mutase; COG1960: acyl-CoA dehydrogenase; COG1454: alcohol dehydrogenase, class IV
Other specific PGs involved in carbohydrate metabolism and ion transport and metabolism showed significant changes from baseline to week 8 across groups; some changes in PGs associated with the same COG (but different taxa) exhibited opposite trajectories in one or more groups (Fig. 8). Among the COGs from category G (carbohydrate metabolism), PGs associated with F. prausnitzii displayed significantly increased abundance at week 8 in HHCs but not in CD patients. PGs associated with Subdoligranulum were significantly increased at week 8 in L2/L3 patients. Finally, PGs associated with Blautia were significantly increased at week 8 in L1 patients. There were also changes in PGs associated with inorganic ion transport (COG category P); many PGs associated with iron transport and chelation and siderophore uptake (COG1629 and COG4771) were significantly increased in CD patients only. Notably, iron intake did not differ between the baseline and catered diets. These PGs with increased abundance were all assigned to Bacteroidales (specifically to Bacteroides fragilis and Prevotella copri).
Fig. 8.

Diet-induced changes in some protein groups from selected COGs. B baseline, W8 week 8
Overall, these data demonstrate that important metabolic functions, including SCFA pathways, change with diet. More marked improvements were observed in L2/L3 patients than in L1 patients. Furthermore, the taxa that underpin these functions vary by CD disease location.
Differential analysis at the functional level reveals differences in carbohydrate metabolism and SCFA pathways between HHCs, L1 patients, and L2/L3 patients
In addition to the diet-induced effects on PGs associated with specific enzymes and taxa, our results also reveal differences between CD patients and HHCs as well as between L1 and L2/L3 patients. Many PGs with differences in abundance from these comparisons were associated with broad functional categories such as carbohydrate metabolism, energy production, translation, and ribosomal activity. At a more specific functional level, many PGs belonging to the same COG exhibited substantially different patterns—sometimes even showing opposite patterns (e.g., increases of one PG and decreases in another PG, both associated with the same COG). Thus, we also performed an analysis at the functional level, accounting for the abundance of PGs associated with each COG by averaging the intensities of all PGs associated with the same COG.
In terms of SCFA metabolism, our protein-level analysis revealed more PGs with increased abundance in L2/L3 patients compared to L1 patients, at both baseline and week 8, than our original analysis (Additional file 4). At the functional level, we found that most increases in function in L2/L3 patients were significant after the diet (at week 8) but were also present at baseline when compared to L1 patients (Fig. 9).
Fig. 9.

Bar plots of changes in the abundance of protein groups associated with SCFA metabolism pathways in L1 patients and L2/L3 patients from baseline to week 8 (after consuming the catered diet). B baseline, W8 week 8
Because the catered diet substantially increased fruit and vegetable intake, we also focused on carbohydrate metabolism (COG category G). Many PGs that were significantly increased in HHCs (compared to CD patients) or in L2/L3 patients (compared to L1 patients) at baseline and week 8 were associated with COGs involved in glycolysis, starch, and sucrose metabolism as well as the pentose phosphate pathway. We found that COG levels were mainly higher in HHCs than in CD patients and in L2/L3 patients than in L1 patients at both time points (Additional file 5). Although increases in COG levels from baseline to week 8 were observed in many participants, mostly in the HHC and L2/L3 groups, few of these increases were significant.
In contrast, when comparing HHCs and L2/L3 patients with L1 patients, we observed more significant COGs at week 8 than at baseline. Notably, only two COGs displayed significant differences between HHCs and L2/L3 patients at baseline, and no COGs significantly differed between these groups at week 8 (Additional file 5). These data further support our findings that patients with specific disease phenotypes, such as ICD (L1), may not experience the same benefits from the Mi-IBD diet as those with colonic involvement.
Overall, at the functional level, diet-induced effects were characterized by heterogenous changes in PGs associated with the same enzyme, due to diverse responses by different taxa. These results further underscore that the effects of disease location overshadowed the effects of diet. These findings further highlight the importance of disease location to interpret the impact of diet in shaping gut microbiome function and examining specific relevant enzyme pathways.
Discussion
Although many studies have investigated the GM in patients with CD, these studies have not led to actionable strategies to change the course of the disease [47, 48]. Patients consistently seek diet-based approaches for CD control, but the data supporting clinical benefits and associated GM changes with diet interventions are limited [12, 13, 49–51]. In the current study, we took advantage of carefully annotated samples from a well-designed, catered diet intervention to conduct one of the best-controlled metaproteomic studies in CD patients. To our knowledge, this is the first study to provide both high fiber foods and a diet low in inflammatory fats to CD patients and assess the impact on their metaproteome. In general, patients with CD tend to avoid high-fiber foods because of fear of intestinal obstruction due to strictures or because they have received this advice from their physicians. We also included a powerful household control group to pinpoint metaproteomic differences in healthy individuals versus patients with a heterogenous disease (such as CD) and, moreover, to examine the impact of a therapeutic diet on the metaproteome in health versus CD. We identified many baseline metaproteomic characteristics of CD patients that differed from those of HHCs. The CD patient metaproteome exhibits deficiencies in amino acid transport and metabolism, carbohydrate transport and metabolism, and translation, ribosomal structure and biogenesis compared to the healthy metaproteome.
To date, few metaproteomic studies have examined the impact of fiber consumption even in healthy subjects. One study compared the effects of diets enriched in fiber or fermented foods. Similar to our own findings, they reported that fiber intake increased pyruvate ferredoxin reductase abundance. We found that a high-fiber, low-fat diet successfully increased carbohydrate transport and metabolism, specifically glycolysis and ABC transporters, translation and ribosomal activity and amino acid transport and metabolism, and in CD patients. Although nitrogen limitation has been shown to increase uptake of amino acids, the catered diet increased protein intake thus, we do not attribute these changes to nutrient limitation [52]. Despite these changes, the metaproteome of CD patients remained far from that of the HHCs, and the patients did not experience the same increases in these pathways as the HHCs when fed the same diet. We further identified a clear difference in the metaproteome at baseline and after the diet intervention between patients with ICD (L1) versus those with colonic involvement (L2/L3). The patients with ICD were more deficient in carbohydrate metabolism pathways than those with colonic involvement or HHCs, largely due to reduced Faecalibacterium and Eubacteriales activity. Our data suggest that the deficiencies in the GM, as represented by the metaproteome, are not ameliorated by a diet rich in foods designed to provide substrates for SCFA producers such as Faecalibacterium and Roseburia and that this is especially true for ICD.
Previous studies have identified a decrease in F. prausnitzii in patients with ileal disease and have suggested that F. prausnitzii has salutatory effects in CD [53–55]. Notably, the activity of F. prausnitzii seemed to increase with increased fiber intake in HHCs but not in CD patients. F. prausnitzii is highly relevant in CD given its anti-inflammatory effects [27, 31, 53]. Inflammation in CD increases the oxygen concentration in the intestinal tract, favoring the growth of specific bacteria and inducing an imbalance in reactive oxygen species [56]. F. prausnitzii is particularly sensitive to oxidative stress. Thus, although the high-fiber diet supplied nutrients with anti-inflammatory effects, this species still demonstrated reduced functionality and lower growth in CD patients than in HHCs. Within CD patients, those with ICD exhibited the largest GM functional differences from HHCs in this study, largely due to decreased F. prausnitzii abundance. Consistent with our findings, previous metaproteomic studies have demonstrated that levels of F. prausnitzii are significantly reduced in IBD patients and can differentiate between ileal disease and colonic involvement, aligning with our current findings [23]. A specific CD signature was described in a multi-omic investigation that exploited the insights from metaproteomics; metagenomics alone was not able to distinguish among CD subtypes [16].
While F. prausnitzii abundance is negatively related to the presence of bile acids, Blautia abundance is positively related with the presence of bile acids and involved in bile acid metabolism [31, 57]. Our results of increased Blautia activity in ICD patients are consistent with the hypothesized relationships of Blautia and F. prausnitzii abundance with bile acid metabolism in the ileum. Fiber consumption may also influence bile acid metabolism, with increased fiber intake linked to increased bile acid deconjugation [58]. In CD patients with colonic involvement, the Mi-IBD diet had further beneficial effects for the composition of the gut microbiota: consumption of this diet downregulated protein expression associated with C. aerofaciens, which increases gut permeability [59, 60]. Given that the Mi-IBD diet did not yield the same benefits in patients with ICD as in those with colonic involvement, our data suggest that these patients may need a diet tailored to their specific disease phenotype.
Moreover, some changes in microbial activity were dependent on disease location; carbohydrate metabolism associated with Blautia function was increased in ICD (L1), whereas many metabolic pathways associated with Prevotella function were increased in L2/L3 CD patients. Changes in Prevotella activity in response to increased fiber in the diet have been seen in healthy subjects and CD patients [13, 61]. Interestingly, we observed that in some cases there were greater changes in microbial activity (e.g., Bacteroidetes/Bacteroides) in CD patients than in HHCs. The abundance of the phylum Bacteroidetes is typically increased in CD and decreased in UC [62, 63].
In CD patients with colonic involvement, the Mi-IBD diet had further beneficial effects for the composition of the gut microbiota: consumption of this diet decreased abundance of proteins associated with C. aerofaciens, which increases gut permeability [59, 60]. Given that the Mi-IBD diet did not yield the same metaproteomic benefits in patients with ICD as in those with colonic involvement, our data suggest that these patients may need a diet tailored to their specific disease phenotype.
During the diet intervention, CD patients exhibited increased abundance of proteins associated with inorganic ion transport and metabolism (COG category P), specifically iron transport, compared with HHCs. The Mi-IBD diet did not differ in iron content from the participants’ baseline diet; thus, the increase in iron transport COGs is likely due to diet-induced stimulation of bacterial activity rather than increased iron absorption. Notably, some of the increased COGs (COG1629 and COG4771) are associated with TonB-dependent iron uptake; TonB is a bacterial virulence factor [64]. Increases in these COGs at week 8 may be a secondary effect of the diet; in other words, increased fiber intake promotes SCFA production, leading to a lower mucosal layer pH, which in turn facilitates iron uptake by bacteria. We did not observe any worsening of inflammation due to diet in the present study.
The metaproteomic data presented herein are novel in several ways. First, few metaproteomic studies have included detailed diet information or provided catered meals, which provides excellent control over actual food intake. Indeed, our diet adherence rate was over 95% in the catered portion of the study ([33]; Fig. 3). Second, we had two powerful control groups: Gr1 and the HHCs. Gr1 contained CD patients who did not receive catered food and did not exhibit appreciable changes in their diet over time, allowing us to examine longitudinal variability in the CD patient metaproteome. Although metaproteomic data have been gathered at multiple time points, these previous studies lacked diet information [29, 65]. The other control group (the HHCs) also received the catered meals, enabling us to compare the metaproteome of CD patients with that of HHCs and to detect differences in the impact of the catered diet between healthy people and CD patients. To our knowledge, this is the best-controlled metaproteomic analysis of the largest cohort of CD patients studied in a diet intervention to date.
Our study has three main limitations. First, the sample size was limited. We acknowledge that the number of included participants is low; however, this study has one of the largest sample sizes to date among other clinical studies involving metaproteomics. Indeed, metaproteomic research is limited by the computational burden needed to perform the analyses, which renders the inclusion of thousands of samples infeasible. Additionally, CD is a multifactorial disease. The high heterogeneity observed among CD patients, although expected, limited the statistical power of our analyses. Together, these two factors made it difficult to retain significant results after adjusting for multiple comparisons with the FDR. Second, our study enrolled CD patients who were either mildly active or in clinical remission. A high-fiber diet has not previously been purposely given to CD patients, and we did not want patients to undergo changes in their medications during the catering period that could confound the influence of diet; thus, we selected patients with mild symptoms. However, we acknowledge that our patients do not fully represent diet-induced effects on the metaproteome in the context of more severe inflammation. Given that we recently established that the diet is well-tolerated and leads to changes in GM function, we plan to conduct further studies in CD patients with active inflammation and more severe symptoms. Third, the IGC is the typical DB employed in metaproteomic analyses of the GM, given the absence of a metagenomic-derived DB from whole genome sequencing. However, this DB may not adequately represent the microbiome under investigation and may lack detailed activity of specific taxa. Additionally, although the two-step search strategy reduces the search space in the DB, it produces a SSDB based on an iterative search of the same dataset, introducing further bias to the statistics underlying the database search.
Conclusions
Our study enriches knowledge regarding the use of diet as a strategy to improve microbiome function, even in the face of dysbiosis. In the present study, we identify several baseline metaproteomic characteristics of CD patients that differ from those of HHCs. We show that a diet intervention induced changes in the GM of CD patients. In particular, a diet high in fiber and low in fat can increase the abundance of proteins associated with carbohydrate metabolism, SCFA production, and inorganic ion transport and metabolism, which serves as proof of principle that the function of the GM is responsive to an 8-week diet intervention. The taxa underpinning these functions differ according to health status (CD patients vs. HHCs) and CD location. Future diet studies should stratify by CD location to elucidate the specific impacts in each subgroup.
Supplementary Information
Additional file 1. The detailed inclusion/exclusion criteria and dyadic psychosocial support intervention utilized in the original study.
Additional file 2. Summary of the label-free quantification (LFQ) analysis of proteins identified by searching against the SwissProt Homo sapiens database. Each sheet corresponds to a comparison between two groups of samples.
Additional file 3. Summary of LFQ analysis of bacterial protein groups (PGs) identified by searching against the sample-specific database (SSDB) generated from the “integrated reference catalog of the human gut microbiome” database (IGC DB). Abundance ratios were calculated on a matrix of PGs present in at least 50% of samples across all groups (Gr1, Gr2, Gr3 and HHCs). Missing values were imputed by group. Each sheet corresponds to a comparison between two groups of samples. Tables include the functional annotation and the taxonomic assignment.
Additional file 4. Summary of LFQ analysis of bacterial PGs identified by searching against the SSDB generated from the IGC DB. Abundance ratios were calculated on a matrix of PGs present in at least 50% of samples from Gr2 and Gr3 separately. Missing values were imputed by disease location groups (L1 or L2/L3). Each sheet corresponds to a comparison between two groups of samples. Tables include the functional annotation and the taxonomic assignment.
Additional file 5. Abundance distribution of selected COGs involved in carbohydrate metabolism in the HHC, L1 and L2/L3 groups at baseline, week 8, and over time. COGs were selected if they were associated with protein groups with significant increases in abundance in HHCs compared with L1 and L2/L3 patients or in L2/L3 patients compared with L1 patients. The figure displays changes in abundance situated within metabolic pathways; the table supplies p values for comparisons of COG abundance within HHC, L1 and L2/L3 groups and between HHCs and disease location subgroups at different time points.
Additional file 6: Fig. S1. Flow chart of the bioinformatics pipeline applied in this study.
Additional file 7: Fig. S2. Human and bacterial peptides. A) Bar chart showing the mean number of IDs and the percentage of human proteins per group of individuals. B) Pie chart displaying the total number of identified bacterial and human peptides. C) Pie charts displaying the summed intensity of peptides identified in the IGC DB and in the SwissProt Homo sapiens DB for healthy subjects (left) and CD patients (right). D) Venn diagrams showing the distribution of identified human proteins in each group of subjects at the three time points.
Additional file 8: Fig. S3. Principal biological processes associated with the upregulated human proteins in CD patients compared with HHCs. Results of enrichment analyses.
Additional file 9: Fig. S4. Summed intensity of taxon-specific peptides identified in Crohn’s disease (CD) samples at baseline. Bars are grouped according to Montreal classification. B1: inflammatory, B2: fibrostenotic, B2: penetrating and perforating. To simplify the figure, if the algorithm assigned the LCA at the species level, the corresponding genus is displayed. Colors indicate the LCA assigned to the peptide sequence.
Additional file 10: Fig. S5. Principal coordinate plots displaying data from stool samples collected at each time point. A) CD patients who received one-time diet counseling vs. CD patients who received the catered diet. B) CD patients who received one-time diet counseling vs. HHCs. C) CD patients who received the catered diet vs. HHCs.
Additional file 11: Fig. S6. Numbers of up- and downregulated PGs, with the most representative COG categories and KEGG pathways. Up- and downregulated PGs were determined by LFQ analysis. To reduce the number of colors reflecting the LCA assigned to protein groups, wherever the assignment was performed at the genus or species level, the corresponding family is displayed. A) Comparisons of Gr1 with the HHC group at the three time points. B) Comparisons of all patients that received the catered diet (Gr2+Gr3) and the HHC group at the three time points.
Additional file 12: Table S1. Number of peptides and PGs identified via LC–MS/MS of stool samples. Samples were searched against the IGC DB and the SwissProt "Homo sapiens" DB. Values are averaged between the two technical replicates.
Additional file 13: Table S2. Values of the relative abundance of the averaged taxon-specific peptide intensity for each subject at baseline, week 8, and week 36.
Acknowledgements
The authors thank Kai Cheng from the MetaLab techteam (University of Ottawa, Canada) for assistance with the software pipeline and Katerina M. Faust for writing assistance.
Abbreviations
- AC
Accession code
- CD
Crohn’s disease
- COG
Cluster of orthologous groups
- DB
Database
- GM
Gut microbiome
- HBI
Harvey-Bradshaw index
- HHC
Healthy household control
- IBD
Inflammatory bowel disease
- ICD
Ileal Crohn’s disease
- IGC DB
“Integrated reference catalog of the human gut microbiome” database
- KEGG
Kyoto Encyclopedia of Genes and Genomes
- LC–MS/MS
Liquid chromatography-tandem mass spectrometry
- LCA
Lowest common ancestor
- LFQ
Label-free quantification
- PG
Protein group
- sCDAI
Short Crohn’s Disease Activity Index
- SCFA
Short-chain fatty acid
- SSDB
Sample-specific database
- UC
Ulcerative colitis
Authors’ contributions
MTA and LP conceptualized the study and acquired the funding. SLM, VM, IF, HH, MTA, and LP led the investigation. NS, MO, OMD, SP, DHK, ARD and LG collected patient data and samples. FR and MDM prepared the samples for analysis. PV, MD, NS, MO, OMD, SP, DHK, ARD, LG and FS provided resources supporting this investigation. SLM, VM, CM, IP, MAQ, RMK, and LG curated the data. CM and IP conducted the statistical analyses. SLM, CM, and IP contributed to data visualization. SLM wrote the manuscript. VM, PV, FDC, MTA, and LP revised and edited the manuscript.
Funding
This work was supported by a grant from The Leona M. and Harry B. Helmsley Charitable Trust to MTA. The Italian Ministry of Health provided “Current Research funds” to support this work to LP.
Data availability
The datasets supporting the conclusions of this article are included within the article and its additional files. All raw data from LC–MS/MS analysis can be retrieved at the MassIVE repository with the accession number MSV000093975.
Declarations
Ethics approval and consent to participate
Not applicable.
Consent for publication
Not applicable.
Competing interests
MTA has received research funding from The Leona M. and Harry B. Helmsley Charitable Trust and the Crohn’s and Colitis Foundation. She has served as a consultant for or is on the advisory board of the following companies: AbbVie Inc., Amgen, Bristol Myers Squibb, Celsius Therapeutics, Eli Lilly and Company, Gilead Sciences, Janssen Pharmaceuticals, Matera Prima, and Pfizer Pharmaceutical. MTA has served as a teacher, lecturer, or speaker for the following companies: Janssen Pharmaceuticals and Takeda Pharmaceuticals. All other authors declare that they have no conflicts of interest.
Footnotes
Publisher’s Note
Springer Nature remains neutral with regard to jurisdictional claims in published maps and institutional affiliations.
Maria T. Abreu and Lorenza Putignani equally contributed to this work and are co-corresponding authors.
Contributor Information
Maria T. Abreu, Email: mabreu1@med.miami.edu
Lorenza Putignani, Email: lorenza.putignani@opbg.net.
References
- 1.Dolinger M, Torres J, Vermeire S. Crohn’s disease. Lancet. 2024;403:1177–91. [DOI] [PubMed] [Google Scholar]
- 2.Roda G, Chien Ng S, Kotze PG, Argollo M, Panaccione R, Spinelli A, et al. Crohn’s disease. Nat Rev Dis Primer. 2020;6:22. [DOI] [PubMed] [Google Scholar]
- 3.Lo C-H, Khandpur N, Rossato SL, Lochhead P, Lopes EW, Burke KE, et al. Ultra-processed foods and risk of Crohn’s disease and ulcerative colitis: a prospective cohort study. Clin Gastroenterol Hepatol. 2022;20:e1323–37. [DOI] [PMC free article] [PubMed] [Google Scholar]
- 4.Shoda R, Matsueda K, Yamato S, Umeda N. Epidemiologic analysis of Crohn disease in Japan: increased dietary intake of n-6 polyunsaturated fatty acids and animal protein relates to the increased incidence of Crohn disease in Japan. Am J Clin Nutr. 1996;63:741–5. [DOI] [PubMed] [Google Scholar]
- 5.Scoville EA, Allaman MM, Adams DW, Motley AK, Peyton SC, Ferguson SL, et al. Serum polyunsaturated fatty acids correlate with serum cytokines and clinical disease activity in Crohn’s disease. Sci Rep. 2019;9:2882. [DOI] [PMC free article] [PubMed] [Google Scholar]
- 6.Wolter M, Grant ET, Boudaud M, Steimle A, Pereira GV, Martens EC, et al. Leveraging diet to engineer the gut microbiome. Nat Rev Gastroenterol Hepatol. 2021;18:885–902. [DOI] [PubMed] [Google Scholar]
- 7.Sandborn WJ, Feagan BG, Loftus EV, Peyrin-Biroulet L, Van Assche G, D’Haens G, et al. Efficacy and safety of Upadacitinib in a randomized trial of patients with Crohn’s disease. Gastroenterology. 2020;158:2123-2138.e8. [DOI] [PubMed] [Google Scholar]
- 8.Torres J, Bonovas S, Doherty G, Kucharzik T, Gisbert JP, Raine T, et al. ECCO uidelines on therapeutics in Crohn’s disease: medical treatment. J Crohns Colitis. 2020;14:4–22. [DOI] [PubMed] [Google Scholar]
- 9.Holt DQ, Strauss BJ, Moore GT. Patients with inflammatory bowel disease and their treating clinicians have different views regarding diet. J Hum Nutr Diet. 2017;30:66–72. [DOI] [PubMed] [Google Scholar]
- 10.Svolos V, Gkikas K, Gerasimidis K. Diet and gut microbiota manipulation for the management of Crohn’s disease and ulcerative colitis. Proc Nutr Soc. 2021;80:409–23. [DOI] [PubMed] [Google Scholar]
- 11.Suskind DL, Lee D, Kim Y-M, Wahbeh G, Singh N, Braly K, et al. The specific carbohydrate diet and diet modification as induction therapy for pediatric Crohn’s disease: a randomized diet controlled trial. Nutrients. 2020;12: 3749. [DOI] [PMC free article] [PubMed] [Google Scholar]
- 12.Svolos V, Hansen R, Nichols B, Quince C, Ijaz UZ, Papadopoulou RT, et al. Treatment of active Crohn’s disease with an ordinary food-based diet that replicates exclusive enteral nutrition. Gastroenterology. 2019;156:1354-1367.e6. [DOI] [PubMed] [Google Scholar]
- 13.Fritsch J, Garces L, Quintero MA, Pignac-Kobinger J, Santander AM, Fernández I, et al. Low-fat, high-fiber diet reduces markers of inflammation and dysbiosis and improves quality of life in patients with ulcerative colitis. Clin Gastroenterol Hepatol Off Clin Pract J Am Gastroenterol Assoc. 2021;19:1189-1199.e30. [DOI] [PubMed] [Google Scholar]
- 14.Darfeuille-Michaud A, Boudeau J, Bulois P, Neut C, Glasser A-L, Barnich N, et al. High prevalence of adherent-invasive Escherichia coli associated with ileal mucosa in Crohn’s disease. Gastroenterology. 2004;127:412–21. [DOI] [PubMed] [Google Scholar]
- 15.Gevers D, Kugathasan S, Denson LA, Vázquez-Baeza Y, Van Treuren W, Ren B, et al. The treatment-naive microbiome in new-onset Crohn’s disease. Cell Host Microbe. 2014;15:382–92. [DOI] [PMC free article] [PubMed] [Google Scholar]
- 16.Pascal V, Pozuelo M, Borruel N, Casellas F, Campos D, Santiago A, et al. A microbial signature for Crohn’s disease. Gut. 2017;66:813–22. [DOI] [PMC free article] [PubMed] [Google Scholar]
- 17.Yilmaz B, Cohort Swiss IBD, Investigators Juillerat P, Øyås O, Ramon C, Bravo FD, et al. Microbial network disturbances in relapsing refractory Crohn’s disease. Nat Med. 2019;25:323–36. [DOI] [PubMed] [Google Scholar]
- 18.Zhang Z, Geng J, Tang X, Fan H, Xu J, Wen X, et al. Spatial heterogeneity and co-occurrence patterns of human mucosal-associated intestinal microbiota. ISME J. 2014;8:881–93. [DOI] [PMC free article] [PubMed] [Google Scholar]
- 19.Juge N. Relationship between mucosa-associated gut microbiota and human diseases. Biochem Soc Trans. 2022;50:1225–36. [DOI] [PMC free article] [PubMed] [Google Scholar]
- 20.Hernández-Rocha C, Turpin W, Borowski K, Stempak JM, Sabic K, Gettler K, et al. After surgically induced remission, ileal and colonic mucosa-associated microbiota predicts Crohn’s disease recurrence. Clin Gastroenterol Hepatol. 2024;S1542356524005925. 10.1016/j.cgh.2024.06.022. [DOI] [PMC free article] [PubMed]
- 21.Armengaud J. Metaproteomics to understand how microbiota function: The crystal ball predicts a promising future. Environ Microbiol. 2023;25:115–25. [DOI] [PMC free article] [PubMed] [Google Scholar]
- 22.Henry C, Bassignani A, Berland M, Langella O, Sokol H, Juste C. Modern metaproteomics: a unique tool to characterize the active microbiome in health and diseases, and pave the road towards new biomarkers—example of Crohn’s disease and ulcerative colitis flare-ups. Cells. 2022;11: 1340. [DOI] [PMC free article] [PubMed] [Google Scholar]
- 23.Erickson AR, Cantarel BL, Lamendella Darzi Y, Mongodin EF, Pan C, et al. Integrated metagenomics/metaproteomics reveals human host-microbiota signatures of Crohn’s disease. PLOSone. 2012;7:e49138. [DOI] [PMC free article] [PubMed] [Google Scholar]
- 24.Presley LL, Ye J, Li X, LeBlanc J, Zhang Z, Ruegger PM, et al. Host–microbe relationships in inflammatory bowel disease detected by bacterial and metaproteomic analysis of the mucosal–luminal interface. Inflamm Bowel Dis. 2012;18:409–17. [DOI] [PMC free article] [PubMed] [Google Scholar]
- 25.Juste C, Kreil DP, Beauvallet C, Guillot A, Vaca S, Carapito C, et al. Bacterial protein signals are associated with Crohn’s disease. Gut. 2014;63:1566–77. [DOI] [PMC free article] [PubMed] [Google Scholar]
- 26.Li X, LeBlanc J, Elashoff D, McHardy I, Tong M, Roth B, et al. Microgeographic proteomic networks of the human colonic mucosa and their association with inflammatory bowel disease. Cell Mol Gastroenterol Hepatol. 2016;2:567–83. [DOI] [PMC free article] [PubMed] [Google Scholar]
- 27.Zhang X, Deeke SA, Ning Z, Starr AE, Butcher J, Li J, et al. Metaproteomics reveals associations between microbiome and intestinal extracellular vesicle proteins in pediatric inflammatory bowel disease. Nat Commun. 2018;9:2873. [DOI] [PMC free article] [PubMed] [Google Scholar]
- 28.Lehmann T, Schallert K, Vilchez-Vargas R, Benndorf D, Püttker S, Sydor S, et al. Metaproteomics of fecal samples of Crohn’s disease and ulcerative colitis. J Proteomics. 2019;201:93–103. [DOI] [PubMed] [Google Scholar]
- 29.Lloyd-Price J, Arze C, Ananthakrishnan AN, Schirmer M, Avila-Pacheco J, Poon TW, et al. Multi-omics of the gut microbial ecosystem in inflammatory bowel diseases. Nature. 2019;569:655–62. [DOI] [PMC free article] [PubMed] [Google Scholar]
- 30.Zhang X, Ning Z, Mayne J, Yang Y, Deeke SA, Walker K, et al. Widespread protein lysine acetylation in gut microbiome and its alterations in patients with Crohn’s disease. Nat Commun. 2020;11:4120. [DOI] [PMC free article] [PubMed] [Google Scholar]
- 31.Gonzalez CG, Mills RH, Zhu Q, Sauceda C, Knight R, Dulai PS, et al. Location-specific signatures of Crohn’s disease at a multi-omics scale. Microbiome. 2022;10:133. [DOI] [PMC free article] [PubMed] [Google Scholar]
- 32.Vitali R, Palone F, Armuzzi A, Fulci V, Negroni A, Carissimi C, et al. Proteomic analysis identifies three reliable biomarkers of intestinal inflammation in the stools of patients with inflammatory bowel disease. J Crohns Colitis. 2023;17:92–102. [DOI] [PubMed] [Google Scholar]
- 33.Abreu MT, Quintero MA, Garces L, Hazime H, Killian R, Faust KM, et al. A high-fiber, low-fat diet improves the symptoms and metabolic profile of patients with Crohn’s disease. medRxiv. 2024. 10.1101/2024.08.30.24312853.
- 34.Atreya R, Siegmund B. Location is important: differentiation between ileal and colonic Crohn’s disease. Nat Rev Gastroenterol Hepatol. 2021;18:544–58. [DOI] [PubMed] [Google Scholar]
- 35.Dulai PS, Singh S, Vande Casteele N, Boland BS, Rivera-Nieves J, Ernst PB, et al. Should we divide Crohn’s disease into ileum-dominant and isolated colonic diseases? Clin Gastroenterol Hepatol. 2019;17:2634–43. [DOI] [PMC free article] [PubMed] [Google Scholar]
- 36.Pierre N, Salée C, Vieujean S, Bequet E, Merli A, Siegmund B, et al. Review article: distinctions between ileal and colonic Crohn’s disease: from physiology to pathology. Aliment Pharmacol Ther. 2021;54:779–91. [DOI] [PubMed] [Google Scholar]
- 37.Amos GCA, Sergaki C, Logan A, Iriarte R, Bannaga A, Chandrapalan S, et al. Exploring how microbiome signatures change across inflammatory bowel disease conditions and disease locations. Sci Rep. 2021;11:18699. [DOI] [PMC free article] [PubMed] [Google Scholar]
- 38.Naftali T, Reshef L, Kovacs A, Porat R, Amir I, Konikoff FM, et al. Distinct microbiotas are associated with ileum-restricted and colon-involving Crohnʼs disease. Inflamm Bowel Dis. 2016;22:293–302. [DOI] [PubMed] [Google Scholar]
- 39.Levi Mortera S, Marzano V, Vernocchi P, Matteoli MC, Guarrasi V, Gardini S, et al. Functional and taxonomic traits of the gut microbiota in type 1 diabetes children at the onset: a metaproteomic study. Int J Mol Sci. 2022;23: 15982. [DOI] [PMC free article] [PubMed] [Google Scholar]
- 40.Wiśniewski JR. Filter-aided sample preparation for proteome analysis. Methods Mol Biol Clifton NJ. 2018;1841:3–10. [DOI] [PubMed] [Google Scholar]
- 41.Blakeley-Ruiz JA, Kleiner M. Considerations for constructing a protein sequence database for metaproteomics. Comput Struct Biotechnol J. 2022;20:937–52. [DOI] [PMC free article] [PubMed] [Google Scholar]
- 42.Zhang X, Ning Z, Mayne J, Moore JI, Li J, Butcher J, et al. MetaPro-IQ: a universal metaproteomic approach to studying human and mouse gut microbiota. Microbiome. 2016;4:4. [DOI] [PMC free article] [PubMed] [Google Scholar]
- 43.Cheng K, Ning Z, Zhang X, Li L, Liao B, Mayne J, et al. MetaLab: an automated pipeline for metaproteomic data analysis. Microbiome. 2017;5:5. [DOI] [PMC free article] [PubMed] [Google Scholar]
- 44.Xia Y. Statistical normalization methods in microbiome data with application to microbiome cancer research. Gut Microbes. 2023;15: 2244139. [DOI] [PMC free article] [PubMed] [Google Scholar]
- 45.Plancade S, Berland M, Blein-Nicolas M, Langella O, Bassignani A, Juste C. A combined test for feature selection on sparse metaproteomics data—an alternative to missing value imputation. PeerJ. 2022;10: e13525. [DOI] [PMC free article] [PubMed] [Google Scholar]
- 46.Zhou Y, Zhou B, Pache L, Chang M, Khodabakhshi AH, Tanaseichuk O, et al. Metascape provides a biologist-oriented resource for the analysis of systems-level datasets. Nat Commun. 2019;10:1523. [DOI] [PMC free article] [PubMed] [Google Scholar]
- 47.Aldars-García L, Chaparro M, Gisbert JP. Systematic review: the gut microbiome and its potential clinical application in inflammatory bowel disease. Microorganisms. 2021;9:977. [DOI] [PMC free article] [PubMed] [Google Scholar]
- 48.Núñez-Sánchez MA, Melgar S, O’Donoghue K, Martínez-Sánchez MA, Fernández-Ruiz VE, Ferrer-Gómez M, et al. Crohn’s disease, host–microbiota interactions, and immunonutrition: dietary strategies targeting gut microbiome as novel therapeutic approaches. Int J Mol Sci. 2022;23: 8361. [DOI] [PMC free article] [PubMed] [Google Scholar]
- 49.Sigall-Boneh R, Pfeffer-Gik T, Segal I, Zangen T, Boaz M, Levine A. Partial enteral nutrition with a Crohnʼs disease exclusion diet is effective for induction of remission in children and young adults with Crohnʼs disease. Inflamm Bowel Dis. 2014;20:1353–60. [DOI] [PubMed] [Google Scholar]
- 50.Lewis JD, Sandler RS, Brotherton C, Brensinger C, Li H, Kappelman MD, et al. A randomized trial comparing the specific carbohydrate diet to a editerranean diet in adults with Crohn’s disease. Gastroenterology. 2021;161:837-852.e9. [DOI] [PMC free article] [PubMed] [Google Scholar]
- 51.Cox SR, Lindsay JO, Fromentin S, Stagg AJ, McCarthy NE, Galleron N, et al. Effects of low FODMAP diet on symptoms, fecal microbiome, and markers of inflammation in patients with quiescent inflammatory bowel disease in a randomized trial. Gastroenterology. 2020;158:176-188.e7. [DOI] [PubMed] [Google Scholar]
- 52.Reese AT, Pereira FC, Schintlmeister A, Berry D, Wagner M, Hale LP, et al. Microbial nitrogen limitation in the mammalian large intestine. Nat Microbiol. 2018;3:1441–50. [DOI] [PMC free article] [PubMed] [Google Scholar]
- 53.Sokol H, Pigneur B, Watterlot L, Lakhdari O, Bermúdez-Humarán LG, Gratadoux J-J, et al. Faecalibacterium prausnitzii is an anti-inflammatory commensal bacterium identified by gut microbiota analysis of Crohn disease patients. Proc Natl Acad Sci U S A. 2008;105:16731–6. [DOI] [PMC free article] [PubMed] [Google Scholar]
- 54.Kowalska-Duplaga K, Gosiewski T, Kapusta P, Sroka-Oleksiak A, Wędrychowicz A, Pieczarkowski S, et al. Differences in the intestinal microbiome of healthy children and patients with newly diagnosed Crohn’s disease. Sci Rep. 2019;9:18880. [DOI] [PMC free article] [PubMed] [Google Scholar]
- 55.Quévrain E, Maubert MA, Michon C, Chain F, Marquant R, Tailhades J, et al. Identification of an anti-inflammatory protein from Faecalibacterium prausnitzii, a commensal bacterium deficient in Crohn’s disease. Gut. 2016;65:415–25. [DOI] [PMC free article] [PubMed] [Google Scholar]
- 56.Rigottier-Gois L. Dysbiosis in inflammatory bowel diseases: the oxygen hypothesis. ISME J. 2013;7:1256–61. [DOI] [PMC free article] [PubMed] [Google Scholar]
- 57.Liu X, Mao B, Gu J, Wu J, Cui S, Wang G, et al. Blautia—a new functional genus with potential probiotic properties? Gut Microbes. 2021;13: 1875796. [DOI] [PMC free article] [PubMed] [Google Scholar]
- 58.Gregor A, Auernigg-Haselmaier S, Malleier M, Bruckberger S, Séneca J, Pjevac P, et al. Fiber consumption stimulates the activity of microbial bile salt hydrolases. J Funct Foods. 2023;107: 105707. [Google Scholar]
- 59.Chen J, Wright K, Davis JM, Jeraldo P, Marietta EV, Murray J, et al. An expansion of rare lineage intestinal microbes characterizes rheumatoid arthritis. Genome Med. 2016;8:43. [DOI] [PMC free article] [PubMed] [Google Scholar]
- 60.Gomez-Arango LF, Barrett HL, Wilkinson SA, Callaway LK, McIntyre HD, Morrison M, et al. Low dietary fiber intake increases Collinsella abundance in the gut microbiota of overweight and obese pregnant women. Gut Microbes. 2018;9:189–201. [DOI] [PMC free article] [PubMed] [Google Scholar]
- 61.Tett A, Pasolli E, Masetti G, Ercolini D, Segata N. Prevotella diversity, niches and interactions with the human host. Nat Rev Microbiol. 2021;19:585–99. [DOI] [PMC free article] [PubMed] [Google Scholar]
- 62.Gophna U, Sommerfeld K, Gophna S, Doolittle WF, Veldhuyzen van Zanten SJO. Differences between tissue-associated intestinal microfloras of patients with Crohn’s disease and ulcerative colitis. J Clin Microbiol. 2006;44:4136–41. [DOI] [PMC free article] [PubMed] [Google Scholar]
- 63.Xu N, Bai X, Cao X, Yue W, Jiang W, Yu Z. Changes in intestinal microbiota and correlation with TLRs in ulcerative colitis in the coastal area of northern China. Microb Pathog. 2021;150: 104707. [DOI] [PubMed] [Google Scholar]
- 64.Torres AG, Redford P, Welch RA, Payne SM. TonB-dependent systems of uropathogenic Escherichia coli : Aerobactin and heme transport and TonB are required for virulence in the mouse. O’Brien AD, editor. Infect Immun. 2001;69:6179–85. [DOI] [PMC free article] [PubMed] [Google Scholar]
- 65.Mills RH, Dulai PS, Vázquez-Baeza Y, Sauceda C, Daniel N, Gerner RR, et al. Multi-omics analyses of the ulcerative colitis gut microbiome link Bacteroides vulgatus proteases with disease severity. Nat Microbiol. 2022;7:262–76. [DOI] [PMC free article] [PubMed] [Google Scholar]
Associated Data
This section collects any data citations, data availability statements, or supplementary materials included in this article.
Supplementary Materials
Additional file 1. The detailed inclusion/exclusion criteria and dyadic psychosocial support intervention utilized in the original study.
Additional file 2. Summary of the label-free quantification (LFQ) analysis of proteins identified by searching against the SwissProt Homo sapiens database. Each sheet corresponds to a comparison between two groups of samples.
Additional file 3. Summary of LFQ analysis of bacterial protein groups (PGs) identified by searching against the sample-specific database (SSDB) generated from the “integrated reference catalog of the human gut microbiome” database (IGC DB). Abundance ratios were calculated on a matrix of PGs present in at least 50% of samples across all groups (Gr1, Gr2, Gr3 and HHCs). Missing values were imputed by group. Each sheet corresponds to a comparison between two groups of samples. Tables include the functional annotation and the taxonomic assignment.
Additional file 4. Summary of LFQ analysis of bacterial PGs identified by searching against the SSDB generated from the IGC DB. Abundance ratios were calculated on a matrix of PGs present in at least 50% of samples from Gr2 and Gr3 separately. Missing values were imputed by disease location groups (L1 or L2/L3). Each sheet corresponds to a comparison between two groups of samples. Tables include the functional annotation and the taxonomic assignment.
Additional file 5. Abundance distribution of selected COGs involved in carbohydrate metabolism in the HHC, L1 and L2/L3 groups at baseline, week 8, and over time. COGs were selected if they were associated with protein groups with significant increases in abundance in HHCs compared with L1 and L2/L3 patients or in L2/L3 patients compared with L1 patients. The figure displays changes in abundance situated within metabolic pathways; the table supplies p values for comparisons of COG abundance within HHC, L1 and L2/L3 groups and between HHCs and disease location subgroups at different time points.
Additional file 6: Fig. S1. Flow chart of the bioinformatics pipeline applied in this study.
Additional file 7: Fig. S2. Human and bacterial peptides. A) Bar chart showing the mean number of IDs and the percentage of human proteins per group of individuals. B) Pie chart displaying the total number of identified bacterial and human peptides. C) Pie charts displaying the summed intensity of peptides identified in the IGC DB and in the SwissProt Homo sapiens DB for healthy subjects (left) and CD patients (right). D) Venn diagrams showing the distribution of identified human proteins in each group of subjects at the three time points.
Additional file 8: Fig. S3. Principal biological processes associated with the upregulated human proteins in CD patients compared with HHCs. Results of enrichment analyses.
Additional file 9: Fig. S4. Summed intensity of taxon-specific peptides identified in Crohn’s disease (CD) samples at baseline. Bars are grouped according to Montreal classification. B1: inflammatory, B2: fibrostenotic, B2: penetrating and perforating. To simplify the figure, if the algorithm assigned the LCA at the species level, the corresponding genus is displayed. Colors indicate the LCA assigned to the peptide sequence.
Additional file 10: Fig. S5. Principal coordinate plots displaying data from stool samples collected at each time point. A) CD patients who received one-time diet counseling vs. CD patients who received the catered diet. B) CD patients who received one-time diet counseling vs. HHCs. C) CD patients who received the catered diet vs. HHCs.
Additional file 11: Fig. S6. Numbers of up- and downregulated PGs, with the most representative COG categories and KEGG pathways. Up- and downregulated PGs were determined by LFQ analysis. To reduce the number of colors reflecting the LCA assigned to protein groups, wherever the assignment was performed at the genus or species level, the corresponding family is displayed. A) Comparisons of Gr1 with the HHC group at the three time points. B) Comparisons of all patients that received the catered diet (Gr2+Gr3) and the HHC group at the three time points.
Additional file 12: Table S1. Number of peptides and PGs identified via LC–MS/MS of stool samples. Samples were searched against the IGC DB and the SwissProt "Homo sapiens" DB. Values are averaged between the two technical replicates.
Additional file 13: Table S2. Values of the relative abundance of the averaged taxon-specific peptide intensity for each subject at baseline, week 8, and week 36.
Data Availability Statement
The datasets supporting the conclusions of this article are included within the article and its additional files. All raw data from LC–MS/MS analysis can be retrieved at the MassIVE repository with the accession number MSV000093975.