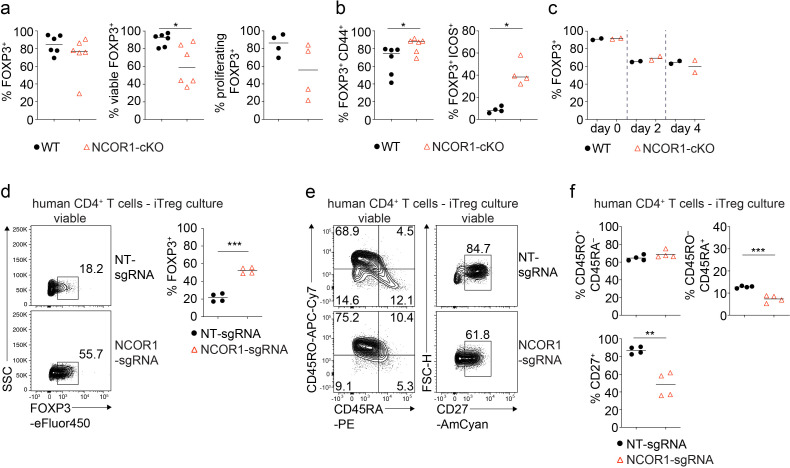
Figure 2. NCOR1 controls effector features in murine and human iTreg cells.
(a,b) Naïve wild-type (WT) and NCOR1-cKO CD4+ T cells were activated with anti-CD3/anti-CD28 for 3 days in the presence of TGFβ and IL2. (a) Diagrams show the summary of the percentages of WT and NCOR1-cKO FOXP3+ (left), of viable FOXP3+ (middle) and of proliferating FOXP3+ (right) iTreg cells at day 3. (b) Summaries of the percentages of CD44hi FOXP3+ (left) and ICOS+ FOXP3+ (right) cells. (c) Maintenance of FOXP3 expression in iTreg cells differentiated from WT and NCOR1-cKO naive CD4+ T cells over the course of 3 days upon restimulation with anti-CD3/anti-CD28 in the absence of TGFβ. (d) Flow cytometric analysis showing FOXP3 expression in human CD4+ T cells cultured under iTreg conditions after CRISPR-Cas9-mediated knockout of NCOR1 (NCOR1-sgRNA) or in non-targeting control samples (NT-sgRNA). Diagram at the right shows the summary of all experiments. (e) Flow cytometric analysis showing CD45RA, CD45RO, and CD27 expression on human iTreg cells after CRISPR-Cas9-mediated NCOR1 knockout as described in (d). (f) Summaries of the experiments as described in (e). (d,e) Cells were pre-gated on the total viable cell population. (a,b,c) Each symbol indicates one mouse. Horizontal bars indicate the mean. *p<0.05, **p<0.01, and ***p<0.001. (a,b,c) Unpaired two-tailed Student’s t-test. Data show a summary (a,b,c) of two to six mice that were analyzed in one to three experiments. (d,f) Each symbol indicates one sample. Horizontal bars indicate the mean. *p<0.05, **p<0.01, and ***p<0.001; unpaired two-tailed Student’s t-test (d,f). Data are representative (d,e) or show the summary (d,f) of CD4+ T cells from four individual healthy donors which were analyzed in one experiment.

