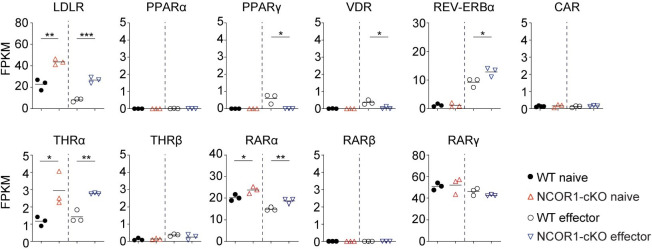
Author response image 3. Summary showing the expression levels (values showing as fragments per kilobase of transcript per million mapped reads; FPKM) of the indicated genes in naïve and effector WT and NCOR1cKO Treg cells as determined by RNA-seq.
Each symbol represents one sample (2 mice per sample, 3 independent sample preparations steps).

