

Abstract
Common fragile sites are chromosomal loci prone to breakage and rearrangement that can be induced by aphidicolin, an inhibitor of DNA polymerases. Within these loci, sites of preferential DNA breaks were proposed to correlate with peaks of enhanced DNA flexibility, the function of which remains elusive. Here we show that mammalian DNA replication origins are enriched in peaks of enhanced flexibility. This finding suggests that the search for these features may help in the mapping of replication origins, and we present evidence supporting this hypothesis. The association of peaks of flexibility with replication origins also suggests that some origins may associate with minor levels of fragility. As shown here, an increased sensitivity to aphidicolin was found near two mammalian DNA replication origins.
INTRODUCTION
Common fragile sites are chromosomal loci prone to breaks, gaps or constrictions when cells are exposed to various stresses (1,2). These sites, which may span hundreds of kilobases and include several recombination hot spots, do not result from mutation but rather are normal components of the chromosome. The sequences and mechanisms responsible for the fragility at these sites remain largely unknown. The common fragile sites presently cloned and sequenced are induced by aphidicolin, an inhibitor of DNA polymerases α, δ and ɛ. Because these sites are A+T rich, putative motifs corresponding to DNA replication origins or matrix attachment regions were searched for and found (3,4), although experimental mapping and characterisation of such features are still missing. However, replication timing studies have led to the proposition that late replication, or delayed replication, are involved in chromosome fragility (5–7). Furthermore, because in rare fragile sites the expanded CGG repeats were shown to affect DNA helix flexibility, leading to repression of nucleosome assembly, decondensation and fragility, variations in flexibility were calculated for three common fragile sites (8–10). The FlexStab program, which measures variations in the helix twist angle as the flexibility parameter (11), was developed for this purpose (8). It enabled it to be shown that the three common fragile sites contain high concentrations of peaks of enhanced DNA helix flexibility, which are otherwise scattered in the genome (8–10). Previous analysis revealed variable levels of fragility within FRA3B, the most active human fragile site (12), and peaks of enhanced flexibility colocalise with some hot spots of breakage within this site (8,10).
In recent years, several results have strengthened a previously proposed hypothesis (13) that common fragile sites are involved in tumorigenesis. The colocalisation of fragile sites and sites of integration of papillomaviruses is now demonstrated at the molecular level (14). Furthermore, evidence that the gene for the fragile histidine triad (FHIT), which maps within FRA3B and is frequently rearranged in cancer cells, is a tumour suppressor has been obtained (15). In addition, fragile sites were recently shown to play a major role in gene amplification (16–18), a mutation process that relies on chromosome breakage (18–21) and is specific to cancer cells (22–25). Thus, identification of the mechanisms and sequences important for chromosome fragility appears as a major goal to understand genome instability in tumour cells.
The molecular analysis of several independent Chinese hamster cell lines amplified for the adenylate deaminase 2 (AMPD2) gene revealed the presence of a recombination hot spot ~30 kb upstream the AMPD2 gene (26–28), which lies within an A+T-rich region (29). These observations led us to test if the region upstream the AMPD2 gene is a common fragile site. As we show here, the treatment of Chinese hamster cells with aphidicolin leads to recurrent breaks within this region, although less frequently than at the previously mapped Chinese hamster major fragile sites (17,30). In the present system, not only the nucleotide sequence of the region, but also information on its replication pattern and chromatin structure is available (27,29,31,32). Using FlexStab, the software previously designed to analyse flexibility at human common fragile sites (8–10), we show that peaks of enhanced flexibility precisely colocalise with previously identified rearrangement sites within the recombination hot spot, thus supporting the notion that such peaks mark sites important for chromosome rearrangements. In addition, FlexStab analysis detected flexibility peaks of equivalent intensities at the level of the DNA replication origin oriGNAI3 (31,32), which is located a few kilobases away from the recombination hot spot. In order to test the generality of this observation, we expanded our analysis to other well-characterised mammalian DNA replication origins. Because the mapping of mammalian replication origins relies on rather difficult and time-consuming techniques, only a few origins have been reliably and precisely mapped for now (33,34). These include the origins downstream of the Chinese hamster dihydrofolate (DHFR) gene, and at human loci for the c-myc, β-globin, lamin B2 and rDNA genes. We show that peaks of enhanced flexibility are indeed associated with replication origins at all these loci. Furthermore, although flexibility peaks can be found outside initiation regions, we show that they are markedly over-represented at origins. This finding further suggested that the detection of flexibility peaks with FlexStab could contribute to the mapping of mammalian DNA replication origins, an important possibility given the present technical difficulties to map origins experimentally. We propose criteria for the use of FlexStab that should be useful to predict potential mammalian replication origins in hundreds of kilobases, and that may detect variations in the density of replication origins among different loci.
Because flexibility peaks were proposed to mark sites of chromosome rearrangements, the finding of such peaks at replication origins implied that origin regions could participate in chromosome fragility. In support of this hypothesis, FISH analyses of aphidicolin-treated hamster cells revealed recurrent aphidicolin-induced breaks at the GNAI3–GNAT2 locus and the ori-β region downstream from the DHFR gene, but not at the AMPD2 locus which does not contain a replication origin. Furthermore, the rearrangements described previously at some human loci, such as the β-globin or the rDNA loci, provide additional evidence that some replication origins may associate with at least minor levels of chromosome fragility and recombinogenicity.
MATERIALS AND METHODS
Cell lines and conditions for aphidicolin treatment
Line GMA32, a Chinese hamster lung fibroblast cell line, was described previously (28). In a typical experiment, GMA32 cells were plated in 10 cm dishes at 5 × 10⁵ cells/dish in normal culture medium, and incubated at 37°C for 1.5 h before addition of aphidicolin at the final concentrations of 0, 0.3, 0.5 and 0.8 µg/ml. The use of variable concentrations of aphidicolin was performed to circumvent the observed experimental variations in the efficiency of fragile site induction. With this procedure, we were able to select and analyse cell populations with similar percentages of chromosome breaks. After 20.5 h of growth in the presence of aphidicolin, nocodazole (10 µM) was added in order to prepare metaphase plates, then cells were recovered and spread on slides 3.5 h later as described previously (35). To estimate the effects of aphidicolin, thymidine incorporation was determined as described previously (31), at various timepoints after aphidicolin addition. Typical results showed that thymidine incorporation is minimal at the beginning of the treatment (15 min after aphidicolin addition, incorporation is 24% of that observed for untreated cells). Incorporation then increases linearly, and remains <50% of that observed for untreated cells during the first 16 h of treatment.
In situ hybridisation
FISH analysis was performed essentially as described (21). Cosmid 61 W14, a cosmid described previously (28), was labelled with biotin using nick translation, and the probe was recovered by filtration through Quick Spin Columns (Sephadex G-50; Boehringer). Slides of GMA32 cells, treated with RNase and Proteinase K as described (35), were hybridised with a hybridisation mixture consisting of 10 µl total volume per slide containing 50 ng of cosmid probe, 10 µg of sonicated GMA32 genomic DNA, 50% formamide, 1% Tween 20 and 10% dextran sulfate in 2× SSC. This hybridisation mixture was heated for 10 min at 70°C and placed at 37°C for 20 min, then applied to slides pre-heated to 70°C for 2.5 min in 70% formamide, 2× SSC, pH 7.0. Hybridisation was at 37°C overnight. Biotin was detected with alternating layers of fluoresceinated avidin and biotin-conjugated goat anti-avidin antibody (Vector Labs), and slides were mounted with Vectashield (Vector labs), an antifading preparation containing propidium iodide. Hybridisations with the previously described cosmid 56 A3 (31) or with cosmid c SC-26 covering the initiation region downstream the DHFR gene, a kind gift from J. L. Hamlin (Charlottesville, VA), were carried out under the same conditions.
DNA flexibility analysis
Potential local variations in the DNA structure, expressed as fluctuations in the twist angle (which measures the rotation of a base pair about the axis perpendicular to the base plane, see 11) and referred to as DNA flexibility, were measured using the FlexStab program (8), available at the Hebrew University of Jerusalem web site (http://leonardo.ls.huji.ac.il /departments/genesite/faculty/bkerem.htm). Sequence analyses were performed exactly as described (8): the overlapping windows were 100 bp, and dinucleotide value was added along the window and averaged by the window length. For each sequence, the mean and standard deviation values were determined with StatView 4.5 (Abacus Concepts) and used to plot numerical values with StatView or CricketGraph III (Computer Associates).
The analysed sequence upstream the Chinese hamster AMPD2 gene (16 890 bp) results from linking the sequences for GNAI3, the intergenic GNAI3–GNAT2 region, and GNAT2, accession numbers X05583, X79282, X96664 and Y08232 and correspond to sequences contained within cosmid 61 W14. The analysed sequence downstream of the Chinese hamster DHFR gene (10 825 bp) results from linking sequences X94372 and AF028017. Accession number for the human c-myc sequence (10 996 bp) is J00120. The sequence analysed for the human lamin B2 locus (12 400 bp) corresponds to the linking of nucleotides 104 127–107 914 of sequence AC011522, the sequence of the origin region M94363 (6953 bp), and nucleotides 114 928–116 588 of AC011522. Based on its homology with sequence M94363, AC011522 is a working draft sequence of a clone from chromosome 11 that is reliable at 98.961% in this region. We have verified that the sequences shared by AC011522 and M94363 display similar flexibility patterns, so that the pattern that results from only AC011522 data appears reliable. The total length of the analysed sequence (12 400 bp) corresponds to the described size for which the replication pattern of the locus was assayed (36). For the human β-globin locus, the analysed sequence (62 940 bp) consists of nucleotides 19 289–73 308 of sequence J00179, and nucleotides 51–8970 of sequence AF137131. The accession number for human rDNA sequence (42 999 bp) is U13369. The accession number for the human sequence of the Filamin–G6PD region (219 447 bp) is L44140. The analysed sequence for the dystrophin locus (240 116 bp) results from linking the genomic sequences for exons 7–9 (accession number U60822) and exons 10–16 of the gene (accession number AC004468). The accession number for the partial sequence of the murine rDNA locus is X82564 (22 118 bp).
RESULTS
Aphidicolin-induced fragility and enhanced flexibility at the Chinese hamster GNAI3–GNAT2 region
We previously studied Chinese hamster mutant cell lines that acquired resistance to coformycin through intrachromosomal amplification of the adenylate deaminase 2 (AMPD2) gene. These studies revealed the presence of a hot spot for recombination in an A+T-rich region upstream of the AMPD2 gene (27,28; Fig. 1A). Since most common fragile sites induced by aphidicolin exhibit both recombinogenicity and A+T richness, these properties made this region a good candidate for a fragile site. We thus treated Chinese hamster cells for 24 h with 0.3–0.8 µg/ml aphidicolin. Metaphase spreads were prepared from these cell populations, and chromosomal constrictions, gaps, breaks or complex rearrangements were specifically observed after aphidicolin treatment. FISH experiments were performed with cosmid 61 W14, a probe specific to the region upstream the AMPD2 gene (28,32; Fig. 1A). This cosmid spans sequences containing, in addition to the recombination hot spot, the 3′ end of the GNAI3 gene (37), the GNAT2 gene (38), the DNA replication origin oriGNAI3 (31) and a large MAR (29) (Fig. 1A). We will refer below to the sequences contained in cosmid 61 W14 as the GNAI3–GNAT2 region. Available nucleotide sequence of this region reveals a mean A+T-richness of 58.2%, with 61.7% A+T in the region extending from the recombination hot spot to the replication origin. FISH results, presented in Figure 1B, reveal that some of these aberrations correlate with abnormal hybridisation signals. For example, constrictions were observed at the level of the GNAI3–GNAT2 region and a split or croissant-shape hybridisation signal could be simultaneously observed (Fig. 1B, 1). More importantly, several examples of a chromatid break at the level of the probed region were associated with an obviously split signal for one chromatid, and a normal hybridisation signal on the other chromatid (Fig. 1B, 2 and 3). These observations most likely reflect the breakage of one chromatid precisely within the GNAI3–GNAT2 region. Examples of split signals associated with complex chromosome rearrangements further support the conclusion that aphidicolin induces breaks within this region (Fig. 1B, 4).
Figure 1.
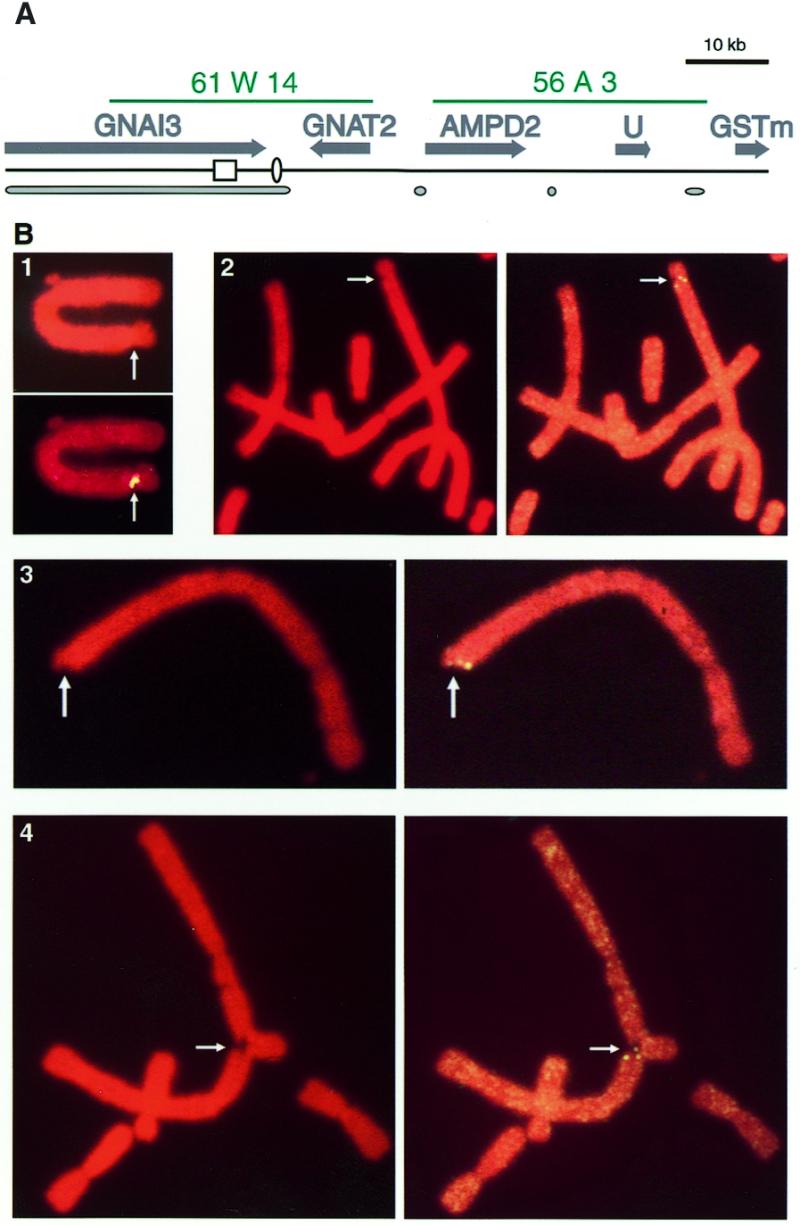
Aphidicolin induces recurrent breaks in the Chinese hamster GNAI3–GNAT2 region. (A) Map of the analysed regions. From top to bottom are shown cosmid probes used in this study (in green), genes (grey arrows, transcription directions), the hot spot for recombination (open box) and the DNA replication origin oriGNAI3 (open oval), putative MARs (grey ovals). (B) Examples of aberrant hybridisation signals observed with a 61 W14 biotinylated probe following aphidicolin treatment. 1, Croissant-shaped hybridisation signal colocalised with an aphidicolin-induced chromosome constriction. 2 and 3, Split signals colocalised with aphidicolin-induced single chromatid breaks. 4, Split signal colocalised with an interchromosomal rearrangement. Propidium iodide staining, top (1) or left (2–4); FISH with a 61 W14 biotinylated probe, bottom (1) or right (2–4).
In this experiment, eight cases of split signals were observed out of 960 breaks scored in 1261 metaphase plates. As a control, we verified that most breaks are specifically induced by aphidicolin, since the observation of 1000 metaphase spreads from untreated cells revealed only 10 breaks, none of which mapped within the GNAI3–GNAT2 region. Thus a break occurred in the GNAI3–GNAT2 region in ~0.8% of aphidicolin-induced breaks. This frequency is much lower than those reported for some major fragile sites such as human FRA3B or the Chinese hamster fragile site mapping at 1q26–q31. For example, the latter fragile site was associated with 5–13% of aphidicolin-induced chromosome aberrations (30). As an additional control, the same preparations of aphidicolin-induced cells were analysed with probe 56 A3, which enables evaluation of the potential fragility of the region containing the AMPD2 gene (Fig. 1A). Compared to the GNAI3–GNAT2 region, this region is much less A+T rich, contains neither a large MAR (29), nor a replication origin (31; F.Toledo and M.Debatisse, unpublished results), nor a recombination hot spot (28) (Fig. 1A). A total of 912 breaks were scored in this experiment, and none of them led to a split signal specific to the AMPD2 region. These results indicate that although the GNAI3–GNAT2 region presents a relatively low level of aphidicolin-induced fragility, it is at least eight times more fragile than immediately adjacent sequences. From these data we conclude that the GNAI3–GNAT2 region should be considered as a minor aphidicolin-inducible fragile site.
The analysis of human fragile site FRA3B revealed sub-regions of especially high fragility within this site (12). Sequence analysis of FRA3B and other fragile sites indicated that peaks of enhanced flexibility calculated by FlexStab often colocalise with these hot spots of breakage (8,10). Accordingly, we used FlexStab (with the same conditions described in common fragile sites analyses) to determine flexibility variations in the GNAI3–GNAT2 region. Interestingly, two peaks of significantly higher flexibility are present within the previously characterised hot spot for recombination (Fig. 2). The highest peak, with an absolute value of the DNA helix twist angle of 12.58°, is about 3.8 standard deviations (SD) above the mean flexibility of the total sequence. This peak exactly colocalises with two rearrangement sites previously described in independent AMPD2-amplified cell lines (27,39), and, by comparison with the homologous human sequence, with the site of integration of a snRNA/snRNP pseudogene (37) (Fig. 2). The smallest peak, with an absolute value of 12.14°, is 2.8 SD above the mean and colocalises with another rearrangement site found in an amplified mutant cell line (39) (Fig. 2). The exact colocalisation of these two peaks with previously described rearrangement sites further support the hypothesis that flexibility plays an important role in mammalian DNA recombination, and indicate that an estimated flexibility of 12.14°, deriving from the mean value by about 2.8 SD, is sufficient to correlate with a fragile point.
Figure 2.
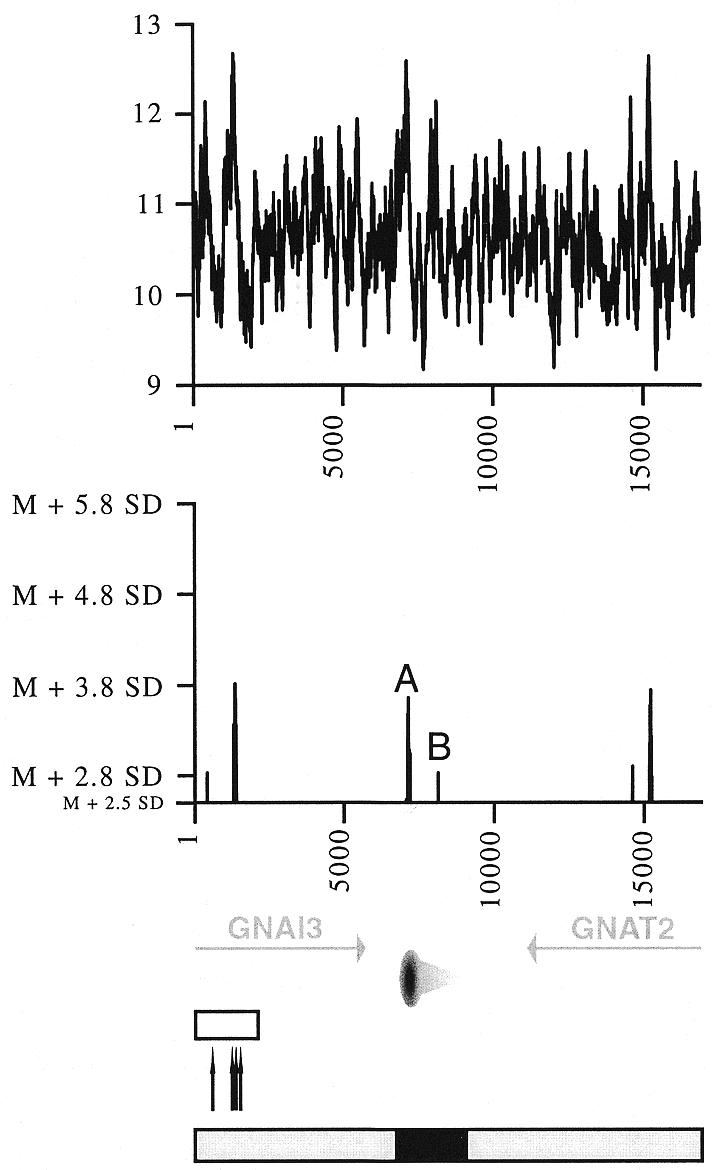
Flexibility analysis of the Chinese hamster GNAI3–GNAT2 region. Helix flexibility in the GNAI3–GNAT2 region was calculated with FlexStab, and values were plotted against the map of the region. Results are presented in two ways. Top graph, the vertical axis shows degrees of inclination of the twist angle (absolute values) and the horizontal axis indicates nucleotide position of each analysed 100 bp window. Bottom graph, the horizontal axis is as before, and the vertical axis shows relative flexibility peak values, i.e. values that are significantly above the mean value for the entire analysed sequence (mean value M = 10.601006°, SD = 0.542673). Only values >2.5 SD above the mean are shown. The two peaks close to the origin are designated as A and B, their precise location in sequence Y08232 are nucleotides 1533 and 2532, respectively. Bottom, map of the region, with the 3′ end of the GNAI3 gene and the GNAT2 gene (grey arrows, transcription directions), the oriGNAI3 replication origin (oval with a grey radial gradient, region where most replication initiation events occur; light grey triangle, region in which initiation events are very rare). Open box, hot spot for recombination; black arrows, sites of rearrangement or pseudogene insertion. Below this map are represented the initiation region (black box) and regions where no initiation events were detected (grey boxes); see Figure 4 for the peak distribution analysis.
Unexpectedly however, the recombination hot spot does not display a significantly higher flexibility than two other regions in the analysed sequence: one of them corresponds to the replication origin oriGNAI3 and the other lies within the GNAT2 gene (Fig. 2). The observation of an enhanced flexibility at the replication origin oriGNAI3 was particularly intriguing because it raised the question of enhanced flexibility as a common feature for sequences involved in replication initiation.
Peaks of enhanced flexibility at mammalian DNA replication origins
In order to determine whether peaks of higher flexibility coincide with replication initiation regions, we expanded our analysis to other mammalian DNA replication origins. Because the mapping of mammalian replication origins relies on rather difficult and time-consuming techniques, only a few have been reliably and precisely mapped for now (33,34). In this study, we restricted our analysis to loci for which a preferential initiation region was mapped by at least two independent replicon mapping techniques, and for which at least 10 kb of nucleotide sequence are available. Such loci include the ori-β region downstream of the Chinese hamster DHFR gene, and the human loci for the c-myc, lamin B2, β-globin and rDNA genes. Each locus contains at least one prominent initiation region that is <2.5 kb in length. The sequences at these loci were studied with FlexStab using 100 bp windows, as for the GNAI3–GNAT2 region. The mean and SD of flexibility values were determined, and peaks were considered to represent a significantly higher flexibility when at least 2.8 SD above the mean. This method, which searches for significant variations in flexibility, should be less dependent on potential differences between the studied loci than a search for absolute flexibility values.
Replication initiation was found to occur within a large zone downstream the Chinese hamster DHFR gene using 2D-gel electrophoreses (40). However, two prominent initiation sites separated by ~23 kb, termed ori-β and ori-γ, were detected within this zone (41,42). Ori-β was further mapped to a 0.5–2 kb region (43–45). A third initiation site, called ori-β′, was recently identified within this zone, but quantification of RNA-primed nascent strands suggests that it is 4.5 times less active than the nearby ori-β site (45). We analysed an 11 kb-long stretch of nucleotide sequence encompassing the ori-β and ori-β′ sites (sequence data around the ori-γ site is not available). As shown in Figure 3, only one peak of significantly higher flexibility was found within this sequence, at or close to ori-β. Replication initiation at the human c-Myc locus occurs preferentially within a 2.4 kb-long region immediately upstream of the Myc gene (46,47). The available 11 kb-long sequence reveals two peaks of significantly enhanced flexibility within the initiation region, and a third one 3′ to the c-myc gene (Fig. 3). Initiation of replication at the Lamin B2 locus has been mapped to a small (<1 kb) region (34,36,48). As shown in Figure 3, three peaks are observed at this locus, two of which map at, or close to the origin. The β-globin locus is of special interest since both the mapping of the origin and the determination of sequences required for its function have been performed (49,50). The sequence analysed (63 kb) spans the whole gene cluster and nine peaks of flexibility were observed, of which two map within the ‘core’ region essential for initiation (50). Unlike the other loci, the rDNA locus is naturally repeated in the human genome. In each cell, there are approximately 400 tandem iterations of an ∼43-kb repeat unit, containing sequences encoding a 13-kb primary transcript and a 30 kb segment referred to as the non-transcribed spacer (NTS). Replication analyses suggest that replication initiation occurs in the NTS, preferentially in a 5 kb-long region upstream, and a 2 kb-long region downstream of the rRNA genes (51–55). Flexibility analysis shows that all peaks map exclusively within the NTS, with two and three peaks respectively located within the initiation region downstream or upstream the genes (Fig. 3).
Figure 3.

Flexibility analysis of other well-characterised replication origin-containing loci. Patterns of flexibility at the Chinese hamster DHFR and human Myc, LaminB2, β-globin and rDNA loci are shown, calculated and represented as in Figure 2. Cord-like regions at the β-globin locus, essential core region (thicker) and auxiliary sequences (thinner). Only peak values >2.8 SD above the mean are represented. Mean (M) values are 10.633985° (DHFR); 10.103330° (Myc); 9.767353° (Lamin B2); 10.784719° (β-globin); 9.725195° (rDNA). SD values are 0.728790 (DHFR); 0.657300 (Myc); 0.416652 (Lamin B2); 0 668720 (β-globin); 0.778413 (rDNA). Note that rDNA units are tandemly repeated, so that the origin near 40 000 is 5′ to adjacent transcribed sequences (not represented). As in Figure 2, peaks close to initiation regions are designated C-N. Their precise position are: peak C, nucleotide 3817 in sequence X94372; peaks D and E, nucleotides 848 and 1793 in sequence J00120; peaks F and G, nucleotides 2211 and 3930 in sequence M94363; peaks H and I, nucleotides 61558 and 63082 in sequence J00179; peaks J–N, nucleotides 15898, 16605, 38297, 38676 and 41169 in sequence U13369. Below the maps, as before, are represented the initiation regions (black boxes) and regions where initiation events were not, or infrequently, detected (grey boxes); see Figure 4 for the peak distribution analysis.
Taken together with the analysis of the GNAI3–GNAT2 region (Fig. 2), the results presented here demonstrate that peaks of significant higher flexibility are observed at almost all mammalian replication origins. The only exception is the weak replication origin ori-β′ at the Chinese hamster DHFR locus (Fig. 3). Whether the lack of flexibility at ori-β′ participates in its low efficiency is an attractive possibility which remains to be tested. For each of the peaks close to origins (peaks A–N, Fig. 2 and 3), we have analysed the 100 bp window sequence centred on the highest flexibility value (i.e. the positions reported in the legends to Figs 2 and 3). As could be expected from previous analyses of replication origin regions, the comparison of the 14 sequences did not reveal any consensus sequence motif. Besides high flexibility, the only common feature of these 100 bp sequences is their A+T richness, although variable from 57 to 79%. In addition, although a subset of these sequences contained di-, tetra- or pentanucleotide repeats, most did not (data not shown). These results illustrate that various sequences may lead to enhanced flexibility. The results presented in Figures 2 and 3 also reveal the existence of enhanced flexibility peaks outside origin regions, raising the question of a random distribution of peaks. We considered that if peaks of enhanced flexibility are distributed non-randomly, the small initiation regions analysed here should be comparatively enriched in such peaks. We therefore determined the frequency of peaks within or outside replication origins. For the oriGNAI3, myc, laminB2 and β-globin loci, flexibility peaks were counted in 2.5-kb regions encompassing each origin, and in the sequences outside these initiation regions. For reasons described earlier, two initiation regions, one 2.5 kb and the other 5 kb in length were considered for the human rDNA locus, and analysis of the DHFR locus was performed by considering either ori-β only, or both ori-β and ori-β′. Results, presented in Figure 4A, show that peaks of enhanced flexibility are about six times more frequent within replication origin regions: frequencies of 0.678 and 0.711 peak/kb were observed within initiation regions (depending on the exclusion or inclusion of ori-β′) whereas a frequency of 0.116 peak/kb was found outside initiation regions. Evidence for such an enrichment for peaks in initiation regions is even more clear when a more stringent pattern is considered. Indeed, Figures 2 and 3 show that six out of eight origins contain at least two peaks of enhanced flexibility. A similar analysis with this parameter shows that doublets of peaks are almost 10 times more frequent within origin regions (0.312/0.033; Fig. 4B), hence supporting the notion that they are not distributed at random.
Figure 4.

Mammalian replication origins are enriched in peaks of enhanced flexibility. (A) Frequency of enhanced flexibility peaks within and outside initiation regions. Peaks of significantly enhanced flexibility (>M + 2.8 SD) were counted within (black histograms) and outside (grey histograms) initiation regions. Results are presented as the number of peaks per kilobase of sequence, for each locus, or for the combination of all loci. Results excluding (1) or including (2) the ori-β′ region are shown. (B) Frequency of doublets of peaks within and outside initiation regions. Doublets of peaks (peaks >M + 2.8 SD, separated by <2.5 kb) were counted and represented as before.
Because of this 10-fold enrichment in doublets of peaks at replication origins, we next investigated the possibility of using FlexStab with these parameters to help in the prediction of potential origins. The present difficulty to map mammalian origins experimentally makes such an approach desirable. The usefulness of FlexStab for replicon mapping studies is further suggested by the study of loci which replication patterns are only partially determined. For example, only six origins were found within the >2 Mb-long human dystrophin gene, suggesting the existence of 170–500 kb-long replicons in this region, although the exclusive use of exonic probes may have underestimated the number of origins (56). In contrast, analysis with a new experimental procedure of a 500 kb-long human region suggested an unusual clustering of 15 putative origins within the 220 kb-long region spanning the Filamin and glucose-6-phosphate dehydrogenase (G6PD) genes (57). However, only one candidate origin (2A3) was further studied and verified with a well-tried experimental method, so whether the new procedure overestimates the number of replication origins is presently unknown. Data suggest however that the two loci greatly differ in the density of replication origins they contain. We attempted to determine whether they also differ in the density of doublets of peaks of enhanced flexibility. Analysis of the Filamin–G6PD region using FlexStab as before disclosed 20 doublets, thus a density of 0.091 doublets per kilobase, suggesting a high density of replication origins in this region. Interestingly, some of the putative replication origins identified experimentally appear as putative origins with FlexStab, and these include fragments 2A3, 5B4 and 5A1, the three regions consistently represented in all replicon mapping experiments (57). Analysis of the dystrophin locus was carried out on 240 kb of available genomic sequences spanning exons 7–16. Experimental data suggest that this region contains a single origin within intron 7, and FlexStab analysis performed as before disclosed nine doublets, thus a density of 0.037 doublets per kilobase, with candidates in intron 7. Likewise, this suggests a low density of replication origins in this region. In conclusion, the agreement of FlexStab analyses with experimental data at both loci strengthens the notion that FlexStab may be an aid to the mapping of replication origins.
Aphidicolin-induced fragility at the Chinese hamster ori-β locus
Peaks of enhanced flexibility have been proposed to play a role in aphidicolin-induced fragility at major fragile sites. Here we found such peaks nested within replication origin loci, and an aphidicolin-induced fragility in the GNAI3–GNAT2 region. We next analysed the DHFR-associated origin locus, using the same cells and conditions of treatment with aphidicolin than for the GNAI3–GNAT2 region. Out of 1325 observed breaks, eight colocalised with split or aberrant signals observed by FISH with cosmid c SC-26, probing the origin region downstream the DHFR gene (e.g. Fig. 5). Thus breaks at this locus represent 0.6% of the total number of breaks, indicating an aphidicolin-induced fragility similar to the one observed at the GNAI3–GNAT2 locus. Although the low resolution of FISH does not allow us to distinguish between breaks occurring at the origins or elsewhere in the tested regions, these data indicate that aphidicolin induces recurrent chromosome breaks at most a few kilobases away from the tested replication origins, i.e. oriGNAI3 and ori-β.
Figure 5.
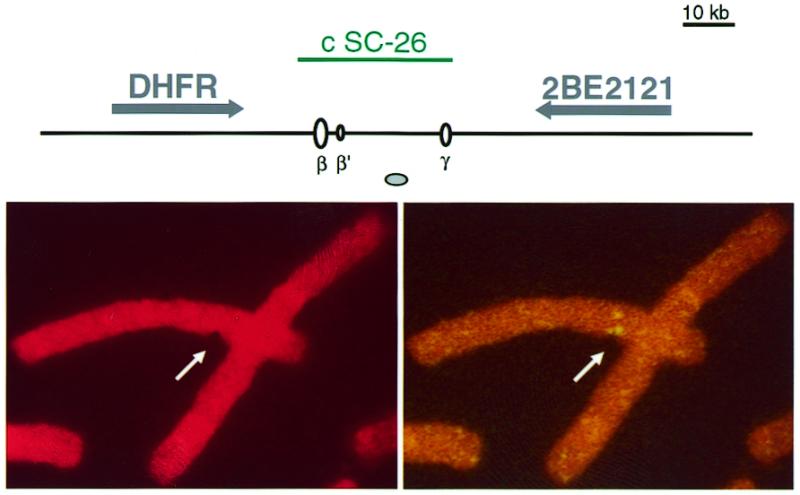
Example of an aphidicolin-induced break at the Chinese hamster DHFR locus. (Top) Map of the analysed region. The cosmid probe used in this study, genes, DNA replication origins and MAR are represented as in Figure 1. (Bottom) A split signal colocalises with an aphidicolin-induced chromatid break at the DHFR locus. (Left) Propidium iodide staining. (Right) FISH with a biotinylated c SC-26 probe.
DISCUSSION
Enhanced flexibility at replication origins: implications for replicon mapping
In this report, sequence analysis of the GNAI3–GNAT2 region disclosed peaks of significantly enhanced flexibility at the location of the replication origin oriGNAI3, suggesting that the presence of flexibility peaks could be a characteristic of replication origin regions (Fig. 2). This hypothesis was verified by the detection of flexibility peaks associated with ori-β at the Chinese hamster DHFR locus, and human origins at the Myc, laminB2, and β-globin loci, and 5′ and 3′ of rDNA genes. The only exception was the rather weak origin ori-β′ of the DHFR locus. Thus, such a structural DNA feature was associated with seven out of eight tested origin regions (Fig. 3). This association is not fortuitous, since peaks or peak doublets of enhanced flexibility are much more frequent within origin regions than within sequences lacking detectable replication initiation events (Fig. 4). These results suggest that enhanced DNA flexibility may be functionally important for replication initiation. The fact that peaks of enhanced flexibility map in the region essential for replication initiation at the β-globin locus (50) supports this hypothesis. Other evidence for such a role comes from the analysis of the murine rDNA locus. Both the replication pattern and nucleotide sequence of the murine rDNA locus are still incompletely known, preventing the inclusion of this locus in the analyses reported in Figure 3. However, two preferential initiation sites were found in the murine locus that map downstream and upstream of the rDNA genes like their human counterparts (58), and we found peaks of higher flexibility at these locations (not shown). The conservation, in a non-transcribed region, of functional replication origins and peaks of enhanced flexibility strengthens the hypothesis that FlexStab detect structural motifs that play a significant role in mammalian DNA replication initiation. Peaks of enhanced flexibility were also observed in other so-called ‘complex’ DNA replication origins from lower eukaryotes, e.g. ars3002 from Schizosaccharomyces pombe or the chorion gene-associated origin from Drosophila melanogaster (not shown)—further suggesting a general role of flexibility in replication initiation.
Furthermore, we proposed that the use of FlexStab could be helpful in the predictive mapping of DNA replication origins. At present, experimental mapping of mammalian DNA replication origins relies on rather difficult techniques. Here we analysed all the mammalian loci for which accurate replication patterns have been obtained using at least two independent techniques, and for which >10 kb of nucleotide sequence is available. We found only eight origins from six different loci that fulfil these criteria. This situation obviously cries out for the development of strategies allowing the prediction of replication origins in silico, in order to guide experimental mapping studies. Here we show that FlexStab-calculated doublets of enhanced flexibility peaks map to most mammalian replication origins, and are about 10 times more frequent within origin regions (Fig. 4). The observed frequencies, which rely on comparative analyses of ~20 kb of origin-containing sequences and 140 kb of flanking sequences (Figs 2 and 3), can constitute a basis for large-scale sequence analyses aimed at mapping putative replication origins. Of course, with the experimental characterisation of new replication origins and subsequent analyses of sequences within and outside initiation regions, the frequencies calculated here could be refined and a more accurate evaluation of the usefulness of FlexStab predictions should progressively emerge. Nevertheless, the comparative analysis of the dystrophin and the G6PD loci indicates that the conditions described here are at least able to detect variations in the density of replication origins at different loci. In addition, FlexStab predictions of replication origins could be refined by the use of software designed to analyse other features frequently found at replication origins, but which cannot be easily used to study hundreds of kilobases. For example, a search for features such as putative DNA unwinding elements (59), 20/21 matches to the consensus WAWTTDDWWWDHWGWHMAWTT (59), clusters of CpG dinucleotides (60,61) or putative MARs (62) could be easily performed within regions containing FlexStab-detected putative origins.
The GNAI3–GNAT2 region is a minor aphidicolin-inducible fragile site
Our initial aim was to determine whether the GNAI3–GNAT2 region overlaps a common fragile site. This hypothesis was tested by analysing the effects on this region of aphidicolin, the inducer of most common fragile sites. Results showed that aphidicolin induces breaks within the GNAI3–GNAT2 region but not within the adjacent AMPD2 region. However, the low resolution of the FISH technique prevented us from precisely localising the sites of breakage. Moreover, the level of sensitivity of the GNAI3–GNAT2 region is lower than those observed at the Chinese hamster 1q26-q31 or human FRA3B fragile sites. Common fragile sites were initially defined as sites of recurrent breaks frequently induced by aphidicolin and proposed to correspond to sites of recurrent chromosome rearrangements in cancer cells (13). However, since more than 31 000 cases of recurrent chromosomal aberrations in cancer are reported at present, cancer-related sites prone to breakage are now described for almost all human chromosome bands (63). Therefore, as previously discussed by Glover, the notion of ‘fragile site’ is a matter of appreciation (2), and the term ‘fragile site’ is often used for the 100 most fragile regions in the genome (2,8). Our results lead us to consider the GNAI3–GNAT2 region as a minor aphidicolin-inducible fragile site, whereas Chinese hamster 1q26–q31 or human FRA3B would be major aphidicolin-inducible fragile sites. Furthermore, previous analyses of major human fragile sites FRA3B, FRA7G and FRA7H led to the proposition that peaks of enhanced flexibility colocalise with sites of aphidicolin-induced chromosome breaks (8,10) and that the susceptibility to damage of a given flexibility peak could depend on the fragile site-inducing drug, carcinogen, tissue type or other factors (10). Here we show that, within the previously identified recombination hot spot, peaks of enhanced flexibility exactly colocalise with sites of rearrangements in amplified cell lines or of pseudogene insertion. Since both types of events were not induced by aphidicolin, this indicates that the coincidence of peaks of enhanced flexibility with sites of chromosome breakage is not restricted to aphidicolin induction.
Enhanced flexibility and aphidicolin-induced sensitivity near replication origins: implications for chromosome fragility
Clusters of flexibility peaks were proposed to play a role in aphidicolin-induced chromosome fragility. Here we found a clustering of flexibility peaks at the level of replication origins (Fig. 4) and an increased sensitivity to aphidicolin at two origin-containing loci (Figs 1 and 5). The increased sensitivity of origin-containing loci could simply result from the fact that these loci are enriched in peaks of enhanced flexibility because origins are enriched in such peaks. Alternatively however, the specific action of aphidicolin, which would block progressing replication forks at most loci soon after the initiation of replication, could target breaks more specifically in the vicinity of replication origins. Further analyses will be required to test these non-exclusive hypotheses, but in support of the latter, a recent study on the DNA replication of plasmids in Xenopus egg extracts showed that aphidicolin leads to replication forks stalled 0–2 kb away from the replication initiation site (64), and evidence that replication fork pausing leads to chromosome breaks is accumulating (65). Accordingly, the results gathered here may suggest that some replication origins associate with at least minor levels of chromosome fragility. While experimental evidence of an increased sensitivity to aphidicolin has been presented here for two hamster origin-containing loci, some of the human origin-containing loci described here may further support this hypothesis. Indeed, evidence that myc lies within a fragile region was previously obtained (66). Furthermore, rearrangements were repeatedly reported at the β-globin and rDNA loci (although not at the lamin B2 locus). At the β-globin locus rearrangement sites leading to the detection of thalassemic phenotypes and phenotypically silent recombination events map more frequently in the core region of the origin (67–70). However, most of them rely on meiotic events, and their relevance to mitotic instability remains to be determined. Human cells contain hundreds of copies of the rDNA locus, and variations in the size of the different copies was shown to result from unequal homologous exchanges, without obvious selective pressure (71,72). This locus contains two hot spots for recombination, and while one may result in part from the activity of a replication fork barrier (65), it is striking that both colocalise with the two regions of preferential replication initiation (71,72). These data, when considered together with the observed aphidicolin-induced fragility at the GNAI3–GNAT2 and DHFR origin-containing loci, are consistent with the hypothesis that some replication origins are associated with an increased fragility and recombinogenicity.
Finally, because most of the loci analysed here are probably minor aphidicolin-inducible fragile sites, whether or not our conclusions are relevant for major fragile sites such as human FRA3B is an open question. For example, FRA3B contains an impressive concentration of peaks of enhanced flexibility (8,10), and it has been shown that one cluster of sites of aphidicolin-induced rearrangements (12) colocalises with a doublet of peaks of enhanced flexibility (8). Considering our present results, a region exhibiting an increased sensitivity to aphidicolin is associated with a candidate replication origin. However, the increased sensitivity at such major fragile sites could result from the concentration of peaks of high flexibility unrelated to replication initiation regions. Obviously, the precise mapping of replication origins at major fragile sites appears as an important goal to determine whether the mechanisms of fragility are similar at those sites and at sites of much lower aphidicolin-induced fragility such as those described here.
Acknowledgments
ACKNOWLEDGEMENTS
We would like to thank Professor J. L. Hamlin for cosmid probe of the DHFR region, Professor G. M. Wahl and Dr J. L. Kolman for critical reading of the manuscript, and Professor G. Buttin for constant support. This work was supported in part by the University Pierre et Marie Curie, the Ligue Nationale Française contre le Cancer (Comité de Paris), the Association pour la Recherche sur le Cancer and the Fondation de France.
REFERENCES
- 1.Sutherland G.R., Baker,E. and Richards,R.I. (1998) Trends Genet., 14, 501–505. [DOI] [PubMed] [Google Scholar]
- 2.Glover T.W. (1998) Recent Results Cancer Res., 154, 185–199. [DOI] [PubMed] [Google Scholar]
- 3.Wang L., Paradee,W., Mullins,C., Shridhar,R., Rosati,R., Wilke,C.M., Glover,T.W. and Smith,D.I. (1997) Genomics, 41, 485–488. [DOI] [PubMed] [Google Scholar]
- 4.Palin A.H., Crichter,R., Fitzgerald,D.J., Anderson,J.N. and Farr,C.J. (1998) J. Cell Sci., 111, 1623–1634. [DOI] [PubMed] [Google Scholar]
- 5.Le Beau M.M., Rassool,F.V., Neilly,M.E., Espinosa,R.,III, Glover,T.W., Smith,D.I. and McKeithan,T.W. (1998) Hum. Mol. Genet., 7, 755–761. [DOI] [PubMed] [Google Scholar]
- 6.Wang L., Darling,J., Zhang,J.S., Huang,H., Liu,W. and Smith,D.I. (1999) Hum. Mol. Genet., 8, 431–437. [DOI] [PubMed] [Google Scholar]
- 7.Hellman A., Rahat,A., Scherer,S.W., Darvasi,A., Tsui,L.C. and Kerem,B. (2000) Mol. Cell. Biol., 20, 4420–4427. [DOI] [PMC free article] [PubMed] [Google Scholar]
- 8.Mishmar D., Rahat,A., Scherer,S.W., Nyakatura,G., Hinzmann,B., Kohwi,Y., Mandel-Gutfroind,Y., Lee,J.R., Drescher,B., Sas,D.E., Margalit,H., Platzer,M., Weiss,A., Tsui,L.C., Rosenthal,A. and Kerem,B. (1998) Proc. Natl Acad. Sci. USA, 95, 8141–8146. [DOI] [PMC free article] [PubMed] [Google Scholar]
- 9.Mishmar D., Mandel-Gutfreund,Y., Margalit,H., Rahat,A. and Kerem,B. (1999) Am. J. Hum. Genet., 64, 908–910. [DOI] [PMC free article] [PubMed] [Google Scholar]
- 10.Mimori K., Druck,T., Inoue,H., Alder,H., Berk,L., Mori,M., Huebner,K. and Croce,C.M. (1999) Proc. Natl Acad. Sci. USA, 96, 7456–7461. [DOI] [PMC free article] [PubMed] [Google Scholar]
- 11.Sarai A., Mazur,J., Nussinov,R. and Jernigan,R.L. (1989) Biochemistry, 28, 7842–7849. [DOI] [PubMed] [Google Scholar]
- 12.Paradee W., Wilke,C.M., Wang,L., Shridar,R., Mullins,C.M., Hoge,A., Glover,T.W. and Smith,D.I. (1996) Genomics, 35, 87–93. [DOI] [PubMed] [Google Scholar]
- 13.Yunis J.J. and Soreng,A.L. (1984) Science, 226, 1199–1204. [DOI] [PubMed] [Google Scholar]
- 14.Wilke C.M., Hall,B.K., Hoge,A., Paradee,W., Smith,D.I. and Glover,T.W. (1996) Hum. Mol. Genet., 5, 187–195. [DOI] [PubMed] [Google Scholar]
- 15.Huebner K., Druck,T., Siprashvili,Z., Croce,C.M., Kovatich,A. and MacCue,P.A. (1998) Recent Results Cancer Res., 154, 200–215. [DOI] [PubMed] [Google Scholar]
- 16.Kuo M.T., Vyas,R.C., Jiang,L.X. and Hittelman,W.N. (1994) Mol. Cell. Biol., 14, 5202–5211. [DOI] [PMC free article] [PubMed] [Google Scholar]
- 17.Coquelle A., Pipiras,E., Toledo,F., Buttin,G. and Debatisse,M. (1997) Cell, 89, 215–225. [DOI] [PubMed] [Google Scholar]
- 18.Coquelle A., Toledo,F., Stern,S., Bieth,A. and Debatisse,M. (1998) Mol. Cell, 2, 259–265. [DOI] [PubMed] [Google Scholar]
- 19.Windle B., Draper,B.W., Yin,Y., O’Gorman,S. and Wahl,G.M. (1991) Genes Dev., 5, 160–174. [DOI] [PubMed] [Google Scholar]
- 20.Toledo F., LeRoscouet,D., Buttin,G. and Debatisse,M. (1992) EMBO J., 11, 2665–2673. [DOI] [PMC free article] [PubMed] [Google Scholar]
- 21.Toledo F., Buttin,G. and Debatisse,M. (1993) Curr. Biol., 3, 255–264. [DOI] [PubMed] [Google Scholar]
- 22.Tlsty T.D., Margolin,B. and Lum,K. (1989) Proc. Natl Acad. Sci. USA, 86, 9441–9445. [DOI] [PMC free article] [PubMed] [Google Scholar]
- 23.Wright J.A., Smith,H.S., Watt,F.M., Hancock,M.C., Hudson,D.L. and Stark,G.R. (1990) Proc. Natl Acad. Sci. USA, 87, 1791–1795. [DOI] [PMC free article] [PubMed] [Google Scholar]
- 24.Yin Y., Tainsky,M.A., Bischoff,F.Z., Strong,L.C. and Wahl,G.M. (1992) Cell, 70, 937–948. [DOI] [PubMed] [Google Scholar]
- 25.Livingstone L.R., White,A., Sprouse,J., Livanos,E., Jacks,T. and Tlsty,T.D. (1992) Cell, 70, 923–935. [DOI] [PubMed] [Google Scholar]
- 26.Debatisse M., Hyrien,O., Petit-Koskas,E., Robert de Saint Vincent,B. and Buttin,G. (1986) Mol. Cell. Biol., 6, 1776–1781. [DOI] [PMC free article] [PubMed] [Google Scholar]
- 27.Hyrien O., Debatisse,M., Buttin,G. and Robert de Saint Vincent,B. (1987) EMBO J., 6, 2401–2408. [DOI] [PMC free article] [PubMed] [Google Scholar]
- 28.Debatisse M., Toledo,F., Robert de Saint Vincent,B. and Buttin,G. (1992) In Kellems,R.E. (ed.), Gene Amplification in Mammalian Cells – A Comprehensive Guide. Marcel Dekker Inc., New York, NY, pp. 173–183.
- 29.Fernandez M.A., Baron,B., Prigent,M., Toledo,F., Buttin,G. and Debatisse,M. (1997) J. Cell Biochem., 67, 541–551. [DOI] [PubMed] [Google Scholar]
- 30.Rassool F.V., McKeithan,T.W., Neilly,M.E., van Melle,E., Espinosa,R.,III. and Le Beau,M.M. (1991) Proc. Natl Acad. Sci. USA, 88, 6657–6661. [DOI] [PMC free article] [PubMed] [Google Scholar]
- 31.Toledo F., Baron,B., Fernandez,M.A., Lachagès,A.M., Mayau,V., Buttin,G. and Debatisse,M. (1998) Nucleic Acids Res., 26, 2313–2321. [DOI] [PMC free article] [PubMed] [Google Scholar]
- 32.Toledo F., Lachagès,A.M., Mayau,V. and Debatisse,M. (1999) Nucleic Acids Res., 27, 1600–1608. [DOI] [PMC free article] [PubMed] [Google Scholar]
- 33.DePamphilis M.L. (1999) Bioessays, 21, 5–16. [DOI] [PubMed] [Google Scholar]
- 34.Todorovic V., Falaschi,A. and Giacca,M. (1999) Front Biosci., 4, D859–D868. [DOI] [PubMed] [Google Scholar]
- 35.Toledo F., Smith,K.A., Buttin,G. and Debatisse,M. (1992) Mutat. Res., 276, 261–273. [DOI] [PubMed] [Google Scholar]
- 36.Giacca M., Zentilin,L., Norio,P., Diviacco,S., Dimitrova,D., Contreas,G., Biamonti,G., Perini,G., Weighardt,F., Riva,S. and Falaschi,A. (1994) Proc. Natl Acad. Sci. USA, 91, 7119–7123. [DOI] [PMC free article] [PubMed] [Google Scholar]
- 37.Baron B., Fernandez,M.A., Toledo,F., LeRoscouet,D., Mayau,V., Martin,N., Buttin,G. and Debatisse,M. (1994) Genomics, 24, 288–294. [DOI] [PubMed] [Google Scholar]
- 38.Baron B., Fernandez,M.A., Carignon,S., Toledo,F., Buttin,G. and Debatisse,M. (1996) Mamm. Genome, 7, 922–923. [DOI] [PubMed] [Google Scholar]
- 39.Hyrien O., Debatisse,M., Buttin,G. and Robert de Saint Vincent,B. (1988) EMBO J., 7, 407–417. [DOI] [PMC free article] [PubMed] [Google Scholar]
- 40.Vaughn J.P., Dijkwel,P.A. and Hamlin,J.L. (1990) Cell, 61, 1075–1087. [DOI] [PubMed] [Google Scholar]
- 41.Anachkova B. and Hamlin,J.L. (1989) Mol. Cell. Biol., 9, 532–540. [DOI] [PMC free article] [PubMed] [Google Scholar]
- 42.Handeli S., Klar,A., Meuth,M. and Cedar,H. (1989) Cell, 57, 909–920. [DOI] [PubMed] [Google Scholar]
- 43.Burhans W.C., Vassilev,L., Caddle,M.S., Heintz,N.H. and DePamphilis,M.L. (1990) Cell, 62, 955–965. [DOI] [PubMed] [Google Scholar]
- 44.Pelizon C., Diviacco,S., Falaschi,A. and Giacca,M. (1996) Mol. Cell. Biol., 16, 5358–5364. [DOI] [PMC free article] [PubMed] [Google Scholar]
- 45.Kobayashi T., Rein,T. and DePamphilis,M.L. (1998) Mol. Cell. Biol., 18, 3266–3277. [DOI] [PMC free article] [PubMed] [Google Scholar]
- 46.Ariga H., Imamura,Y. and Igushi-Ariga,S.M.M. (1989) EMBO J., 8, 4273–4279. [DOI] [PMC free article] [PubMed] [Google Scholar]
- 47.Trivedi A., Waltz,S.E., Kamath,S. and Leffak,M. (1998) DNA Cell Biol., 17, 885–896. [DOI] [PubMed] [Google Scholar]
- 48.Biamonti G., Perini,G., Weighardt,F., Riva,S., Giacca,M., Norio,P., Zentilin,L., Diviacco,S., Dimitrova,D. and Falaschi,A. (1992) Chromosoma, 102, S24–S31. [DOI] [PubMed] [Google Scholar]
- 49.Kitsberg D., Selig,S., Keshet,I. and Cedar,H. (1993) Nature, 366, 588–590. [DOI] [PubMed] [Google Scholar]
- 50.Aladjem M.I., Rodewald,L.W., Kolman,J.L. and Wahl,G.M. (1998) Science, 281, 1005–1009. [DOI] [PubMed] [Google Scholar]
- 51.Little R.D., Platt,T.H.K. and Schildkraut,C.L. (1993) Mol. Cell. Biol., 13, 6600–6613. [DOI] [PMC free article] [PubMed] [Google Scholar]
- 52.Coffman F.D., Georgoff,I., Fresa,K.L., Sylvester,J., Gonzalez,I. and Cohen,S. (1993) J. Cell Biochem., 51, 157–164. [DOI] [PubMed] [Google Scholar]
- 53.Yoon Y., Sanchez,A., Brun,C. and Huberman,J.A. (1995) Mol. Cell. Biol., 15, 2482–2489. [DOI] [PMC free article] [PubMed] [Google Scholar]
- 54.Gencheva M., Anachkova,B. and Russev,G. (1996) J. Biol. Chem., 271, 2608–2614. [DOI] [PubMed] [Google Scholar]
- 55.Scott R.S., Truong,K.Y. and Vos,J.M. (1997) Nucleic Acids Res., 25, 4505–4512. [DOI] [PMC free article] [PubMed] [Google Scholar]
- 56.Verbovaia L.V. and Razin,S.V. (1997) Genomics, 45, 24–30. [DOI] [PubMed] [Google Scholar]
- 57.Rivella S., Palermo,B., Pelizon,C., Sala,C., Arrigo,G. and Toniolo,D. (1999) Genomics, 62, 11–20. [DOI] [PubMed] [Google Scholar]
- 58.Gogel E., Langst,G., Grummt,I., Kunkel,E. and Grummt,F. (1996) Chromosoma, 104, 511–518. [DOI] [PubMed] [Google Scholar]
- 59.Dobbs D.L., Shaiu,W.L. and Benbow,R.M. (1994) Nucleic Acids Res., 22, 2479–2489. [DOI] [PMC free article] [PubMed] [Google Scholar]
- 60.Rein T., Zorbas,H. and DePamphilis,M.L. (1997) Mol. Cell. Biol., 17, 416–426. [DOI] [PMC free article] [PubMed] [Google Scholar]
- 61.Delgado S., Gomez,M., Bird,A. and Antequera,F. (1998) EMBO J., 17, 2426–2435. [DOI] [PMC free article] [PubMed] [Google Scholar]
- 62.Singh G.B., Kramer,J.A. and Krawetz,S.A. (1997) Nucleic Acids Res., 25, 1419–1425. [DOI] [PMC free article] [PubMed] [Google Scholar]
- 63.Mitelman F. (1998) Catalog of chromosome aberrations in cancer′98. CD-Rom v.1, Wiley-Liss, New York, NY.
- 64.Lucas I. and Hyrien,O. (2000) Nucleic Acids Res., 28, 2187–2193. [DOI] [PMC free article] [PubMed] [Google Scholar]
- 65.Rothstein R., Michel,B. and Gangloff,S. (2000) Genes Dev., 14, 1–10. [PubMed] [Google Scholar]
- 66.Hori T., Seki,N., Ohira,M., Saito,T., Yamauchi,M., Sagara,M., Hayashi,A., Tsuji,S., Ito,H. and Imai,T. (1998) Cancer Genet. Cytogenet., 101, 24–34. [DOI] [PubMed] [Google Scholar]
- 67. Human Gene Mutation Database: http://www.uwcm.ac.uk/uwcm/mg/search/119297.html
- 68.Chakravarti A., Buetow,K.H., Antonarakis,S.E., Waber,P.G., Boehm,C.D. and Kazazian,H.H. (1984) Am. J. Hum. Genet., 36, 1239–1258. [PMC free article] [PubMed] [Google Scholar]
- 69.Hall G.W., Sampietro,M., Barnetson,R., Fitzgerald,J., McCann,S. and Thein,S.L. (1993) Hum. Genet., 92, 28–32. [DOI] [PubMed] [Google Scholar]
- 70.Smith R.A., Ho,P.J., Clegg,J.B., Kidd,J.R. and Thein,S.L. (1998) Blood, 92, 4415–4421. [PubMed] [Google Scholar]
- 71.Wilson G.N., Szura,L.L., Rushford,C., Jackson,D. and Erickson,J. (1982) Am. J. Hum. Genet., 34, 32–49. [PMC free article] [PubMed] [Google Scholar]
- 72.Erickson J.M. and Schmickel,R.D. (1985) Am. J. Hum. Genet., 37, 311–325. [PMC free article] [PubMed] [Google Scholar]