Abstract
Monocyte-derived alveolar macrophages drive lung injury and fibrosis in murine models and are associated with pulmonary fibrosis in humans. Monocyte-derived alveolar macrophages have been suggested to develop a phenotype that promotes lung repair as injury resolves. We compared single-cell and cytokine profiling of the alveolar space in a cohort of 35 patients with post-acute sequelae of COVID-19 who had persistent respiratory symptoms and abnormalities on a computed tomography scan of the chest that subsequently improved or progressed. The abundance of monocyte-derived alveolar macrophages, their gene expression programs, and the level of the monocyte chemokine CCL2 in bronchoalveolar lavage fluid positively associated with the severity of radiographic fibrosis. Monocyte-derived alveolar macrophages from patients with resolving or progressive fibrosis expressed the same set of profibrotic genes. Our findings argue against a distinct reparative phenotype in monocyte-derived alveolar macrophages, highlighting their utility as a biomarker of failed lung repair and a potential target for therapy.
Subject terms: Viral infection, Chronic inflammation, Innate immunity
Misharin, Sala and colleagues show that in patients with lung fibrosis after COVID-19, monocyte-derived alveolar macrophages activate an inflammatory and fibrotic program that was similar in patients with either resolving or progressing fibrosis.
Main
Inhaled environmental toxins and pathogens can damage the alveolar epithelium and activate tissue-resident alveolar macrophages, inducing the release of cytokines and chemokines responsible for the recruitment of classic monocytes from the circulation to the alveolar space1. In response to signals from the alveolar microenvironment, monocytes rapidly differentiate into ‘monocyte-derived alveolar macrophages’, which often outnumber tissue-resident alveolar macrophages during lung injury and fibrosis and the abundance of which is associated with disease severity in mice2–6. Improved physiological outcomes when monocyte-derived alveolar macrophages are specifically deleted, including after bleomycin- and asbestos-induced pulmonary fibrosis4,5,7 and viral pneumonia6,8 in mice, indicate a causal role for these cells in lung injury and fibrosis.
Although monocyte-derived macrophages are necessary for repair after injury in other tissues1, evidence of a lung-reparative function for monocyte-derived alveolar macrophages is lacking. For example, deletion of monocyte-derived alveolar macrophages after establishment of lung fibrosis in mice ameliorates fibrosis5 and strategies that target epithelial repair in mice indirectly reduce the abundance and accelerate the differentiation of monocyte-derived alveolar macrophages toward a transcriptional phenotype similar to tissue-resident alveolar macrophages3. As most patients with COVID-19 (coronavirus disease 2019) improved, whereas others developed progressive lung fibrosis that led to death or required lung transplantation9, the COVID-19 pandemic provided a unique opportunity to address whether the transcriptome of monocyte-derived alveolar macrophages differed in individuals recovering from lung injury compared with those progressing to fibrosis.
Some patients with COVID-19 continue to have symptoms months after initial infection, a condition referred to as post-acute sequelae of COVID-19 (PASC)10,11. A subset of patients with PASC presented with shortness of breath, cough, hypoxemia and detectable abnormalities on computed tomography (CT) imaging of the lung12, which we refer to here as ‘respiratory PASC with radiographic abnormalities’ (RPRA). Many patients with RPRA improve, whereas some patients develop persistent or progressive fibrosis13. To identify the distinct cellular and molecular features associated with resolving or nonresolving RPRA, we analyzed serial CT imaging of the chest with molecular profiling of distal alveolar fluid with flow cytometry, single-cell RNA sequencing (scRNA-seq) and cytokine analysis in a cohort of patients with RPRA. We found that increased abundance of neutrophils, monocyte-derived alveolar macrophages and levels of the chemokine CCL2, which is a monocyte chemoattractant, in bronchoalveolar lavage (BAL) fluid was positively associated with the severity of fibrotic abnormalities on CT imaging. Monocyte-derived alveolar macrophages from patients with RPRA were significantly enriched for genes and gene sets associated with pulmonary fibrosis that did not differ between patients with resolving and patients with nonresolving fibrosis. Furthermore, the gene expression profiles of monocyte-derived alveolar macrophages from patients with resolving fibrosis were similar to those in patients who died or required lung transplantation for COVID-19 and patients with idiopathic pulmonary fibrosis (IPF). Our findings suggest that monocyte-derived alveolar macrophages are recruited to the alveolus in proportion to the severity of injury, where they activate a stereotypical transcriptional program that drives fibrosis. We did not observe a specific reparative transcriptional program in monocyte-derived alveolar macrophages during recovery from lung injury and fibrosis in humans.
Results
Fibrotic abnormalities in patients with RPRA improved with time
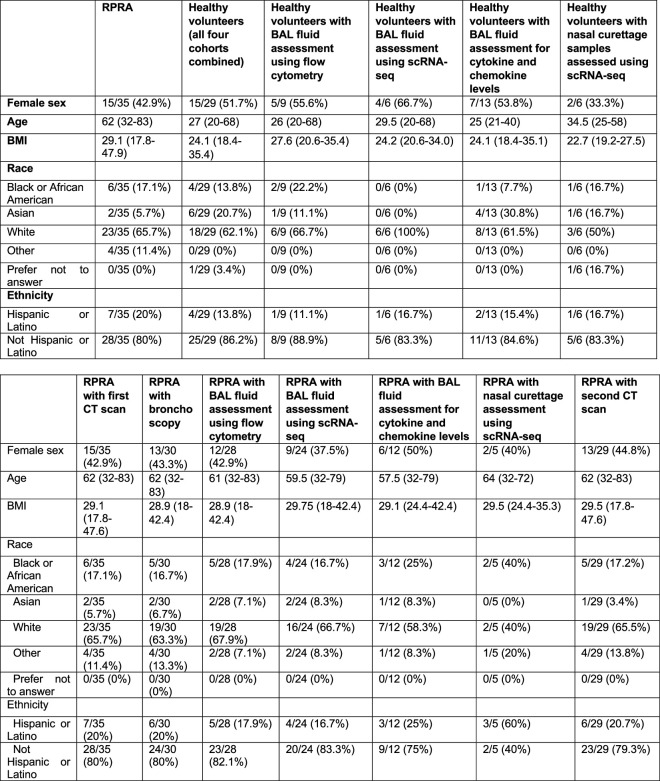
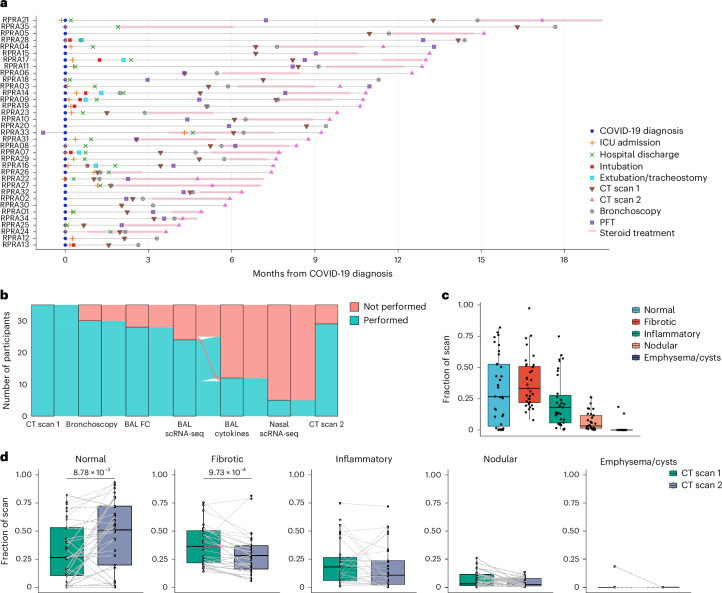
The study cohort included 35 patients with RPRA prospectively enrolled in an observational study at Northwestern Medicine between November 2020 and May 2022. All 35 patients underwent a CT scan before or at the time of enrollment and 29 underwent a follow-up CT scan (Table 1, Extended Data Table 1 and Supplementary Data 2). Bronchoscopy was performed on 30 patients a median of 159 d after their COVID-19 diagnosis (range 24–530 d) (Fig. 1a,b and Extended Data Table 1). Nasal curettage was performed on five patients with RPRA at the same time as their bronchoscopy, a median of 170 d (range 84–350 d) after their acute infection (Extended Data Table 1). BAL fluid samples from two separate unmatched cohorts of 12 and 9 healthy volunteers, respectively, and nasal mucosal curettage from a third cohort of 6 healthy volunteers were used as comparison (Extended Data Table 1). The median age of patients with RPRA was 62 years (range 32–83 years), 15 patients (43%) were female and 23 (66%) self-identified as white, 6 (17%) as Black or African American and 7 (20%) as Hispanic or Latino. For all four cohorts of healthy volunteers combined, the median age was 27 years (20–68 years), 15 patients (52%) were female and 18 patients (62%) self-identified as white, 4 (14%) as Black or African American and 4 (14%) as Hispanic or Latino (Extended Data Table 1 and Supplementary Data 2). Detailed demographics for individual cohorts and those patients who underwent each procedure are also included (Extended Data Table 1). All patients had respiratory symptoms on presentation, with shortness of breath being the most common symptom (97%), followed by cough (69%) (Table 1). The patients who received steroids for the treatment of RPRA (Fig. 1a) numbered 27, 18 of whom underwent bronchoscopy before treatment, whereas 3 were undergoing or had completed treatment at the time of the bronchoscopy (Fig. 1a). Five patients were treated with corticosteroids without undergoing bronchoscopy (Fig. 1a,b). The median time from COVID-19 diagnosis to study enrollment was 164 d (range 37–530 d): 2 patients with RPRA ultimately required lung transplantation 78 and 99 d after COVID-19 diagnosis (Fig. 1a) and 15 (43%) exhibited arterial hypoxemia that required oxygen therapy, including the 2 patients who required lung transplantation (Table 1). Nine patients had never been hospitalized and of those hospitalized seventeen were admitted to the intensive care unit (ICU) (Fig. 1a).
Table 1.
Clinical features of the cohort
| Acute COVID course | n (35) | Frequency (%) |
|---|---|---|
| Hospitalized for COVID | 26 | 74.3 |
| ICU for COVID | 17 | 48.6 |
| Intubated for COVID | 8 | 22.9 |
| Received remdesivir | 25 | 71.4 |
| Received dexamethasone | 26 | 74.3 |
| Received tocilizumab | 5 | 14.3 |
| Comorbidities | ||
| Asthma | 3 | 8.6 |
| Chronic obstructive pulmonary disease | 0 | 0 |
| Atrial fibrillation | 4 | 11.4 |
| Diabetes mellitus | 3 | 8.6 |
| Tobacco use | 2 | 5.7 |
| Coronary artery disease | 4 | 11.4 |
| Heart failure | 5 | 14.3 |
| Chronic kidney disease | 6 | 17.1 |
| Immunosuppressiona | 14 | 40.0 |
| History of stroke | 1 | 2.9 |
| Venous thromboembolism | 2 | 5.7 |
| Symptoms | ||
| Shortness of breath | 34 | 97.1 |
| Cough | 24 | 68.6 |
| Hypoxemia | 15 | 42.9 |
aImmunosuppression was defined as receiving medications known to cause immunosuppression at the time of RPRA evaluation, such as glucocorticoids, mycophenolate, ciclosporin or tacrolimus.
Extended Data Table 1.
Demographics of patients in the cohorts
Top: Demographics of the cohorts: ptients with RPRA: BAL and scRNA-seq. Bottom: Demographics of a subgroup of patients with RPRA enrolled in the present study who underwent the following procedures: one CT scan (first CT scan); bronchoscopy with BAL; BAL fluid assessment using flow cytometry; BAL fluid assessment using scRNA-seq; BAL fluid measurement of the levels of cytokines and chemokines; nasal curettage for scRNA-seq; and a second (follow-up) CT scan. Continuous demographics are reported as median (minimum–maximum). A healthy control individual who provided a nasal curettage sample but was omitted from the analysis is not included. The demographics for the lung donor for patient RPRA13 is not included.
Fig. 1. Patients with RPRA exhibit fibrotic abnormalities on CT imaging that improve with time.
a, Schematic representation of the clinical course and selected diagnostic tests and interventions in 35 patients with RPRA beginning at the time of their diagnosis with COVID-19 (patients RPRA01–RPRA35). Timing of key events such as COVID-19 diagnosis, ICU admission, hospital discharge, intubation, extubation, tracheostomy, first and second CT scans of the chest (CT scans 1 and 2, respectively), bronchoscopy, pulmonary function testing (PFT) and steroid treatment are annotated as symbols on the day of post-COVID-19 diagnosis on which they occurred or as horizontal bars indicating their onset, duration and endpoint in the months post-COVID-19 diagnosis. b, Sankey diagram showing the flow of research or clinical procedures performed or not performed on the cohort analyzed in the present study. These include CT scans 1 and 2, bronchoscopy, BAL fluid flow cytometry (BAL FC), BAL scRNA-seq, measurement of BAL fluid cytokine and chemokine levels (BAL cytokine) and nasal curettage sampling for scRNA-seq (nasal scRNA-seq). c, Quantification of CT scan abnormalities on CT scan 1 in patients with RPRA (n = 35), using a machine learning algorithm and classified as normal lung, fibrotic abnormalities, inflammatory abnormalities, nodularity and emphysema or cysts (Extended Data Table 3). d, Changes in radiographic abnormalities between CT scan 1 and CT scan 2 in patients with RPRA who underwent CT scan 2 (n = 29). Each CT scan is represented by a single point. Scans of the same participant are connected. Adjusted P values are shown above pairs of boxplots when changes were significant (q < 0.05, paired Wilcoxon’s rank-sum tests with FDR correction).
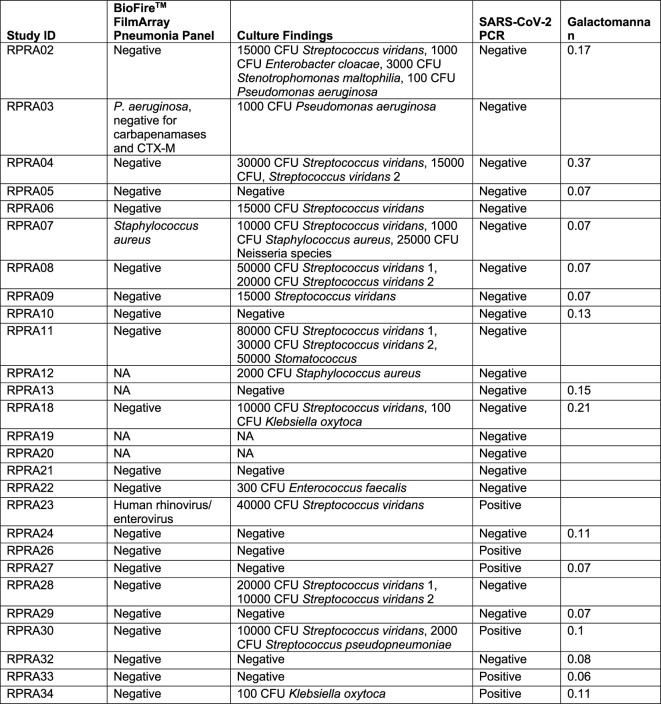
All 35 BAL samples from the RPRA cohort underwent microbiological analysis using multiplex PCR, quantitative culture and other testing as clinically indicated (Extended Data Table 2). We detected severe acute respiratory syndrome coronavirus 2 (SARS-CoV-2) in the BAL fluid of six patients with RPRA, all of whom were immunocompromised (Table 1). One of the patients who was SARS-CoV-2 positive was subsequently treated with paxlovid along with a reduction of the prednisone dosage, which resulted in complete recovery of respiratory symptoms and improvement in CT imaging of the chest, while another one died. Two patients had a respiratory bacterial pathogen identified by multiplexed PCR and confirmed by quantitative culture (Pseudomonas aeruginosa and Staphylococcus aureus) (Extended Data Table 2). One of the samples that was SARS-CoV-2 positive by PCR was also positive for human rhinovirus/enterovirus on multiplex PCR (Extended Data Table 2). Quantitative culture of BAL fluid identified respiratory pathogens not typically seen as part of the healthy oral flora (for example, Klebsiella oxytoca and Enterobacter cloacae) in six patients with RPRA, two of whom were also SARS-CoV-2 positive (Extended Data Table 2).
Extended Data Table 2.
Results of microbiological testing by the clinical lab
Two samples were not sent for microbiological testing. Streptococcus viridans 1 and 2 indicate two different strains of S. viridans.
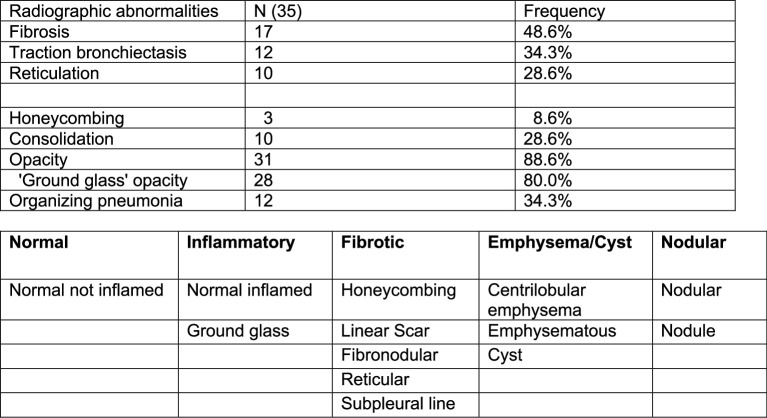
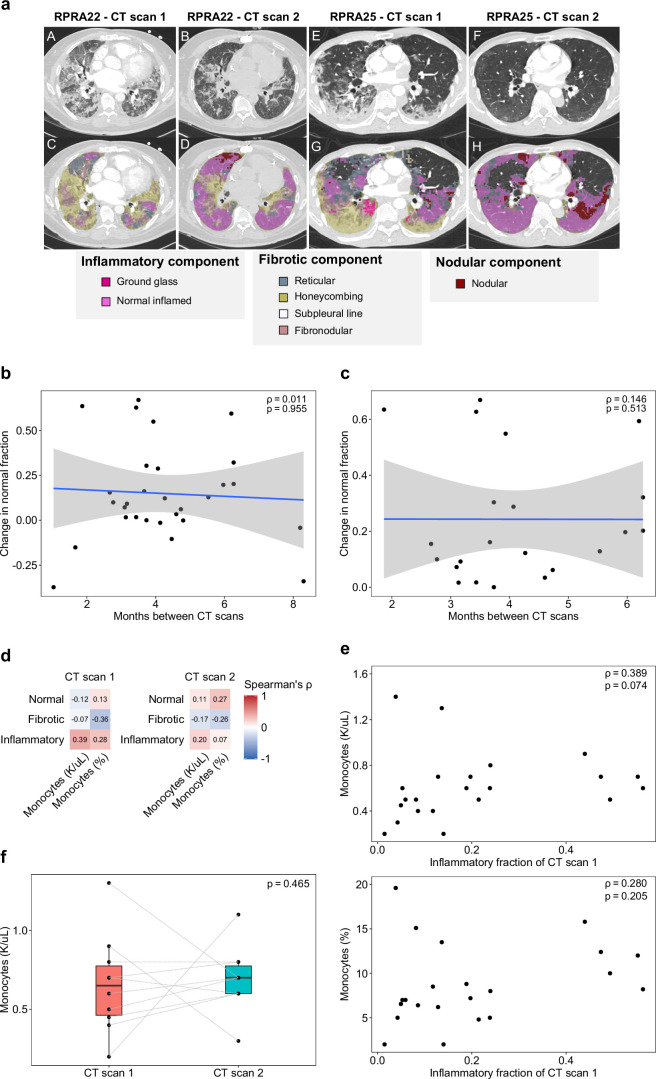
To be enrolled in the present study, patients were required to have abnormalities detected by CT scan of the chest (Extended Data Table 3). The median time from COVID-19 infection to the first CT scan for quantitative assessment was 145 d (range 20–489 d) (Supplementary Data 1). As standard clinical interpretation of CT scans is qualitative, we used a previously established machine learning algorithm14–16 to quantify the radiographic abnormalities seen on the initial CT scans (Supplementary Data 3). This procedure quantifies abnormal regions of the lung using a machine learning classifier and normalizes the abnormalities to the estimated lung volume. We grouped these abnormalities into those recognized by clinicians as areas characterized by normal lung, lung fibrosis, lung inflammation, emphysema/cysts or lung nodularity (Extended Data Fig. 1a, Extended Data Table 3 and Supplementary Data 4 and 5). Quantitative assessment of the first CT scan showed significant abnormalities, including fibrosis (38.2 ± 20.4% standard deviation), increased parenchymal attenuation compatible with inflammation (22.3 ± 20.3%) and nodularity (7.0 ± 7.5%) (Fig. 1c), with only 31.6 ± 27.6% of the lung classified as normal (Fig. 1c). Twenty-nine patients underwent a second CT scan at 118 d (range 31–249 d) after the first CT scan and 22 showed significant improvement (normal area increased to 48.1 ± 31.5%), mainly attributable to reduced fibrotic abnormalities (Fig. 1d), whereas 7 patients, including the 2 patients who required lung transplantation, worsened (Fig. 1d). There was no significant association between improvement (change in the percentage of normal lung) and the interval between the CT scans, irrespective of whether the analysis was performed on all patients with RPRA or on the subset of patients with RPRA who demonstrated improvement (Extended Data Fig. 1b,c). Increased peripheral blood monocyte count has been associated with poor outcomes in pulmonary fibrosis17. We did not find a significant association between the percentage or number of circulating monocytes, as reported by the clinical laboratory, and the severity of inflammatory or fibrotic CT abnormalities in patients with RPRA (Extended Data Fig. 1d,e). In addition, the number of circulating monocytes did not change significantly between the two scans in individual patients (Extended Data Fig. 1f). Thus, most of the patients with RPRA presented with CT findings suggestive of lung fibrosis. In most patients, lung fibrosis improved on serial CT scanning, whereas a minority showed unchanged or progressive fibrosis.
Extended Data Table 3.
Summary of radiographic features extracted from radiological reports of initial CT scans
Top: Summary of radiographic features extracted from radiological reports of initial CT scans (n = 35) of the chest. Bottom: Grouping of CT abnormalities identified via machine-learning analysis.
Extended Data Fig. 1. Improvement of abnormalities on computed tomography (CT) imaging of the chest does not correlate with time or level of circulating monocytes.
a. Representative CT scans with annotated features from the machine learning algorithm used to analyze the CT images from patients with RPRA. A,E. Cross-sections from subject RPRA22 and RPRA25 on their initial CT scan. B,F. Cross-section from the same patients on their follow-up CT scan. C,G. Colorized annotation of machine-learning classifications for RPRA22 and RPRA25 on their initial CT scan. D,H. Colorized annotation of machine-learning classifications for RPRA22 and RPRA25 on their follow-up CT scan. b. Comparison of the change in normal lung fraction with the interval between the initial and follow-up CT scans in the 29 patients with RPRA who had a second CT scan. The correlation (Spearman’s rho) is small (ρ = 0.011) and is not significant (permutation test, p = 0.955). A linear model and 95% confidence interval are shown. c. Comparison of the change in normal lung fraction with the interval between the initial and follow-up CT scans when limited to patients whose scans improved. The correlation (Spearman’s rho) remains small (ρ = 0.146) and not significant (permutation test, p = 0.513). A linear model and 95% confidence interval are shown. d. Correlation coefficients (Spearman's rho) between CT features and peripheral blood monocyte levels as reported by the clinical laboratory in the 22 patients with RPRA who had a complete blood count (CBC) performed within 14 days of the CT scan. No correlations are significant (q < 0.05, permutation tests with FDR correction). For each subject, the CBC panel closest to the CT scan date was used. e. Comparison of the inflammatory fraction of the initial CT scan with peripheral blood monocyte levels at the time of the initial CT scan in 22 patients with RPRA who had a CBC performed within 14 days of the CT scan. For each subject, the CBC panel closest to the CT scan date was used. Correlation coefficients (Spearman’s rho) and p-values (permutation test) are annotated on each plot. f. Change in absolute monocyte levels between CT scans in the 10 patients with CBC panels within 14 days of both the initial and follow-up CT scans. There is no significant change in absolute monocyte levels (paired Wilcoxon rank-sum test, p = 0.465) between scans.
Alveolar neutrophils and monocytes are increased in RPRA
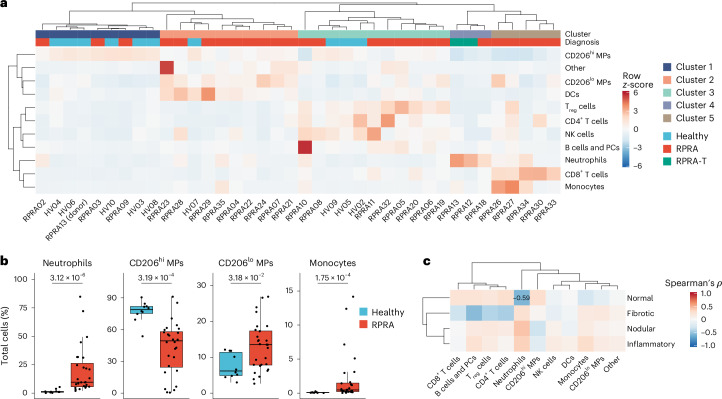
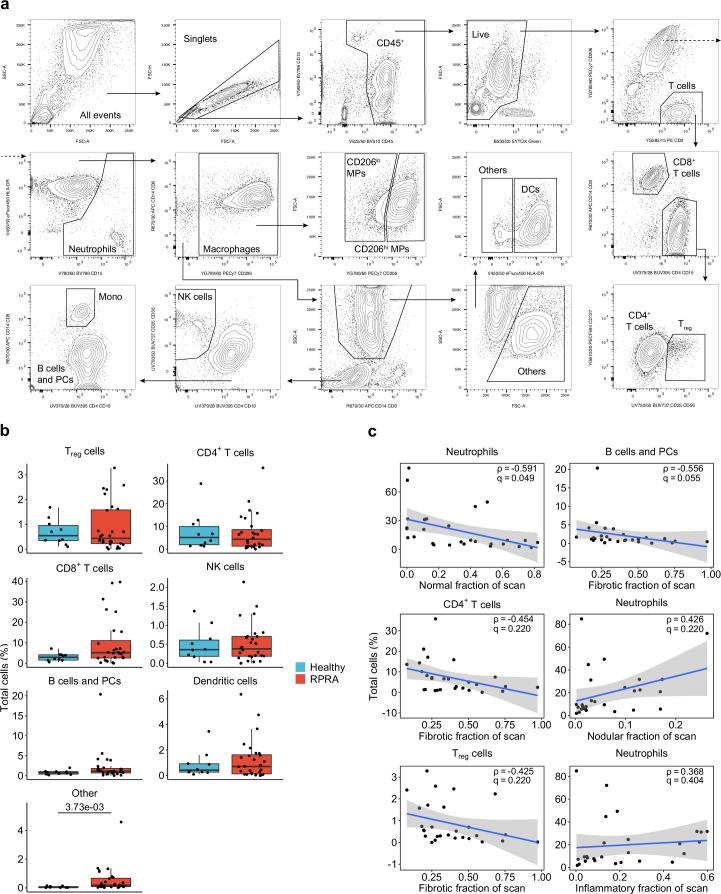
We performed flow cytometry assessment of BAL fluid samples from 28 patients with RPRA (12 (42.9%) women, median age 61 years (32–83 years)) and 9 healthy volunteers (5 (62.5%) women, median age 27.5 years (21–68 years)) (Extended Data Table 1). We resolved CD15+ neutrophils, CD4+ T cells, CD8+ T cells, CD4+CD25+ regulatory T cells (Treg cells), CD56+ natural killer (NK) cells, CD206−CD14−HLA-DR+ dendritic cells (DCs), CD14+CD206− monocytes and CD206+ macrophages (MPs) in the BAL fluid (Fig. 2a and Extended Data Fig. 2a). Based on CD206 expression, we separated alveolar macrophages into more mature CD206hi and less mature CD206lo alveolar macrophages (Extended Data Fig. 2a)2. Hierarchical clustering on cell-type abundance identified five clusters of samples (Fig. 2a and Supplementary Data 6). Cluster 1 was dominated by CD206hi alveolar macrophages and composed primarily of samples from healthy volunteers (Fig. 2a). Cluster 4 was characterized by an increased abundance of CD15+ neutrophils (Fig. 2a). The two patients who eventually underwent a lung transplantation for post-COVID-19 fibrosis were in cluster 4 (Fig. 2a). Cluster 5 was characterized by an increased number of CD14+CD206− monocytes and CD8+ T cells (Fig. 2a). All the patients in clusters 4 and 5 had RPRA (Fig. 2a). Clusters 2 and 3 predominantly comprised patients with RPRA (9 out of 10 and 8 out of 11, respectively) (Fig. 2a). Cluster 2 had an increased abundance of CD206lo alveolar macrophages, whereas cluster 3 was characterized by increased abundance of Treg cells, CD4+ T cells and CD56+ NK cells (Fig. 2a). Direct pairwise comparison showed a significant increase in the relative abundance of CD15+ neutrophils, CD14+CD206− monocytes and CD206lo alveolar macrophages, and a decrease in the relative abundance of CD206hi alveolar macrophages in patients with RPRA compared with healthy volunteers (Fig. 2b and Extended Data Fig. 2b). Evaluation of the correlation between the fraction of radiographic features extracted from the first CT scan and the abundance of immune populations in BAL fluid in patients with RPRA revealed a significant negative association between the abundance of neutrophils and the fraction of normal lung on CT scan (Fig. 2c and Extended Data Fig. 2c). These results showed that the abundance of neutrophils and monocyte-derived alveolar macrophages detected by flow cytometry in the alveolar space were associated with the severity of radiographic abnormalities on CT scans in patients with RPRA.
Fig. 2. Monocyte-derived alveolar macrophages and neutrophils are expanded in patients with RPRA compared with healthy volunteers.
a, Hierarchical clustering of flow cytometry data from BAL fluid samples from patients with RPRA (n = 26), patients with RPRA who subsequently underwent a lung transplantation (n = 2) and healthy controls (n = 10). One of the patients with RPRA who subsequently required a lung transplantation had BAL fluid obtained from each lung separately. Clustering was performed using Ward’s method. Rows are z-scored. CD206hi or CD206lo macrophage (CD206hi or CD206lo MP), plasma cells (PCs). b, Proportions of significantly differentially abundant cells measured by flow cytometry from the same BAL fluid samples as in a (q < 0.05, pairwise Wilcoxon’s rank-sum tests with FDR correction). Padj values are shown above each pair of boxplots. c, Hierarchical clustering of correlation coefficients (Spearman’s ρ) between cell-type abundances measured by flow cytometry in patients with RPRA (n = 28) and the features identified in their CT scan 1 as in Fig. 1c. Clustering was performed using Ward’s method. Correlation coefficients are shown only when the association was significant (q < 0.05, permutation tests with FDR correction).
Extended Data Fig. 2. Comparison of cell populations detected using flow cytometry analysis of BAL fluid from patients with RPRA and healthy controls.
a. Representative gating strategy for flow cytometry. Axis labels indicate laser line (UV, 355 nm; V, 405 nm; B, 488 nm; YG, 552 nm; and R, 640 nm), bandpass filter, fluorochrome and antigen/dye. AM – alveolar macrophages. DCs – dendritic cells. Cells that did not match specific markers in the flow cytometry panel were marked as ‘Other’. b. Proportions of cells in BAL fluid that were not differentially abundant (q < 0.05, pairwise Wilcoxon rank-sum tests with FDR correction) in flow cytometry data from BAL samples from 26 patients with RPRA, 2 patients with RPRA who subsequently underwent lung transplant, and 10 healthy control subjects. c. Comparison of selected cell type abundances measured using flow cytometry with abnormalities detected on the first CT scan from the 28 patients with RPRA described in Fig. 1c. Correlation coefficients (Spearman's rho) are shown along with the q value determined by permutation tests with FDR correction. Shaded areas represent 95% confidence intervals from linear models. Only the inverse association between neutrophil abundance and the proportion of normal lung met a predetermined criteria for significance of q<0.05.
MoAM-1 abundance is associated with fibrosis severity in RPRA
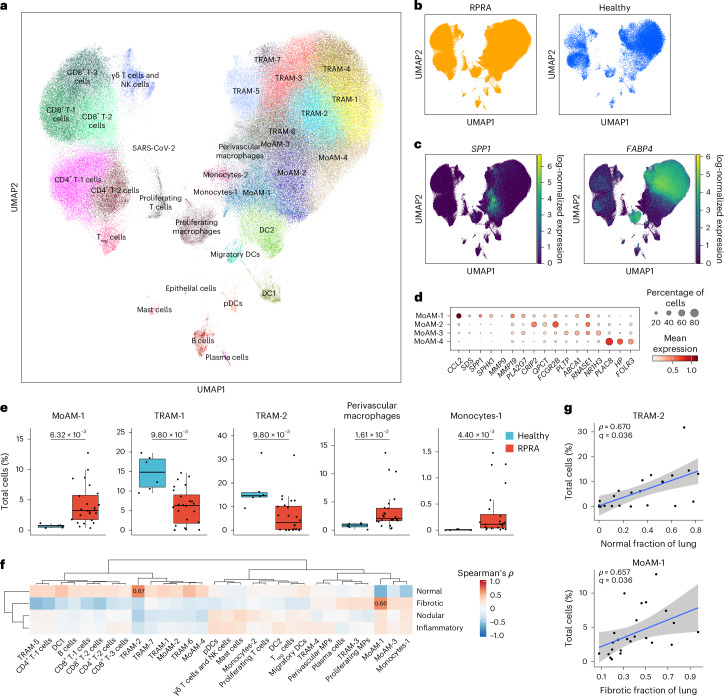
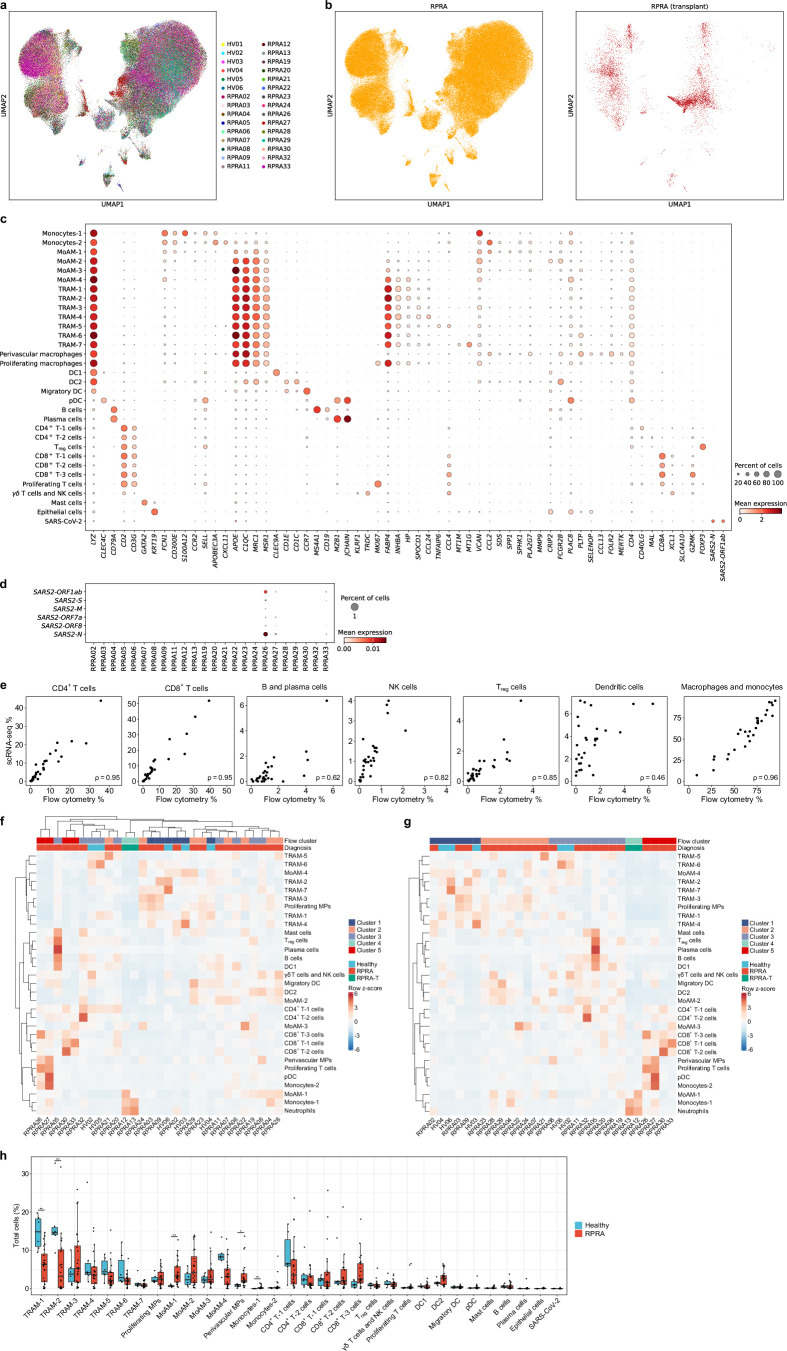
Monocyte-derived alveolar macrophages play a causal role in the development of lung fibrosis in mouse models3–5. A homologous population of transcriptionally similar alveolar macrophages has been identified in lung explants and autopsy specimens from patients with end-stage IPF and end-stage post-COVID-19 pulmonary fibrosis18,19. To determine whether monocyte-derived alveolar macrophages were present in the BAL fluid from patients with RPRA and whether their abundance was associated with disease severity, we performed scRNA-seq on sorted CD45+CD15− mononuclear immune cells from BAL fluid from 24 patients with RPRA, including the 2 patients who received a lung transplant and 6 healthy volunteers (Extended Data Table 1). Integrative analysis resolved all cell types previously reported in BAL fluid, including macrophages, subsets of DCs, subsets of T cells, mast cells, B cells and plasma cells, as well as a cluster of SARS-CoV-2 particles (Fig. 3a,b, Extended Data Fig. 3a–c and Supplementary Data 7; interactive object at https://www.nupulmonary.org/). SARS-CoV-2 particles were detected in three of the six patients with a positive nasal PCR test for SARS-CoV-2 at the time of the bronchoscopy, including the patient who improved with paxlovid (Extended Data Fig. 3d). After adjustment for the proportion of neutrophils, cell-type abundance determined by flow cytometry and scRNA-seq correlated well with each other (Extended Data Fig. 3e). Within macrophages (C1QA, MRC1 and MSR1), we resolved seven clusters of mature alveolar macrophages (tissue-resident alveolar macrophages (TRAM-1 to TRAM-7)) and four clusters of less mature alveolar macrophages (monocyte-derived alveolar macrophages (MoAM-1 to MoAM-4); Fig. 3c and Extended Data Fig. 3c). Tissue-resident alveolar macrophages were characterized by expression of FABP4, INHBA and NUPR1 and monocyte-derived alveolar macrophages by expression of VCAN and CCL2 and lack of FABP4 (Fig. 3c and Extended Data Fig. 3c)20. Although these samples were collected from the alveolar space through BAL, we detected a cluster of macrophages (SELENOP, CCL13 and FOLR2) that matched the gene expression profiles of perivascular macrophages (Extended Data Fig. 3c). We resolved two subsets of monocytes (monocytes-1 and monocytes-2) characterized by expression of CD300E, CCL2, FCN1 and VCAN or APOBEC3A, IFITM3 and CXCL11, respectively (Fig. 3d). The MoAM-1 clusters were the least mature and shared some genes with monocytes, including FCN1, VCAN and CCL2, and expressed lower levels of stereotypical macrophage marker genes, such as MRC1, MSR1 and C1QA (Fig. 3c,d and Extended Data Fig. 3c). Importantly, in comparison to other alveolar macrophage subsets, MoAM-1 clusters had higher expression of genes expressed in profibrotic alveolar macrophages identified in patients with pulmonary fibrosis18,21–24 (Fig. 3d). Some of these genes, such as SPP1, SPHK1, PLA2G7 and MMP19 (Fig. 3c,d and Extended Data Fig. 3c), were causally implicated in the pathogenesis of pulmonary fibrosis in mouse and in vitro models4. Clusters MoAM-2, MoAM-3 and MoAM-4 were characterized by progressively increased expression of genes associated with alveolar macrophage maturation, such as APOE, C1QC, MSR1 and MRC1, and adaptation to the alveolar niche, such as FABP4, INHBA and NUPR1 (Fig. 3d and Extended Data Fig. 3c). Clusters TRAM-1 and TRAM-2 contained ‘stereotypical’ tissue-resident alveolar macrophages, lacking cytokine and chemokine expression, whereas clusters TRAM-3 to TRAM-7 were characterized by previously described20 gene expression programs related to cytokine and chemokine signaling (TRAM-3 to TRAM-6) or expression of metallothionein genes (TRAM-7) (Extended Data Fig. 3c).
Fig. 3. Ongoing recruitment of profibrotic monocyte-derived alveolar macrophages is associated with fibrotic abnormalities on CT scans.
a, Uniform manifold approximation and projection (UMAP) plot showing integrated analysis of BAL immune cells from patients with RPRA (n = 24) and healthy volunteers (n = 6). Tissue-resident alveolar macrophages (TRAM), monocyte-derived alveolar macrophages (MoAM), type I conventional DCs (DC1), type II conventional DCs (DC2), migratory dendritic cells (migratory DC) and plasmacytoid dendritic cells (pDC). b, UMAP as in a with cells originating from patients with RPRA or healthy controls. c, Expression of SPP1 and FABP4 on the UMAP plot in a. d, Dot plot showing the expression of marker genes for subsets of monocyte-derived alveolar macrophages in the UMAP plot in a. e, Proportions of significantly differentially abundant cell clusters represented in the UMAP in a (q < 0.05, pairwise Wilcoxon’s rank-sum tests with FDR correction). Padj values are shown above each pair of boxplots. f, Hierarchical clustering on correlation coefficients (Spearman’s ρ) between cell-type abundances determined using scRNA-seq in the patients with RPRA (n = 24) as in a and features identified in CT scan 1 as in Fig. 1c. Correlation coefficients are shown only when the association was significant (q < 0.05, permutation tests with FDR correction). Clustering was performed using Ward’s method. g, Comparison between abundance of TRAM-2 and MoAM-1 cell subsets and the fraction of normal and fibrotic lung, respectively, in patients with RPRA (n = 24) as identified by CT scan 1 in Fig. 1c. Only significant associations are shown, with the correlations (Spearman’s ρ) and Padj values or FDR-adjusted q values shown on each plot. Linear models and 95% confidence intervals (CIs) are shown.
Extended Data Fig. 3. Ongoing recruitment of profibrotic monocyte-derived alveolar macrophages in patients with RPRA.
a–b. UMAP plot showing integrated analysis of BAL immune cells from 24 patients with RPRA and 6 healthy control subjects, split by subject (a), and future requirement for transplant status (b). c. Dot plot showing expression of the genes used as markers to identify cell types in the integrated single-cell RNA-seq object from Fig. 3a. d. Dot plot showing expression of SARS-CoV-2 genes in BAL fluid from each of the 24 patients with RPRA. e. Comparison between cell type abundances determined by flow cytometry and single-cell RNA-seq. Correlation coefficients (Spearman’s rho) are annotated on each plot. f–g. Hierarchical clustering of cell type abundances from BAL samples of 24 patients with RPRA and 6 healthy controls. Neutrophil abundances determined from flow cytometry are included in the analysis (see Methods). Patients are hierarchically clustered (f) or grouped according to the ‘flow cluster’ derived from flow cytometry data in Fig. 2a. (g). Column headers are color-coded by the diagnosis and association with the ‘flow cluster’ derived from flow cytometry data in Fig. 2a. Samples from the two patients with RPRA who subsequently required transplant are coded separately (RPRA-T). Clustering was performed using Ward’s method. Rows are z-scored. h. Proportions of each cell type detected in BAL fluid between 24 patients with RPRA (including patients who required lung transplant) and 6 healthy controls. Significance was assessed using pairwise Wilcoxon rank-sum tests with an FDR correction (* q < 0.05, ** q < 0.01, *** q < 0.001).
In patients with RPRA compared with healthy controls, the relative abundance of monocytes-1, MoAM-1 subsets and perivascular macrophages was significantly increased, whereas the abundance of TRAM-1 and TRAM-2 was significantly decreased (Fig. 3e, Extended Data Fig. 3f,g and Supplementary Data 8). The abundance of the profibrotic MoAM-1 cluster negatively correlated with the area of normal lung and positively correlated with fibrotic lung abnormalities on the first CT scan (Fig. 3f,g), whereas the abundance of TRAM-2 positively correlated with the area of the normal lung (Fig. 3f,g). Thus, the abundance of monocyte-derived alveolar macrophages detected by scRNA-seq was positively associated with the severity of CT scan-assessed fibrosis in patients with RPRA, whereas the abundance of mature tissue-resident alveolar macrophages was associated with the fraction of normal lung in CT scans.
Macrophage gene programs associate with fibrosis in RPRA
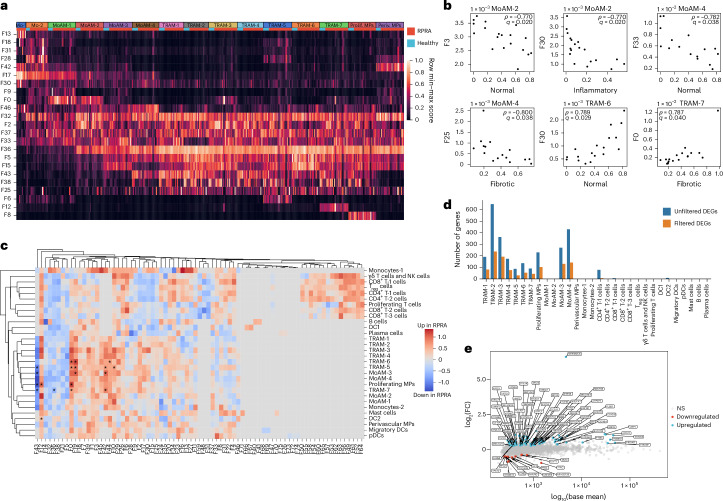
To detect the presence of gene programs within our single-cell dataset independent of cell clustering and annotation, we performed factor analysis using the Spectra method25. Spectra decomposes the entire scRNA-seq count matrix into a set of interpretable gene programs and uses a curated list of factors as input to both modify them and build new factors to help explain the observed variation in gene expression. We provided Spectra with 68 factors related to cellular identity and cellular processes in both generic immune cells and specific cell populations and allowed the discovery of one new factor for each broad cell population for a total of 77 factors (Fig. 4a, Extended Data Fig. 4a and Supplementary Data 9–11). Five of the gene programs identified by Spectra (F0, F3, F5, F30 and F33) were significantly associated with the degree and type of radiographic abnormalities in patients with RPRA (Fig. 4b). Expression of Spectra program F3 in MoAM-2, comprising genes involved in immune response, antiviral defense, complement regulation, lysosomal activity and degradation, and Spectra program F33 in MoAM-4, comprising genes involved in mitochondrial function, transcriptional regulation, chromatin remodeling and signal transduction, negatively correlated with the amount of normal lung tissue on the first CT scan (Fig. 4b). Program F25 comprised genes involved in normal alveolar macrophage function, including antiviral defense, complement regulation and lysosomal activity and protein degradation. Expression of program F25 in the most mature subset of MoAMs (MoAM-4), negatively correlated with the fraction of fibrotic abnormalities on the first CT scan (Fig. 4b). Program F30 comprised genes implicated in normal macrophage function, including pathogen clearance, metabolic regulation and complement regulation. Expression of program F30 in TRAM-6 positively correlated with the fraction of normal lung on the first CT scan, whereas the same program in MoAM-2 negatively correlated with inflammatory abnormalities (Fig. 4b). Last, program F0 comprised genes involved in tissue fibrosis and extracellular matrix remodeling. Expression of program F0 in TRAM-7 positively correlated with the abundance of fibrotic abnormalities on the first CT scan (Fig. 4b). These findings suggested that both the abundance and the gene expression profiles of alveolar macrophages were associated with the severity of inflammatory and fibrotic abnormalities in patients with RPRA.
Fig. 4. Gene programs associated with pulmonary fibrosis in monocyte-derived alveolar macrophages are associated with radiographic abnormalities in patients with RPRA.
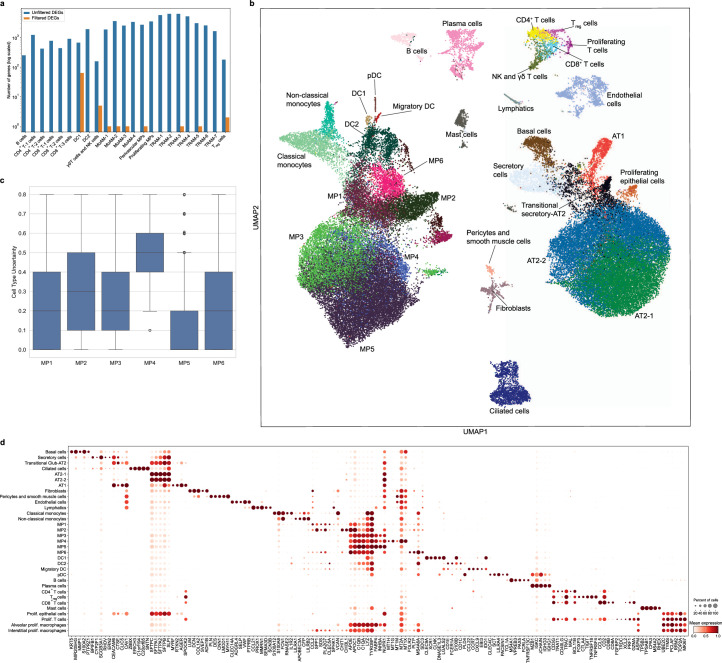
a, Heatmap of scores for selected Spectra programs within monocyte (Mo-1 and Mo-2) and macrophage clusters (MoAM-1 to MoAM-4; TRAM-1 to TRAM-7; proliferating MPs (prolif. MPs) and perivascular MPs (periv. MPs)) identified in BAL fluid scRNA-seq data from patients with RPRA (n = 24) and healthy controls (n = 6) as in Fig. 3a. Each column represents a single subject. Rows are scaled minmum to maximum (min–max). b, Correlations (Spearman’s ρ) between Spectra participant scores and CT features in MoAM-2 and MoAM-4 and TRAM-6 and TRAM-7, as in Fig. 3a. Only significant associations are shown (q < 0.05, permutation tests with FDR correction). Padj values and correlation coefficients are annotated on each plot. c, Hierarchical clustering on the signal/noise ratio of Spectra participant scores between patients with RPRA (n = 24) and healthy controls (n = 6). Factors that are differentially expressed (q < 0.05, Wilcoxon’s rank-sum test on subject scores with FDR correction) are indicated with an asterisk. d, Barplot showing the number of DEGs between different cell types in the BAL fluid in patients with RPRA (n = 24) and healthy controls (n = 6) (q < 0.05, Wald’s test with FDR correction) with and without filtering criteria applied for DEGs. e, DEGs in TRAM-1 cluster. FC, fold-change; NS, not significant (q > 0.05).
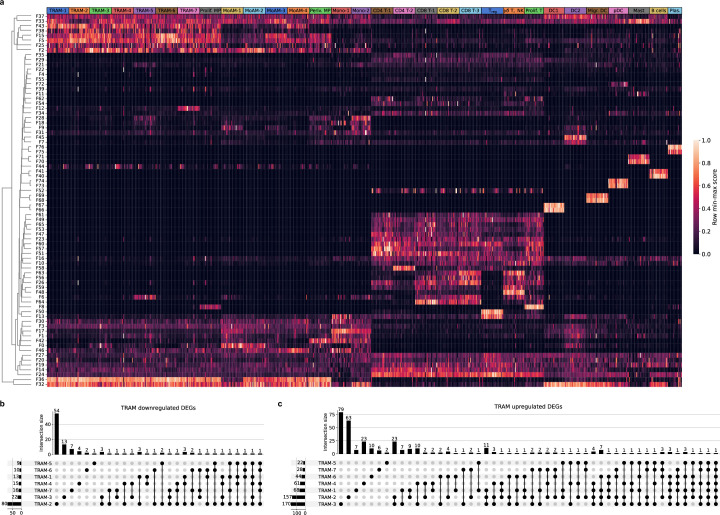
Extended Data Fig. 4. Gene programs associated with pulmonary fibrosis in monocyte-derived alveolar macrophages are associated with severity of radiographic abnormalities in patients with RPRA.
a. Heatmap of subject scores for Spectra programs within each cell type for each of 24 patients with RPRA and 6 healthy control subjects. Each column represents a single patient or subject. Rows are min-max scaled and are hierarchically clustered. Labels refer to clusters identified from the single-cell RNA-seq object in Fig. 3a. Tissue-resident alveolar macrophages (TRAM) clusters 1-7, proliferating macrophages (Prolif. MP), monocyte-derived alveolar macrophages (MoAM) clusters 1-4, perivascular macrophages (Periv. MP), monocytes (Mo) cluster 1-2, CD4 T cells (CD4 T) clusters 1,2, CD8 T cells (CD8 T) clusters 1-3, regulatory T cells (Treg), gd T cells and NK cells (gd T, NK), proliferating T cells (Prolif. T), type I conventional dendritic cells (DC1), type II conventional dendritic cells (DC2), migratory dendritic cells (Migr. DC), plasmacytoid dendritic cells (pDC), Mast cells (Mast), plasma cells (Plas.). b. Upset plot showing downregulated differentially expressed genes (DEGs) shared between TRAM subsets. c. Upset plot showing upregulated DEGs shared between TRAM subsets.
We next queried Spectra for programs that differed between patients with RPRA and healthy volunteers (Fig. 4c). Program F43, which included genes related to homeostatic alveolar macrophage functions (FABP4, SERPING1, APOE and MARCO), was downregulated in MoAM-3, TRAM-5, TRAM-7 and proliferating macrophages from patients with RPRA compared with healthy controls (Fig. 4c). Three partially overlapping programs, F0, F19 and F42, comprising genes involved in tissue-resident alveolar macrophage activation, including immune responses, cell adhesion and cytoskeletal organization, extracellular matrix organization and fibrosis, protease activity, RNA regulation, DNA and chromatin regulation and iron metabolism, were upregulated in TRAM-6 from patients with RPRA compared with healthy controls (Fig. 4c and Supplementary Data 11).
Traditional differential gene expression analysis found very few differentially expressed genes (DEGs) shared across TRAM clusters (Fig. 4d, Extended Data Fig. 4b,c and Supplementary Data 12). In TRAM clusters from patients with RPRA, 44 genes were upregulated compared with healthy volunteers and included genes encoding components of the mitochondrial electron transport chain (NDUFA7, NDUFB7, UQCRB, NDUFC1, NDUFB4, NDUFS6, COX7C, COX6A1, COX6B1, COX5B and COX8A) or mitochondria organization (MICOS13), alarmins (S100A6 and S100A11) and response to interferon (IFNGR2 and IFI27L2) (Fig. 4e). The 12 genes that had lower expression in TRAM clusters from patients with RPRA compared with healthy volunteers included homeostatic genes, for example, CSF2RB, which encodes a subunit of the CSF2 receptor that is required for alveolar macrophage differentiation and survival, the transferrin receptor (TFRC), genes involved in lipid and glucose metabolism (ESYT1, PYGL and HK2) and genes involved in DNA repair and modification (PARP10 and RFC2) (Fig. 4e). These data suggested that monocyte-derived alveolar macrophages expressed gene programs that were associated with the severity of CT scan-detected fibrosis in patients with RPRA and included genes causally implicated in fibrosis in mouse models.
Macrophage programs are similar in resolving and nonresolving RPRA
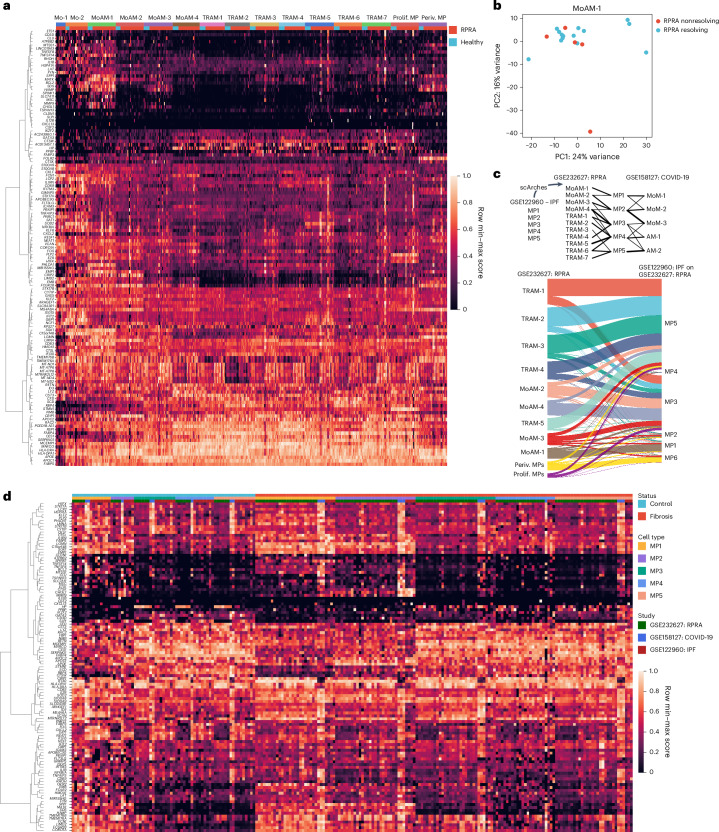
We compared gene programs identified by Spectra that were enriched in profibrotic MoAM-1 and absent in TRAM-1 to TRAM-7 (F0 and F9), or programs enriched in TRAM-1 to TRAM-7 and absent in profibrotic MoAM-1 (F5 and F43) (Fig. 4a and Supplementary Data 13). Combined, these programs included 178 genes (Fig. 5a). Programs F0 and F9 included many genes causally linked to fibrosis in mouse models (SPP1, CHI3L1 and MMP9), genes related to mitochondrial respiratory chain function (C15orf48), antioxidant activity (SOD2), iron metabolism and homeostasis (HAMP), immune response and inflammation (IL1RN, FCN1, CD83 and LYZ), lipid metabolism and transport (APOE, APOC1, APOC2 and FABP5), amino acid metabolism (SDS), extracellular matrix remodeling and degradation (CTSL, VCAN and LGMN), cell adhesion and cytoskeletal organization (EZR and EMP1) and cell signaling and migration (FCGR2B, SGK1, PHLDA1, IFITM3, IFI30 and MS4A6A) (Fig. 5a). Programs F5 and F43 expressed in TRAM subsets, but not in MoAM subsets, included genes associated with the homeostatic function of alveolar macrophages (FABP4, SERPING1, APOE and MARCO) (Fig. 5a).
Fig. 5. Monocyte-derived alveolar macrophages show similar transcriptomic signatures in patients with resolving or nonresolving RPRA.
a, Expression of genes from Spectra programs F0, F5, F9 and F43 within monocyte (Mo-1 and Mo-2) and macrophage clusters (MoAM-1 to MoAM-4, TRAM-1 to TRAM-7, prolif. MPs and periv. MPs) identified from BAL fluid scRNA-seq data of patients with RPRA (n = 24) and healthy controls (n = 6) as in Fig. 3a. Each column represents a single subject. Genes with weights >0.0002 were retained. Rows are scaled minimum to maximum and hierarchically clustered. b, Principal component analysis (PCA) of pseudobulk gene expression in cluster MoAM-1 from patients with resolving (n = 15) and those with nonresolving (n = 5) RPRA as defined by serial CT scans of the chest. c, Top, schematic of transfer learning approach to harmonize macrophage labels across three datasets in which the scArches model was trained on scRNA-seq data from patients with IPF and lung transplant donors (GEO accession no. GSE122960) and labels projected on to data from the present study (accession no. GSE232627) and data from patients with end-stage pulmonary fibrosis secondary to COVID-19 and two controls (accession no. GSE158127). Bottom, Sankey diagram illustrating mapping of macrophage cluster labels identified in the patients with RPRA in the present study (accession no. GSE232627; n = 24) and labels transferred from patients with IPF (n = 4) and donor lungs (controls, n = 8) (accession no. GSE122960). d, Combined heatmap showing expression of genes from Spectra programs F0, F5, F9 and F43 in alveolar macrophages from patients with RPRA in the present study (accession no. GSE232627; n = 24), patients with IPF (n = 4) and donor lungs (controls, n = 8) (accession no. GSE122960), and patients with end-stage pulmonary fibrosis secondary to COVID-19 (n = 3) and donor lungs (controls, n = 2) (accession no. GSE158127). Columns are organized by disease status, macrophage subsets (MP1 to MP6) and dataset (RPRA, IPF and COVID-19-induced lung fibrosis). Genes with weights >0.0002 were retained. Rows are scaled minmum to maximum and are hierarchically clustered.
If monocyte-derived alveolar macrophages assume a reparative phenotype during the resolution of fibrosis, it should be reflected by a downregulation of fibrotic genes and upregulation of genes involved in repair. Accordingly, we performed differential gene expression analysis across the 5 patients with nonresolving RPRA, defined as those patients in whom the fraction of normal lung did not increase between the first and second CT scans, and the 15 patients with resolving RPRA, defined as those in whom the fraction of normal lung increased between the first and second CT scans (Extended Data Fig. 5a). The two patients who underwent lung transplantations did not undergo a second scan and were therefore excluded from this analysis. We found that MoAM-1 from patients with resolving RPRA and nonresolving RPRA clustered together on a principal component analysis (PCA) plot (Fig. 5b). Direct pairwise comparison revealed only one gene (HLA-DQA2) that was differentially expressed between profibrotic MoAM-1 from patients with resolving RPRA compared with those with nonresolving RPRA (Supplementary Data 14). To further explore the lack of DEGs in MoAM subsets between patients with resolving and pastients with nonresolving RPRA, we compared Spectra programs associated with MoAM-1 and TRAM-1 to TRAM-7 (F0, F9, F5 and F43) between patients with resolving and patients with nonresolving RPRA, but did not find differentially expressed programs (Supplementary Data 15). Together, these findings argued against the expression of unique gene programs that could distinguish monocyte-derived or tissue-resident alveolar macrophages in resolving compared with progressive fibrosis.
Extended Data Fig. 5. Monocyte-derived alveolar macrophages show similar transcriptomic signatures in resolving or non-resolving RPRA.
a. Bar plot showing the number of differentially expressed genes in different cell types between the 15 patients with resolving RPRA compared with the 5 patients with non-resolving RPRA as determined by serial CT imaging (q < 0.05, Wald test with FDR correction with and without filtering criteria). Tissue-resident alveolar macrophages (TRAM) clusters 1-7, proliferating macrophages (Prolif. MP), monocyte-derived alveolar macrophages (MoAM) clusters 1-4, perivascular macrophages (Periv. MP), monocytes (Mo) cluster 1-2, CD4 T cells (CD4 T) clusters 1,2, CD8 T cells (CD8 T) clusters 1-3, regulatory T cells (Treg), γδ T cells and NK cells (γδ T, NK), proliferating T cells (Prolif. T), type I conventional dendritic cells (DC1), type II conventional dendritic cells (DC2), migratory dendritic cells (Migr. DC), plasmacytoid dendritic cells (pDC), Mast cells (Mast), plasma cells (Plas.). b. UMAP plot showing cell type clusters resolved in the single-cell RNA-seq dataset from patients with idiopathic pulmonary fibrosis (IPF) and lung donors (GSE122960). c. Label transfer uncertainty scores between macrophage clusters from IPF dataset (GSE122960) and current dataset (GSE232627). d. Dot plot of top 5 marker genes per cluster in the integrated object from Extended Data Fig. 5b.
To extend our comparison of alveolar macrophages in patients with RPRA to alveolar macrophages from patients with nonresolving lung fibrosis who required lung transplantation, we used transfer learning to map alveolar macrophage subsets from published scRNA-seq dataset from patients with IPF18 on to alveolar macrophages from patients with RPRA and patients with lung fibrosis secondary to COVID-19 (ref. 19) (Fig. 5c, Extended Data Fig. 5b–d and Supplementary Data 16). This analysis resolved six subsets of macrophages (MP1 to MP6) (Extended Data Fig. 5b–d). MP1 represented a subset of profibrotic MoAMs characterized by the expression of CCL2, VCAN, SPP1, IL1RN and SPHK1 (Extended Data Fig. 5b–d). Subset MP2 included monocyte-derived alveolar macrophages characterized by expression of SPP1, CHI3L1, CHIT1 and PLA2G7 with little or no expression of CCL2 and VCAN (Extended Data Fig. 5b–d). Subsets MP3–MP5 were tissue-resident alveolar macrophages characterized by the expression of FABP4, NUPR1 and INHBA (Extended Data Fig. 5b–d). The MP6 subset matched perivascular macrophages (MRC1+FAPB4−FOLR2+; Extended Data Fig. 5b–d). The MP1 subset had the lowest label transfer uncertainty scores with MoAM-1 in the RPRA cohort (Extended Data Fig. 5c). Analysis of the expression of the genes obtained from Spectra programs associated with monocyte-derived and tissue-resident alveolar macrophages (Fig. 5a) indicated similar patterns of gene expression in MoAM and TRAM subsets across all three datasets (Fig. 5d). These data suggest that, on recruitment, monocyte-derived alveolar macrophages activated a stereotypical transcriptional program associated with fibrosis that resolved as they differentiated into mature, homeostatic tissue-resident alveolar macrophages, as reported in mouse models of fibrosis26.
Alveolar CCL2 associates with fibrosis severity in RPRA
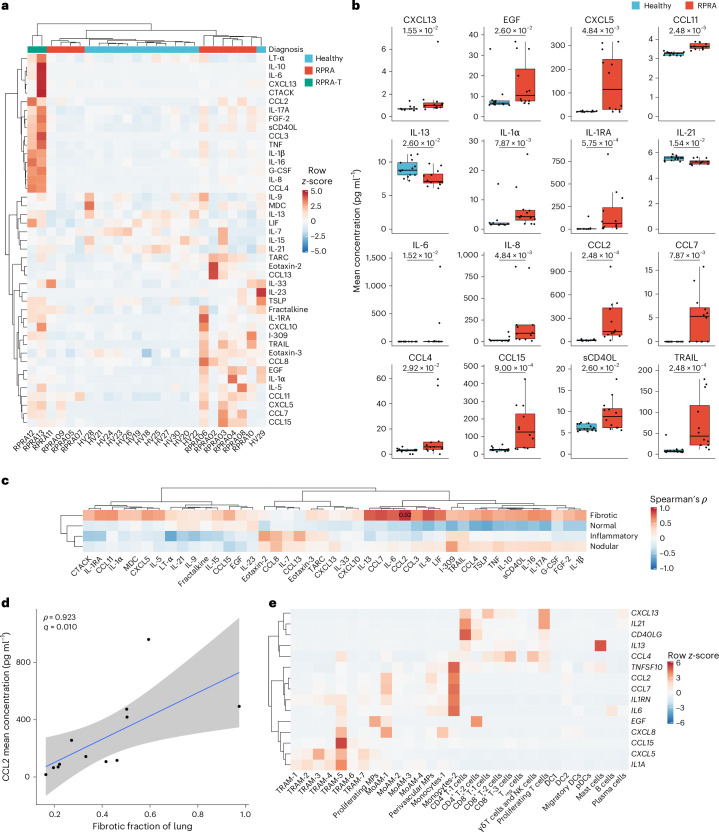
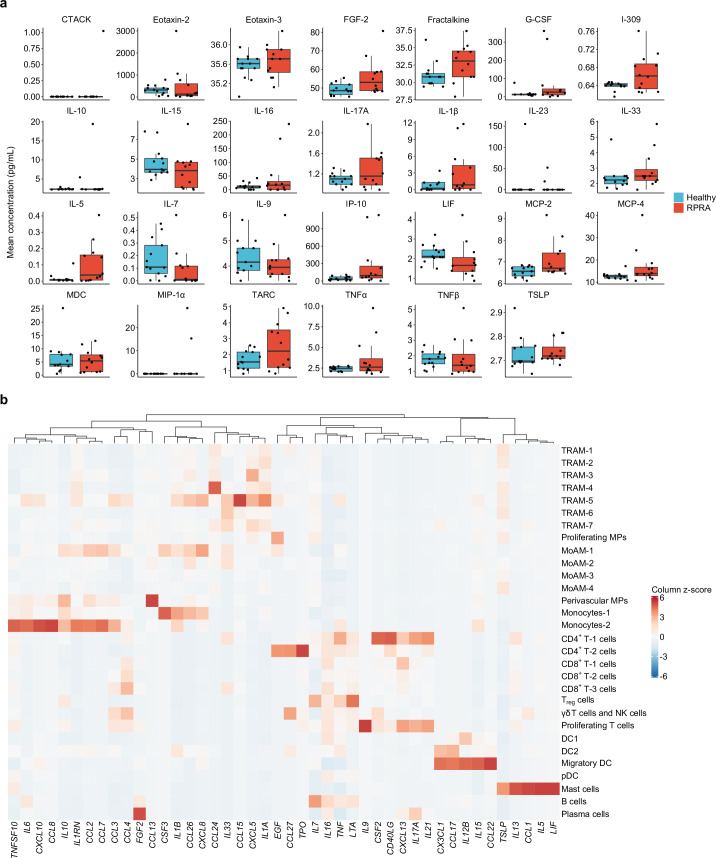
We next used a multiplex bead array to measure the expression of 71 cytokines and chemokines in the BAL fluid from 12 patients with RPRA and 13 healthy controls, of whom 43 were detected and included in subsequent analyses. In patients with RPRA compared with healthy controls, 14 cytokines or chemokines were increased, including: the monocyte and T cell chemoattractants CCL2, CCL7, CCL4 and CCL15 and the inflammatory cytokines interleukin (IL)-1ɑ, IL1-receptor antagonist, IL-6 and IL-8; CXCL13, involved in B lymphocyte recruitment; epidermal growth factor, which promotes epithelial repair; CXCL5 (neutrophil recruitment during repair); CCL11 (eosinophil recruitment); soluble CD40 ligand (sCD40L), which has broad effects on the activation of many immune cells; and the apoptosis ligand TRAIL (Fig. 6a,b). Two cytokines were significantly lower in the BAL fluid from patients with RPRA compared with healthy controls (IL-13, involved in type 2 inflammation, and IL-21, involved in monocyte differentiation and T and NK cell activation) (Fig. 6a,b, Extended Data Fig. 6a and Supplementary Data 17). These data suggested that the levels of monocyte, T cell and neutrophil chemoattractants were increased in patients with RPRA.
Fig. 6. Cytokines in the BAL fluid in patients with RPRA are produced by monocytes and neutrophils.
a, Hierarchical clustering of 43 (of 71 tested) cytokines detected in the BAL fluid in patients with RPRA (n = 10), patients with severe RPRA requiring lung transplantation (RPRA-T, n = 2) and healthy controls (n = 13). Clustering was performed using Ward’s method. The rows are z-scored. EGF, epidermal growth factor; G-CSF, granulocyte–colony-stimulating factor; LIF, leukemia inhibitory factor; LT-α, lymphotoxin-α; MDC, macrophage-derived cytokine; TARC, thymus and activation-regulated chemokine; TNF, tumor necrosis factor; TSLP, thymic stromal lymphopoietin. b, Expression of 16 cytokines or chemokines that had significantly different expression (q < 0.05, pairwise Wilcoxon’s rank-sum tests with FDR correction) between patients with RPRA (including the two patients who required lung transplantation) and healthy controls. Padj values are shown above each pair of boxplots. c, Hierarchical clustering on correlation coefficients (Spearman’s ρ) between levels of inflammatory cytokines in BAL fluid from patients with RPRA (including the two patients who required lung transplantation; n = 12) and radiographic features from CT scan 1. Clustering was performed using Ward’s method. Correlation coefficients are shown only when the association was significant (q < 0.05, permutation tests with FDR correction). d, Scatter plot of expression of CCL2 and the fibrotic fraction on CT scan 1 in patients with RPRA (n = 12). A linear model and 95% CI are shown. e, Hierarchical clustering of the mean expression levels in patients with RPRA (n = 24) of genes encoding cytokines that differed significantly between patients with RPRA (n = 12) and healthy controls (n = 13). Labels refer to the cell-type clusters identified from scRNA-seq data of 24 patients with RPRA described in Fig. 3a. CCL11 is not shown because it was not expressed in cells sampled via the BAL procedure. Clustering was performed using Ward’s method. The rows are z-scored.
Extended Data Fig. 6. BAL fluid cytokines implicate monocyte and neutrophil cytokines and chemokines in RPRA.
a. Levels of the 43 (of 71 tested) cytokines detected in the BAL fluid from 12 patients with RPRA including 2 patients with severe RPRA requiring lung transplantation (RPRA), and 13 healthy control subjects (Healthy). The levels of cytokines and chemokines that did not differ significantly (q < 0.05, pairwise Wilcoxon rank-sum tests with FDR correction) between patients with RPRA and healthy controls are shown. b. Hierarchical clustering of mean expression levels from BAL single-cell RNA-seq data of genes encoding each cytokine or chemokine measured. CCL11 (eotaxin-1), IL20 (IL-20), and CCL21 are not shown as these genes were not expressed in the single-cell RNA-seq data described in Fig. 3a. Clustering was performed using Ward’s method. Columns are z-scored.
We then compared the expression of inflammatory cytokines with the severity of CT abnormalities in patients with RPRA. Although the expression of many of the cytokines positively correlated with the severity of fibrosis measured on the first CT (Fig. 6c), this correlation was only significant for CCL2, which is central to the recruitment of monocytes (Fig. 6c,d). Many of the inflammatory cytokines elevated in the BAL fluid from patients with RPRA were expressed in immune cells sampled by the BAL procedure (Fig. 6e and Extended Data Fig. 6b). As such, CCL2 was expressed by monocytes-2, perivascular macrophages and MoAM-1 (Fig. 6e), the neutrophil chemoattractant CXCL8 was expressed by monocytes-1, MoAM-1 and TRAM-5 (Fig. 6e) and the expression of CXCL13, IL21 and CD40LG was largely limited to T cells (Fig. 6e; of note, because the BAL procedure did not sample epithelial, endothelial or stromal cells, we cannot exclude that these cells were also a source of cytokines). Thus, BAL fluid inflammatory cells could represent a potential source of alveolar space inflammatory cytokines, including CCL2, and the levels in the alveolar fluid associated with the severity of radiographically detected fibrosis in patients with RPRA.
RPRA is not associated with an altered nasal transcriptome
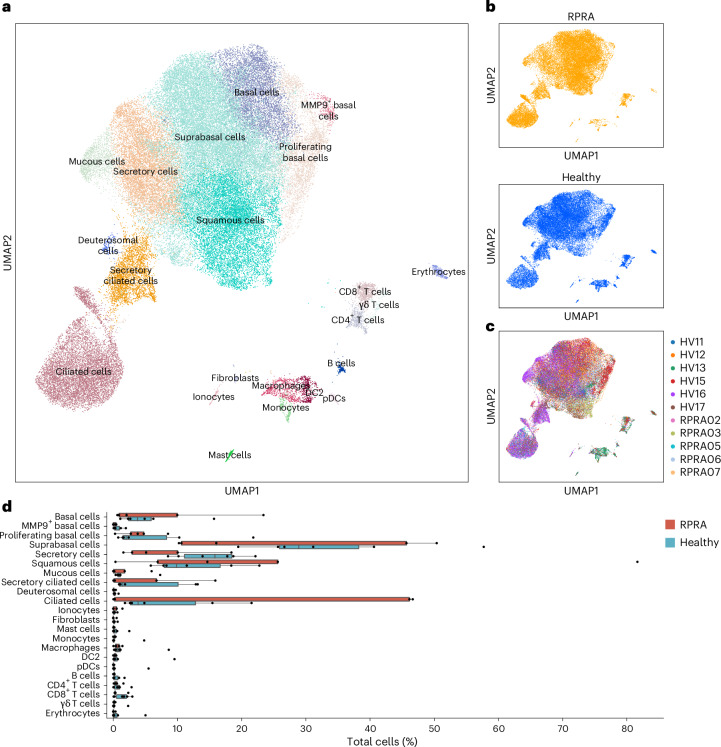
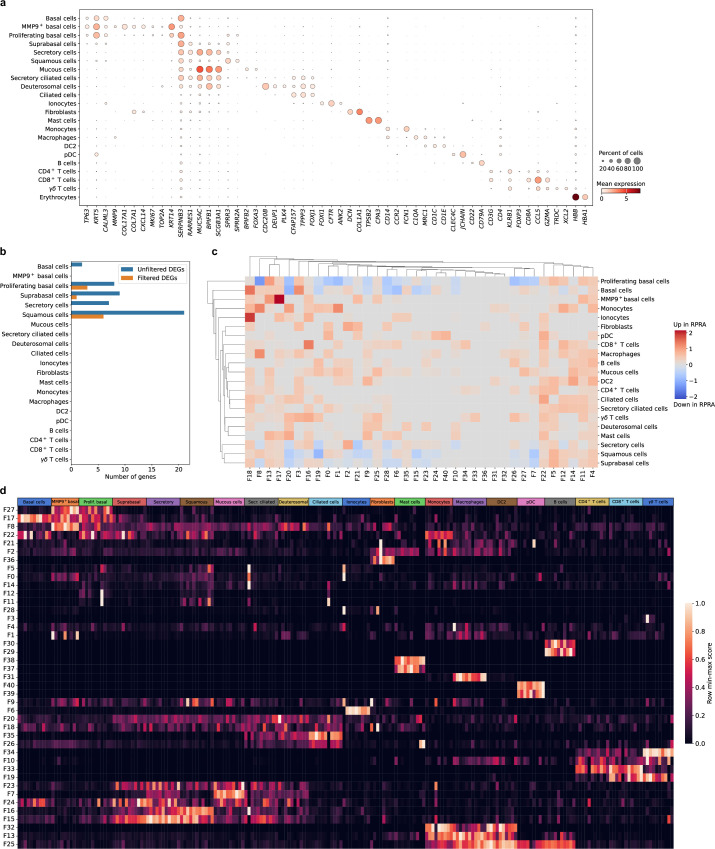
Transcriptomic changes in airway epithelium can reflect disease-associated processes in the distal lung parenchyma27–30. Therefore, we obtained nasal curettage samples from five patients with RPRA at the time of bronchoscopy and six healthy volunteers (Extended Data Table 1), which were processed and analyzed using scRNA-seq. This analysis resolved several expected epithelial cell populations (KRT5+ basal cells, SERPINB3+ suprabasal cells, MUC5AC+ secretory cells, SPRR3+ squamous cells, FOXJ1+ ciliated cells and others) as well as immune cells (FCN1+ monocytes, C1QA+ macrophages, CD1C+ type I conventional DCs, CLEC4C+ plasmacytoid DCs (pDCs), CD4+ T cells, CD8A+ T cells and others) (Fig. 7a–c, Extended Data Fig. 7a and Supplementary Data 18). The abundance of epithelial and immune cell populations did not differ between patients with RPRA and healthy volunteers (Fig. 7d). Similarly, we found very few DEGs between patients with RPRA and healthy controls, and no differentially expressed Spectra programs (Extended Data Fig. 7b–d and Supplementary Data 19–21). These results suggested that lack of alveolar repair was not reflected in a lack of repair in the nasal epithelium in patients with RPRA.
Fig. 7. Transcriptomic changes in the nasal mucosa do not reflect ongoing inflammation in the distal lung in patients with RPRA.
a, UMAP plot showing integrated scRNA-seq analysis of nasal mucosa from patients with RPRA (n = 5) and healthy controls (n = 6). b, UMAP from a split by patients with RPRA or healthy controls. c, UMAP from a showing individual patients with RPRA (RPRA02, RPRA03 and RPRA05–RPRA07, n = 5) and healthy volunteers (HV11–HV13, HV15–HV17, n = 6). d, Relative cell-type abundance of cell clusters as in a in patients with RPRA (n = 5) and healthy controls (n = 6). No differences are significant (q < 0.05, pairwise Wilcoxon’s rank-sum tests with FDR correction).
Extended Data Fig. 7. Transcriptomic changes in the nasal mucosa do not reflect ongoing inflammation in the distal lung in patients with RPRA.
a. Dot plot showing expression of the selected cell type markers used to identify cell types in the integrated single-cell RNA-seq data from 5 patients with RPRA and 6 healthy control subjects from Fig. 7a. b. Bar plot showing the number of differentially expressed genes in different cell types between 5 patients with RPRA and 6 healthy control subjects (q < 0.05, Wald test with FDR correction) with and without filtering criteria applied. c. Hierarchical clustering on the signal-to-noise ratio of Spectra subject scores between patients with RPRA and healthy controls. No factors were differentially expressed (q < 0.05, Wilcoxon rank-sum test on subject scores with FDR correction). d. Heatmap of subject scores for Spectra programs. Each column represents a single subject. Rows are min-max scaled. MMP9hi basal cells (MMP9+ basal), proliferating basal cells (Prolif. Basal), suprabasal cells (Suprabasal), secretory cells (Secretory), basal cells (Basal), secretory ciliated cells (Secr. Ciliated), deuterosomal cells (Deuterosomal), type II conventional dendritic cells (DC2), plasmacytoid dendritic cells (pDC).
Discussion
In the present study, we performed molecular profiling of alveolar fluid from a large number of patients with resolving fibrosis after COVID-19 to look for evidence of a switch in alveolar macrophages to a resolution phenotype during recovery from lung injury. Although most patients in our study showed partial resolution of lung fibrosis by CT scan, the transcriptional phenotype of alveolar macrophages was similar in patients who did or did not show resolution. Our analysis indicated that monocyte-derived alveolar macrophages in patients with RPRA who showed improvement continued to express a host of genes that have been causally implicated in lung fibrosis in mouse models.
Our observations support a model in which monocyte-derived alveolar macrophages activate a stereotypical program in response to injury that promotes fibrosis. This fibrotic program is interrupted by successful alveolar repair, which provides signals, most importantly the alveolar epithelium-derived CSF2, that induce maturation of monocyte-derived alveolar macrophages into a phenotype resembling tissue-resident alveolar macrophages26,31. Consistent with this hypothesis, we found that accelerated epithelial repair after bleomycin-induced injury in mice reduced the recruitment of monocyte-derived alveolar macrophages and accelerated their differentiation toward a phenotype resembling a tissue-resident alveolar macrophage3. This model predicts that therapies targeting monocyte-derived alveolar macrophages may slow the development of fibrosis and are unlikely to impede lung repair after injury. Importantly, our findings do not exclude the possibility that the mature transcriptional phenotype of tissue-resident alveolar macrophages, which is unquestionably necessary for lung homeostasis, promotes lung repair1,3.
In the present study, we labeled alveolar macrophages as ‘tissue-resident’ or ‘monocyte-derived’ based on their transcriptional phenotype. This differs from mouse models, where genetic lineage tracing can provide a definitive assignment of alveolar macrophage ontogeny3–5,26. Thus, we cannot determine whether the inflammatory programs that we observed in tissue-resident alveolar macrophages from patients with RPRA reflect a response of mature tissue-resident macrophages to ongoing inflammatory signals in the alveolus or the slow resolution of these signals as monocyte-derived alveolar macrophages mature. Acute SARS-CoV-2 infection causes the death of tissue-resident alveolar macrophages and the recruitment of monocyte-derived alveolar macrophages2,32. In mice recovering from influenza A pneumonia, monocyte-derived alveolar macrophages (defined using a genetic lineage trace) obtain a tissue-resident phenotype 2 months after infection, a timepoint at which they are transcriptionally indistinguishable from the tissue-resident alveolar macrophages present before the infection, even after challenge with a second stimulus26.
Other groups have performed single-cell analysis of alveolar space in patients with PASC33,34. They identified transcriptional changes in T cells associated with PASC, but were unable to link specific immunological abnormalities to fibrotic pathology33,34. We observed increased levels of T cell chemoattractant chemokines in the BAL fluid, but they were not associated with changes in T cell abundance, gene expression or fibrosis severity. Instead, we identified an association across the abundance of neutrophils and the MoAM-1 subset, the relative expression of fibrotic genes in the MoAM-1 subset and the levels of the monocyte chemoattractant CCL2 (ref. 35) in BAL with the severity of fibrosis on CT in patients with RPRA.
Our study has several limitations. First, batch effects related to differences in scRNA-seq chemistries and sample-processing workflows required the use of transfer learning to compare alveolar macrophages from patients with RPRA, severe post-COVID-19 fibrosis and IPF, potentially masking some differences. However, analysis of the set of genes selected from Spectra programs associated with either profibrotic monocyte-derived alveolar macrophages or tissue-resident alveolar macrophages indicated that qualitative expression patterns were similar, irrespective of pulmonary fibrosis etiology. Second, although we did not find transcriptomic differences between profibrotic monocyte-derived alveolar macrophages from patients with resolving and nonresolving RPRA, we sampled only alveolar macrophages present in BAL fluid. Changes in other macrophage populations not sampled by the BAL procedure, for example, interstitial macrophages, might be important for the resolution of lung fibrosis. Third, as this was an observational cohort of limited size, we cannot draw conclusions about the impact of persistent SARS-CoV-2 infection or bacterial or viral superinfection, patient-specific comorbidities or COVID-19-specific therapies, including corticosteroid administration, that might have contributed to the course of RPRA. Fourth, although patients in our cohort showed partial fibrosis resolution on serial CT scans, we cannot determine whether they completely resolved their fibrosis. Finally, the duration of illness in COVID-19 exceeds that associated with other respiratory viral infections2,36. Hence, although persistent respiratory symptoms and CT abnormalities have long been observed in survivors of pneumonia caused by influenza and other respiratory viruses, we cannot say whether the pathobiology in these patients is similar to that of survivors of COVID-19 (ref. 37). Integration of our scRNA-seq data from BAL fluid samples from patients with RPRA with those from patients with persistent symptoms after pneumonia secondary to other respiratory viruses, or new strains of SARS-CoV-2, provides a possible approach to address this question.
Methods
Human participants
All human participant research was approved by the Northwestern University Institutional Review Board. Patients with RPRA were enrolled in study STU00213592. Healthy volunteers were enrolled in studies STU00206783 and STU00214826 at Northwestern University, or Pro00088966 and Pro00100375 at Duke University. Two patients with severe lung fibrosis necessitating consideration for lung transplantation after COVID-19 were co-enrolled in studies STU00212120 and STU00213592. All study participants or their surrogates provided informed consent. A total of 35 patients (42.9% female, median age 62 (range 32–83) years) were enrolled after undergoing evaluation at Northwestern Memorial Hospital between November 2020 and May 2022. Two patients were evaluated as inpatients; the remaining 33 patients were seen in the outpatient setting for symptoms related to RPRA. All patients with RPRA enrolled in the present study had a history of acute COVID-19 infection (nasopharyngeal swab PCR positive), persistent respiratory symptoms and abnormal CT lung imaging at least 30 d after a COVID-19 diagnosis. Two patients in the cohort subsequently underwent lung transplantation for COVID-19-induced lung fibrosis. Patients with RPRA underwent chest radiography, pulmonary function testing (PFT), laboratory assessment and in-person or telehealth visits at the discretion of the treating physician. Bronchoscopy was usually performed to exclude ongoing COVID-19 infection or superimposed respiratory infections as a cause of persistent pulmonary symptoms and radiographic abnormalities before initiation of glucocorticoids (median 158 d (range 24–448 d) after acute COVID-19 infection). Clinical data were manually extracted from the electronic health record. All patients included in the present study cohort underwent an initial CT scan a median of 145 d (range 20–489 d) after COVID-19 infection. Subsequent CT scans were obtained in 29 patients a median of 11 d (range 31–249 d) after the first CT scan. Healthy controls were taken to the bronchoscopy suite at Northwestern Memorial Hospital or Duke University Hospital. Bronchoscopy with BAL was performed as described below. A separate cohort of healthy volunteers provided informed consent for nasal curettage sampling as described below.
Bronchoscopy and BAL
Bronchoscopic BAL was performed in patients in the bronchoscopy suite or the ICU. Patients were given sedation and topical anesthesia at the discretion of the physician performing the bronchoscopy. The most involved bronchopulmonary segment was identified based on clinician review of the chest CT scan and 90–120 ml of saline was instilled into the segment of interest and aspirated back with the first 5 ml of return discarded. In patients with RPRA, residual fluid beyond that needed for clinical testing (cell count, differential, BioFire Pneumonia Panel multiplex PCR, amylase and quantitative culture) was refrigerated on site and processed within <6 h. The BAL sample from the donor lung in patient RPRA13 was included in the analysis together with BAL samples obtained from healthy volunteers.
Nasal curettage
Donors were seated and asked to extend their neck. A nasal curette (Rhino-Pro, VWR International) was inserted into either naris and gently slid in the direction posterior to anterior ~1 cm along the lateral inferior turbinate. Five curettes were obtained per participant. The curette tip was then cut and placed in 2 ml of HypoThermosol and stored at 4 °C until processing.
Treatment and follow-up assessment
The standard corticosteroid regimen was 1 mg kg−1 of prednisone, tapered by 10 mg every 2 weeks. For all patients undergoing steroid treatment, a follow-up CT scan of the chest was available.
CT scan machine learning analysis
We evaluated each baseline high-resolution CT scan with previously established quantitative techniques using the Chest Imaging Platform (https://chestimagingplatform.org/). In brief, after segmenting the lungs and the lobes, the lung parenchyma of every scan was analyzed by classifying regions of interest into one of three categories: normal lung, interstitial alterations or emphysema. This classification was achieved through the utilization of a k-nearest neighbor classifier, which relied on local tissue density and distance from the pleural surface. Parenchymal changes were further categorized into: reticular, subpleural line, linear scar and honeycombing (these aggregate interstitial features hereafter referred to as ‘fibrotic’); centrilobular nodule and nodular; and ground-glass patterns using the characteristics of the local histogram computed in the patch size of 32 × 32 pixels. The machine learning algorithm was not trained on specific pulmonary fibrosis features and, so, several categories of interstitial parenchymal abnormalities were combined for the purposes of detecting this group of abnormalities. Normal-appearing lung parenchyma was further reclassified into high-attenuation normal lung for those patches with a mean lung density above the 95th percentile of lung density from a training subset of control, lifelong nonsmokers as previously described16. Ground-glass patterns and high-attenuation normal lung (referred to as ‘normal inflamed’) were aggregated into the inflammatory compartment. The total lung volume was used to standardize each feature, which was then aggregated for analysis. Comparison of the inflammatory fraction of the initial CT scan with peripheral blood monocyte levels at the time of the initial CT scan was performed in 22 patients with RPRA who had a complete blood count (CBC) performed within 14 d of the CT scan (Supplementary Data 22).
Flow cytometry and cell sorting
BAL fluid samples were filtered through a 70-μm cell strainer, pelleted by centrifugation at 400 relative centrifugal force (rcf) for 10 min at 4 °C, followed by hypotonic lysis of red blood cells with 2 ml of PharmLyse (BD Biosciences) reagent for 2 min. Lysis was stopped by adding 13 ml of MACS buffer (Miltenyi Biotech). Cells were pelleted again and resuspended in 100 μl of a 1:10 dilution of Human TruStain FcX (BioLegend) in MACS buffer and a 10-μl aliquot was taken for counting using a K2 Cellometer (Nexcelom) with Acridine Orange (AO)/Propidium Iodide (PI) reagent. The cell suspension volume was adjusted so the concentration of cells was always <5 × 10⁷ cells ml−1 and the fluorophore-conjugated antibody cocktail was added in a 1:1 ratio. The following antibodies were used (antigen, clone, fluorochrome, manufacturer, catalog no., final dilution): CD4, RPA-T4, BUV395, BD, 564724, 1:40; CD19, HIB19, BUV395, BD, 740287, 1:40; CD25, 2A3, BUV737, BD, 564385, 1:20; CD56, NCAM16.2, BUV737, BD, 612766, 1:20; HLA-DR, L243, eFluor450, Thermo Fisher Scientific, 48-9952-42, 1:40; CD45, HI30, BV510, BioLegend, 304036, 1:20; CD15, HI98, BV786, BD, 563838, 1:20; CD3, SK7, PE, Thermo Fisher Scientific, 12-0036-42, 1:20; CD127, HIL-7R, PECF594, BD, 562397, 1:20; CD206, 19.2, PECy7, Thermo Fisher Scientific, 25-2069-42, 1:40; CD8, SK1, APC, BioLegend, 344721, 1:40; CD14, M5E2, APC, BioLegend, 301808, 1:40; and EpCAM, 9C4, APC, BioLegend, 324208, 1:40. After incubation at 4 °C for 30 min, cells were washed with 5 ml of MACS buffer, pelleted by centrifugation and resuspended in 500 μl of MACS buffer with 2 μl of SYTOX Green viability dye (Thermo Fisher Scientific). Cells were sorted on a FACS Aria III SORP instrument using a 100-μm nozzle. Cells were sorted into 300 μl of 2% bovine serum albumin (BSA) in Dulbecco’s phosphate-buffered saline and cryopreserved using the protocol by L. Mazutis38. Briefly, cells pelleted by centrifugation at 400 rcf for 5 min at 4 °C, resuspended in Bambanker freezing medium to ~2,000 cells μl−1 concentration. Concentration was confirmed using a K2 Cellometer (Nexcelom) with AO/PI reagent using the ‘Immune cells low RBC’ program with default settings and ~40-μl aliquots were immediately frozen at −80 °C. Sample processing was performed in a BSL-2 facility using BSL-3 practices. Analysis of the flow cytometry data was performed using FlowJo v.10.7.1. using a sequential gating strategy reported in our previous publication2 and reviewed by two investigators (S.S. and A.V.M.). A fraction of cells that was not definitively resolved by our panel was labeled ‘others’. Relative cell-type abundance was calculated as a percentage of all singlets/live/CD45+ cells.
ScRNA-seq of flow cytometry-sorted BAL cells
ScRNA-seq was performed using Chromium Next GEM Single Cell 5′ reagents v.2 (10x Genomics, protocol no. CG000331 Rev A). Immediately before loading 10x Genomics Chip K with Chromium Single Cell 5′-gel beads and reagents, aliquots of cryopreserved cells were retrieved from a −80 °C freezer, rapidly thawed in a water bath at 37 °C, gently mixed by pipetting and added to the mix at room temperature. The volume of the single-cell suspension was calculated using the above protocol of 10x Genomics, based on the concentration at the time of cryopreservation and aiming to capture 5,000–10,000 cells per library. Libraries were prepared according to the manufacturer’s protocol. After quality checks, scRNA-seq libraries were pooled and sequenced on a NovaSeq 6000 instrument.
Nasal curettage processing and scRNA-seq
A single-cell suspension was generated using the cold-active dispase protocol reported by Deprez et al.39 and Zaragosi and Barbry40 with slight modification. Specifically, EDTA was omitted and cells were dispersed by pipetting 20 every 5 min using a 1-ml tip instead of tritration using a 21G or 23G needle. The final concentration of protease from Bacillus licheniformis was 10 mg ml−1. The total digestion time was 30 min. After the wash in 4 ml of 0.5% BSA in phosphate-buffered saline (PBS) and centrifugation at 400g for 10 min, cells were resuspended in 0.5% BSA in PBS and counted using a Nexcelom K2 Cellometer with AO/PI reagent. This protocol typically yields ~300,000–500,000 cells with a viability of >95%. The resulting single-cell suspension was then used to generate single-cell libraries following the protocol for 5′ v.1 (10x Genomics, prototcol no. CG000086 Rev M) or v.2 chemistry. Excess cells from two of the samples from healthy volunteers were pooled to generate one additional single-cell library. After a quality check, the libraries were pooled and sequenced on a NovaSeq 6000 instrument. To assign sample information to cells in the single-cell library prepared from two samples, we ran souporcell v.2.0 (ref. 41) for that library and two libraries that were prepared from these samples separately. We used common genetic variants prepared by the souporcell authors to separate cells into two groups by genotype for each library and Pearson’s correlation between the identified genotypes across libraries to establish correspondence between genotype and sample. We prepared, sequenced and analyzed scRNA-seq libraries from seven healthy volunteers. However, after initial analysis, one library was excluded as a result of overall low quality (HV14) and only six libraries were included in the final analysis.
Statistical methods
No statistical method was used to predetermine sample size. The experiments were not randomized. The Investigators were not blinded to allocation during experiments and outcome assessment. All statistics in the manuscript are reported as specified in the figure legends. When multiple hypothesis tests were performed, the false discovery rate (FDR) was controlled using the procedure of Benjamini and Hochberg42. A significance level of 0.05 was used for all tests. Wilcoxon’s rank-sum tests and permutation tests were performed in R using coin v.1.4–3 (refs. 43,44) and Python using scipy v.1.10.0 (ref. 45). Linear models and associated confidence intervals were computed using the stat_smooth function with method = ‘lm’ in ggplot2 3.5.0.
Visualization
Plotting in R was performed using ggplot2 v.3.5.0 (ref. 46). Figures were assembled using either patchwork v.1.2.0 (ref. 47) or Adobe Illustrator. Heatmaps were generated using ComplexHeatmap v.2.14.0 (ref. 48). Significance bars were added to boxplots using ggsignif v.0.6.4 (ref. 49). Figure 1b was generated using ggalluvial v.0.12.5 (ref. 50). Plotting in Python was primarily performed using matplotlib v.3.7.0/3.8.4 (ref. 51) and seaborn v.0.12.2/0.13.2 (ref. 52). Upset plots were generated using upsetplot v.0.8.0 (ref. 53).
ScRNA-seq analysis
Data were processed using the Cell Ranger 7.0.0 pipeline with exon-only processing mode (10x Genomics). To enable detection of viral RNA, reads were aligned to a customized hybrid genome containing GRCh38.98 and SARS-CoV-2 (accession no. NC_045512.2). An additional negative-strand transcript spanning the entirety of the SARS-CoV-2 genome was then added to the GTF and GFF files to enable detection of SARS-CoV-2 replication. Data were processed using Scanpy v.1.9.2 (ref. 54) and multisample integration was performed with scvi-tools v.0.20.0 (refs. 55–57). The scVI models for both the BAL and nasal samples were constructed on 1,000 highly variable genes with the hyperparameters n_layers = 2, dropout_rate = 0.2 and n_latent = 10, and were trained using the settings max_epochs = 500, check_val_every_n_epoch = 2 and early_stopping = True. Default hyperparameters and settings were used otherwise. An initial round of Leiden clustering using the function sc.tl.leiden was performed on the integrated BAL object with a resolution of 1.2 and on the integrated nasal object with a resolution of 0.75. Clusters characterized by low numbers of detected genes and transcripts and a high percentage of mitochondrial genes were removed. Clusters containing doublets were identified as clusters simultaneously expressing lineage-specific marker genes (for example, C1QA for macrophages and CD3G for T cells) and excluded. Cell types were identified by marker genes, computed using the sc.tl.rank_genes_groups function with the settings method = ‘wilcoxon’ and n_genes = 200, and default settings otherwise. Count matrices are available via the Gene Expression Omnibus (GEO): BAL from healthy volunteers (accession no. GSE232616), nasal curettage from healthy volunteers (accession no. GSE232623) and BAL and nasal curettage from patients with RPRA (accession no. GSE232627).
Differential abundance analysis for scRNA-seq data
As neutrophils represented a significant fraction of immune cells in BAL fluid and were excluded during the cell sorting, we used the percentage of neutrophils from flow cytometry analysis to correct the denominator for estimating relative cell abundance (see ‘Code availability’ for details).
Differential expression analysis
To take advantage of the multiple participants in each condition and avoid P-value inflation inherent to approaches where each cell is treated as an independent observation, we summed RNA transcript counts for each participant on a per-cell-type level (pseudobulk approach)58. Samples were retained for differential expression analysis of a given cell type if they contained at least 40 cells of that type and constituted at least 1% of all cells of that type. Differential expression analysis was performed in R v.4.2.3 using DESeq2 v.1.38.3 (ref. 59). A ‘local’ model of gene dispersion was used and default settings were used otherwise. DEGs were those with q < 0.05 (Wald’s test with FDR correction). To help identify genes of interest, we applied two filtering criteria. First, we removed genes encoding ribosomal proteins from the list of DEGs. The second criterion was used to correct for the fact that information on number of cells is not taken into account in pseudobulk differential expression. For each gene and cell type, we counted the number of samples in which the gene was expressed in >2% of cells of that type in each sample. Genes that did not satisfy this criterion in at least four samples were removed.
Reanalysis of previously published datasets
To enable analysis of macrophage subsets across different studies, we harmonized cell-type labels using transfer learning60. We reasoned that the dataset reported in the present study was generated only from cells detectable on BAL and some profibrotic macrophages located within the tissue may not be well represented. Therefore, we first performed reanalysis of our previously published dataset (GEO accession no. GSE122960)18, which was generated from enzymatically digested lung tissue from donor lungs and patients with pulmonary fibrosis. We performed integration, clustering and cell-type annotation using scVI tools and sets of marker genes reported in this manuscript and in the integrated lung cell atlas61 (see ‘Code availablity’ for details and integrated object). As sequencing data from GEO accession no. GSE122960 was originally mapped to GRCh38 build 84, we realigned data to a more recent version of the reference genome (GRCh38 build 93 supplemented with SARS-CoV-2 genome, which was used to align data from the present study and that of Bharat et al.19) and used scArches60 to transfer cell-type labels from the build 84 object on to the build 93 object. We then trained scArches on this object and transferred labels on to macrophages from Bharat et al. (accession no. GSE158127)19 and the object from the present study (Fig. 5b and Extended Data Fig. 5c). Mitochondrial genes, ribosomal genes and genes exclusively detected in only one of the chemistries were removed (see ‘Code availablity’ for details).
Factor analysis of scRNA-seq data
Matrix factorization was performed using Spectra v.0.1.0 (ref. 25). The list of gene sets used for the initial factors is the same as the list used in the Spectra manuscript and is provided in Supplementary Data 8. Factors that had fewer than three genes expressed in the data were removed. Training for both the BAL and nasal data was done using the hyperparameters lam = 0.01 and rho = None, and the default from hyperparameters and settings otherwise. To determine which factors were differentially expressed between patients with RPRA and healthy volunteers in each cell type, we defined a participant score as the mean cell score of a factor across all cells of the specified type belonging to each patient. Differentially expressed factors were those with q < 0.05 (Wilcoxon’s rank-sum test on participant scores with FDR correction). Samples were used in differential factor expression analysis for a given cell type if they contained at least 40 cells of that type and constituted at least 1% of all cells of that type. A minimum of three participants per condition were required for comparison. When computing correlations between participant scores and CT features, a minimum of ten patients with RPRA was required to pass the filtering procedure to ensure robust correlations.
Multiplexed cytokine assays of BAL fluid
Multiplexed cytokine profiling of BAL fluid was performed by Eve Technologies. Samples were thawed and aliquoted at 100 µl, frozen and shipped to Eve Technologies on dry ice. The Human Cytokine/Chemokine 71-Plex Discovery Assay (HD71) was then performed on each sample. Customized outputs containing raw median fluorescent intensity (MFI) values, standard curve concentrations and bead counts for processing are as described below.
Multiplexed cytokine assay processing and analysis
Analysis was performed as described in our previous publication62. Briefly, raw MFI values, bead counts and standard concentrations were first stripped from the data output from either Exponent (in-house assays; Luminex) or bespoke output from Eve Technologies. MFI measurements with <50 bead counts were discarded. Standard curves for each cytokine were then fit for each assay run using self-starting five-parameter logistic (5PL) models with drc v.3.2-0 (ref. 63). Cutoffs for curves with low predictive value were then determined empirically using histogram MFI values versus standard concentrations to identify a bimodal distribution cutoff. For in-house assays, all values calculated using standard curves with MFI < 50 at 100 pg ml−1 were discarded. For Eve Technologies’ assays, all values calculated using standard curves with MFI < 50 at 10 pg ml−1 were discarded. Experimental values for each cytokine were then predicted using the ED function in drc with ‘absolute’ value prediction. In rare cases where a 5PL model could not be fit for an individual cytokine–assay combination, these values were excluded. Values below the lower asymptote of the model were set to a concentration of 0 pg ml−1. Values above the upper asymptote were set to the value of the upper asymptote. Technical replicates were collapsed by mean with not available (N/A) values excluded.
Reporting summary
Further information on research design is available in the Nature Portfolio Reporting Summary linked to this article.
Online content
Any methods, additional references, Nature Portfolio reporting summaries, source data, extended data, supplementary information, acknowledgements, peer review information; details of author contributions and competing interests; and statements of data and code availability are available at 10.1038/s41590-024-01975-x.
Supplementary information
Metadata for RPRA cohort. Dates are reported as days after COVID diagnosis.
Metadata for healthy volunteers.
CT scan data.
Lung fractions from initial CT scans.
Lung fractions from follow-up CT scans.
Cell-type percentages from flow cytometry analysis of BAL fluid.
Marker genes for integrated BAL scRNA-seq object.
Cell-type percentages for integrated BAL scRNA-seq object. Raw percentages and percentages scaled by the abundance of neutrophils are reported.
Input Spectra factors for both BAL and nasal scRNA-seq data.
Gene weights of the top 100 genes of Spectra factors for BAL scRNA-seq object.
Functional annotation for selected BAL Spectra programs and specific genes.
Output of DESeq2 analysis for integrated BAL scRNA-seq data.
Differential expression analysis of Spectra programs between profibrotic MoAM-1 and other macrophage subsets in patients with RPRA.
Output of DESeq2 analysis for MoAM-1 in integrated BAL scRNA-seq data between patients with resolving and patients with nonresolving RPRA.
Differential expression analysis of Spectra programs in immune cells from patients with resolving versus nonresolving RPRA.
Marker genes for integrated and re-annotated scRNA-seq object from Reyfman et al., AJRCCM, 2019.
Cytokine concentrations.
Marker genes for integrated nasal scRNA-seq object.
Output of DESeq2 analysis for integrated nasal scRNA-seq object.
Cell-type percentages for integrated nasal scRNA-seq object.
Gene weights of the top 100 genes of Spectra factors for nasal scRNA-seq object.
CBC panel data.
Acknowledgements
This research was supported in part through a generous gift from K. Querrey and L. Simpson. This work was supported, in part, by a generous gift from Mr. and Mrs. Ferro. This research was also supported by the computational resources and staff contributions provided for the Quest high-performance computing facility at Northwestern University, which is jointly supported by the Office of the Provost, the Office for Research and Northwestern University Information Technology. This research was also supported in part through the computational resources and staff contributions provided by the Genomics Compute Cluster, which is jointly supported by the Feinberg School of Medicine, the Center for Genetic Medicine and Feinberg’s Department of Biochemistry and Molecular Genetics, the Office of the Provost, the Office for Research and Northwestern Information Technology. The Genomics Compute Cluster is part of Quest, Northwestern University’s high-performance computing facility, with the purpose of advancing research in genomics. We thank J. Milhans, A. Kinaci, S. Coughlin and all members of the Research Computing and Data Services team at Northwestern for their support. Northwestern University Flow Cytometry Core Facility is supported by the National Cancer Institute Cancer Center support grant (no. P30 CA060553) awarded to the Robert H. Lurie Comprehensive Cancer Center. Cell sorting was performed on a BD FACS Aria SORP cell sorter purchased with the support of the National Institutes of Health (NIH, grant no. 1S10OD011996-01). Integrative genomic services were performed by the Metabolomics Core Facility at Robert H. Lurie Comprehensive Cancer Center of Northwestern University. Next-generation sequencing was performed with support from the Simpsons Querrey Institute for Epigenetics. J.I.B. was supported by NIH grants (nos. T32HL076139 and UL1TR001422). C.H.P. and R.B. were supported by NIH/National Institute on Aging (grant no. R01AG068579), Simons Foundation (grant no. 597491-RWC01) and the National Science Foundation (NSF, grant no. 1764421-01). C.H.P. was also supported by the NSF (grant no. DMS-1547394). N.S.M. was supported by the American Heart Association (grant no. 24PRE1196998). Raul S.J.E. was supported by the NIH (grant no. 5R21LM013670). G.R.W. was supported by the NIH (grant nos. P01HL114501 and R01HL116931) and grants from the Department of Defense and Boehringer Ingelheim. A.B. was supported by the NIH (grant nos. R01HL147290, R01HL145478 and R01HL147575). R.A.G. was supported by the NIH (grant no. 1F31AG071225), Simpson Querrey Fellowship in Data Science as Kimberly Querrey Fellow and Schmidt Science Fellows program, in partnership with the Rhodes Trust. R.M.T. was supported by the NIH (grant nos. R01ES034350 and R01ES027574). K.M.G. was supported by the NIH (grant no. R01ES028829). J.I.S. was supported by the NIH (grant nos. R01HL173987, P01HL154998 and P01AG049665). K.M.R. was supported by the NIH (grant nos. P01HL154998 and P01AG049665). G.R.S.B. was supported by a Chicago Biomedical Consortium grant, Northwestern University Dixon Translational Science Award, Simpson Querrey Lung Institute for Translational Science, the NIH (grant nos. P01AG049665, P01HL154998, U54AG079754, R01HL147575, R01HL158139, R01HL147290, R21AG075423 and U19AI135964) and the Veterans Administration (award no. I01CX001777). A.V.M. was supported by the NIH (grant nos. U19AI135964, P01AG049665, P01HL154998, U19AI181102, R01HL153312, R01HL158139, R01ES034350 and R21AG075423). The funders had no role in the study design, data collection and analysis, decision to publish or preparation of the manuscript.
Extended data
Author contributions
J.I.B., C.H.P., K.J.S., R.K., G.R.W., G.R.S.B., R.B., A.V.M. and M.A.S. conceived the study. J.I.B., C.H.P., K.J.S., R.K., G.R.W., G.R.S.B., R.B., A.V.M. and M.A.S. designed the study. J.I.B., C.H.P., K.J.S., N.S.M., E.D., E.J., Z.Y., S.S., Z.L., S.F., R.A.G., H.A.V., R.J.M., A.L., J.M., R.I.C., R.M.T., K.M.G., R.K., M.J., A.B., C.K., Ruben S.J.E., Raul S.J.E., G.R.W., A.S., J.I.S., K.M.R., G.R.S.B., R.B., A.V.M. and M.A.S. implemented the study. J.I.B., C.H.P., K.J.S., G.R.S.B., R.B., A.V.M., G.R.W., Raul S.J.E. and M.A.S. analyzed and interpreted the data. J.I.B., C.H.P., K.J.S., G.R.S.B., R.B., A.V.M. and M.A.S. drafted the manuscript. J.I.B., C.H.P., K.J.S., G.R.S.B., R.B., A.V.M. and M.A.S. revised and reviewed the manuscript. G.R.S.B., R.B., A.V.M. and M.A.S. held public responsibility for the study.
Peer review
Peer review information
Nature Immunology thanks the anonymous reviewers for their contribution to the peer review of this work. Peer reviewer reports are available. Primary Handling Editor: Ioana Staicu, in collaboration with the Nature Immunology team.
Data availability
Count matrices are available via GEO: BAL from healthy volunteers (accession no. GSE232616), nasal curettage from healthy volunteers (accession no. GSE232623) and BAL and nasal curettage from patients with RPRA (accession no. GSE232627).
Code availability
Code is available at https://github.com/NUPulmonary/Bailey_Puritz_Senkow_RPRA_2024. ScRNA-seq data can be explored via the University of California Santa Cruz Cell Browser at https://www.nupulmonary.org/covid-19.
Competing interests
G.R.W. reports consultancy agreements and advisory boards with AstraZeneca, Intellia Therapeutics, Pieris Pharmaceuticals, Sanofi, Regeneron and Verona Pharma and has received grant support from the NIH, Department of Defense and Boehringer Ingelheim. He is a cofounder and equity shareholder in Quantitative Imaging Solutions, a company that provides consulting services for image and data analytics. G.R.W.’s spouse works for Biogen. Raul S.J.E. received contracts to serve as the Image Core for studies funded by Lung Biotechnology, Insmed and Gossamer Bio. He has a Sponsored Research Agreement with Boehringer Ingelheim and has served as a consultant for Leuko Labs and Mount Sinai. He is a cofounder and equity shareholder in Quantitative Imaging Solutions. The other authors declare no competing interests.
Footnotes
Publisher’s note Springer Nature remains neutral with regard to jurisdictional claims in published maps and institutional affiliations.
These authors contributed equally: Joseph I. Bailey, Connor H. Puritz, Karolina J. Senkow.
These authors jointly supervised this work: G. R. Scott Budinger, Alexander V. Misharin, Marc A. Sala.
Contributor Information
Alexander V. Misharin, Email: a-misharin@northwestern.edu
Marc A. Sala, Email: marc.sala@northwestern.edu
Extended data
is available for this paper at 10.1038/s41590-024-01975-x.
Supplementary information
The online version contains supplementary material available at 10.1038/s41590-024-01975-x.
References
- 1.Watanabe, S. et al. The role of macrophages in the resolution of inflammation. J. Clin. Invest.129, 2619–2628 (2019). [DOI] [PMC free article] [PubMed] [Google Scholar]
- 2.Grant, R. A. et al. Circuits between infected macrophages and T cells in SARS-CoV-2 pneumonia. Nature10.1038/s41586-020-03148-w (2021). [DOI] [PMC free article] [PubMed] [Google Scholar]
- 3.Watanabe, S. et al. Resetting proteostasis with ISRIB promotes epithelial differentiation to attenuate pulmonary fibrosis. Proc. Natl Acad. Sci. USA118, e2101100118 (2021). [DOI] [PMC free article] [PubMed] [Google Scholar]
- 4.Misharin, A. V. et al. Monocyte-derived alveolar macrophages drive lung fibrosis and persist in the lung over the life span. J. Exp. Med.214, 2387–2404 (2017). [DOI] [PMC free article] [PubMed] [Google Scholar]
- 5.Joshi, N. et al. A spatially restricted fibrotic niche in pulmonary fibrosis is sustained by M-CSF/M-CSFR signalling in monocyte-derived alveolar macrophages. Eur. Respir. J.55, 1900646 (2020). [DOI] [PMC free article] [PubMed] [Google Scholar]
- 6.Coates, B. M. et al. Inflammatory monocytes drive Influenza A virus-mediated lung injury in juvenile mice. J. Immunol.200, 2391–2404 (2018). [DOI] [PMC free article] [PubMed] [Google Scholar]
- 7.McCubbrey, A. L. et al. Deletion of c-FLIP from CD11bhi macrophages prevents development of bleomycin-induced lung fibrosis. Am. J. Respir. Cell Mol. Biol.58, 66–78 (2018). [DOI] [PMC free article] [PubMed] [Google Scholar]
- 8.Herold, S. et al. Lung epithelial apoptosis in influenza virus pneumonia: the role of macrophage-expressed TNF-related apoptosis-inducing ligand. J. Exp. Med.205, 3065–3077 (2008). [DOI] [PMC free article] [PubMed] [Google Scholar]
- 9.Kurihara, C. et al. Clinical characteristics and outcomes of patients with COVID-19-associated acute respiratory distress syndrome who underwent lung transplant. JAMA327, 652–661 (2022). [DOI] [PMC free article] [PubMed] [Google Scholar]
- 10.Mylvaganam, R. J., Bailey, J. I., Sznajder, J. I., Sala, M. A. & Northwestern Comprehensive COVID Center Consortium. Recovering from a pandemic: pulmonary fibrosis after SARS-CoV-2 infection. Eur. Respir. Rev.30, 210194 (2021). [DOI] [PMC free article] [PubMed] [Google Scholar]
- 11.Thaweethai, T. et al. Development of a definition of postacute sequelae of SARS-CoV-2 infection. JAMA329, 1934–1946 (2023). [DOI] [PMC free article] [PubMed] [Google Scholar]
- 12.Stewart, I. et al. Residual lung abnormalities after COVID-19 hospitalization: interim analysis of the UKILD post-COVID-19 study. Am. J. Respir. Crit. Care Med.10.1164/rccm.202203-0564OC (2022). [DOI] [PMC free article] [PubMed]
- 13.Bailey, J. et al. Multidisciplinary center care for long COVID syndrome—a retrospective cohort study. Am. J. Med.10.1016/j.amjmed.2023.05.002 (2023). [DOI] [PMC free article] [PubMed] [Google Scholar]
- 14.Mendoza, C. S. et al. Proc. IEEE International Symposium on Biomedical Imaging (IEEE, 2012).
- 15.Ash, S. Y. et al. The objective identification and quantification of interstitial lung abnormalities in smokers. Acad. Radiol.24, 941–946 (2017). [DOI] [PMC free article] [PubMed] [Google Scholar]
- 16.Harmouche, R. et al. Objectively measured chronic lung injury on chest CT. Chest156, 1149–1159 (2019). [DOI] [PMC free article] [PubMed] [Google Scholar]
- 17.Scott, M. K. D. et al. Increased monocyte count as a cellular biomarker for poor outcomes in fibrotic diseases: a retrospective, multicentre cohort study. Lancet Respir. Med.7, 497–508 (2019). [DOI] [PMC free article] [PubMed] [Google Scholar]
- 18.Reyfman, P. A. et al. Single-cell transcriptomic analysis of human lung provides insights into the pathobiology of pulmonary fibrosis. Am. J. Respir. Crit. Care Med.199, 1517–1536 (2019). [DOI] [PMC free article] [PubMed] [Google Scholar]
- 19.Bharat, A. et al. Lung transplantation for patients with severe COVID-19. Sci. Transl. Med.12, eabe4282 (2020). [DOI] [PMC free article] [PubMed] [Google Scholar]
- 20.Mould, K. J. et al. Airspace macrophages and monocytes exist in transcriptionally distinct subsets in healthy adults. Am. J. Respir. Crit. Care Med.203, 946–956 (2021). [DOI] [PMC free article] [PubMed] [Google Scholar]
- 21.Morse, C. et al. Proliferating SPP1/MERTK-expressing macrophages in idiopathic pulmonary fibrosis. Eur. Respir. J.54, 1802441 (2019). [DOI] [PMC free article] [PubMed] [Google Scholar]
- 22.Adams, T. S. et al. Single-cell RNA-seq reveals ectopic and aberrant lung-resident cell populations in idiopathic pulmonary fibrosis. Sci. Adv.6, eaba1983 (2020). [DOI] [PMC free article] [PubMed] [Google Scholar]
- 23.Habermann, A. C. et al. Single-cell RNA sequencing reveals profibrotic roles of distinct epithelial and mesenchymal lineages in pulmonary fibrosis. Sci. Adv.6, eaba1972 (2020). [DOI] [PMC free article] [PubMed] [Google Scholar]
- 24.Gao, X. et al. Osteopontin links myeloid activation and disease progression in systemic sclerosis. Cell Rep. Med.1, 100140 (2020). [DOI] [PMC free article] [PubMed] [Google Scholar]
- 25.Kunes, R. Z., Walle, T., Land, M., Nawy, T. & Pe’er, D. Supervised discovery of interpretable gene programs from single-cell data. Nat. Biotechnol.10.1038/s41587-023-01940-3 (2023). [DOI] [PMC free article] [PubMed] [Google Scholar]
- 26.McQuattie-Pimentel, A. C. et al. The lung microenvironment shapes a dysfunctional response of alveolar macrophages in aging. J. Clin. Invest.131, e140299 (2021). [DOI] [PMC free article] [PubMed] [Google Scholar]
- 27.Sala, M. A. et al. Inflammatory pathways are upregulated in the nasal epithelium in patients with idiopathic pulmonary fibrosis. Respir. Res.19, 233 (2018). [DOI] [PMC free article] [PubMed] [Google Scholar]
- 28.Poole, A. et al. Dissecting childhood asthma with nasal transcriptomics distinguishes subphenotypes of disease. J. Allergy Clin. Immunol.133, 670–678.e12 (2014). [DOI] [PMC free article] [PubMed] [Google Scholar]
- 29.Sajuthi, S. P. et al. Nasal airway transcriptome-wide association study of asthma reveals genetically driven mucus pathobiology. Nat. Commun.13, 1632 (2022). [DOI] [PMC free article] [PubMed] [Google Scholar]
- 30.Lindeboom, R. G. H. et al. Human SARS-CoV-2 challenge uncovers local and systemic response dynamics. Nature631, 189–198 (2024). [DOI] [PMC free article] [PubMed] [Google Scholar]
- 31.Gschwend, J. et al. Alveolar macrophages rely on GM-CSF from alveolar epithelial type 2 cells before and after birth. J. Exp. Med.218, e20210745 (2021). [DOI] [PMC free article] [PubMed] [Google Scholar]
- 32.Simpson, D. S. et al. Interferon-γ primes macrophages for pathogen ligand-induced killing via a caspase-8 and mitochondrial cell death pathway. Immunity55, 423–441.e9 (2022). [DOI] [PMC free article] [PubMed] [Google Scholar]
- 33.Cheon, I. S. et al. Immune signatures underlying post-acute COVID-19 lung sequelae. Sci. Immunol.6, eabk1741 (2021). [DOI] [PMC free article] [PubMed] [Google Scholar]
- 34.Mehta, P. et al. Single-cell analysis of bronchoalveolar cells in inflammatory and fibrotic post-COVID lung disease. Front. Immunol.15, 1372658 (2024). [DOI] [PMC free article] [PubMed] [Google Scholar]
- 35.Neehus, A.-L. et al. Human inherited CCR2 deficiency underlies progressive polycystic lung disease. Cell187, 390–408.e23 (2024). [DOI] [PMC free article] [PubMed] [Google Scholar]
- 36.Gao, C. A. et al. Machine learning links unresolving secondary pneumonia to mortality in patients with severe pneumonia, including COVID-19. J. Clin. Invest.133, e170682 (2023). [DOI] [PMC free article] [PubMed] [Google Scholar]
- 37.Fabbri, L. et al. Parenchymal lung abnormalities following hospitalisation for COVID-19 and viral pneumonitis: a systematic review and meta-analysis. Thorax78, 191–201 (2023). [DOI] [PubMed] [Google Scholar]
- 38.Mazutis, L. & Masilionis, I. Archival preservation of cell suspensions for scRNA-Seq. Protocols.iohttps://www.protocols.io/view/archival-preservation-of-cell-suspensions-for-scrn-5qpvo53j9l4o/v1 (2020).
- 39.Deprez, M. et al. A single-cell atlas of the human healthy airways. Am. J. Respir. Crit. Care Med.10.1164/rccm.201911-2199OC (2020). [DOI] [PubMed] [Google Scholar]
- 40.Zaragosi, L.-E. & Barbry, P. Cell dissociation from nasal and bronchial brushings with cold-active protease for single-cell RNA-seq. Protocols.iowww.protocols.io/view/cell-dissociation-from-nasal-and-bronchial-brushin-qubdwsn (2019).
- 41.Heaton, H. et al. Souporcell: robust clustering of single-cell RNA-seq data by genotype without reference genotypes. Nat. Methods17, 615–620 (2020). [DOI] [PubMed] [Google Scholar]
- 42.Benjamini, Y. & Hochberg, Y. Controlling the false discovery rate: a practical and powerful approach to multiple testing. J. R. Stat. Soc. B57, 289–300 (1995). [Google Scholar]
- 43.Hothorn, T., Hornik, K., van de Wiel, M. A. & Zeileis, A. Implementing a class of permutation tests: the coin package. J. Stat. Softw. 10.18637/jss.v028.i08 (2008).
- 44.Hothorn, T., Hornik, K., van de Wiel, M. A. & Zeileis, A. A Lego system for conditional inference. Am. Stat.60, 257–263 (2006). [Google Scholar]
- 45.Virtanen, P. et al. SciPy 1.0: fundamental algorithms for scientific computing in Python. Nat. Methods17, 261–272 (2020). [DOI] [PMC free article] [PubMed] [Google Scholar]
- 46.Wickham, H. Ggplot2: Elegant Graphics for Data Analysis (Springer-Verlag, 2016).
- 47.Pedersen, T. L. Patchwork. GitHubhttps://github.com/thomasp85/patchwork (2024).
- 48.Gu, Z. Complex heatmap visualization. Imeta1, e43 (2022). [DOI] [PMC free article] [PubMed] [Google Scholar]
- 49.Constantin, A.-E. & Patil, I. ggsignif: R package for displaying significance brackets for ‘ggplot2’. Preprint at PsyArxiv10.31234/osf.io/7awm6 (2021).
- 50.Brunson, J. ggalluvial: layered grammar for alluvial plots. J. Open Source Softw.5, 2017 (2020). [DOI] [PMC free article] [PubMed] [Google Scholar]
- 51.Hunter, J. D. Matplotlib: a 2D graphics environment. Comput. Sci. Eng.9, 90–95 (2007). [Google Scholar]
- 52.Waskom, M. seaborn: statistical data visualization. J. Open Source Softw.6, 3021 (2021). [Google Scholar]
- 53.Nothman, J. UpSetPlot documentation—upsetplot 0.9.0 documentation. upsetplothttps://upsetplot.readthedocs.io/en/stable (2014).
- 54.Wolf, F. A., Angerer, P. & Theis, F. J. SCANPY: large-scale single-cell gene expression data analysis. Genome Biol.19, 15 (2018). [DOI] [PMC free article] [PubMed] [Google Scholar]
- 55.Xu, C. et al. Probabilistic harmonization and annotation of single-cell transcriptomics data with deep generative models. Mol. Syst. Biol.17, e9620 (2021). [DOI] [PMC free article] [PubMed] [Google Scholar]
- 56.Gayoso, A. et al. A Python library for probabilistic analysis of single-cell omics data. Nat. Biotechnol.40, 163–166 (2022). [DOI] [PubMed] [Google Scholar]
- 57.Lopez, R., Regier, J., Cole, M. B., Jordan, M. I. & Yosef, N. Deep generative modeling for single-cell transcriptomics. Nat. Methods15, 1053–1058 (2018). [DOI] [PMC free article] [PubMed] [Google Scholar]
- 58.Squair, J. W. et al. Confronting false discoveries in single-cell differential expression. Nat. Commun.12, 5692 (2021). [DOI] [PMC free article] [PubMed] [Google Scholar]
- 59.Love, M. I., Huber, W. & Anders, S. Moderated estimation of fold change and dispersion for RNA-seq data with DESeq2. Genome Biol.15, 550 (2014). [DOI] [PMC free article] [PubMed] [Google Scholar]
- 60.Lotfollahi, M. et al. Mapping single-cell data to reference atlases by transfer learning. Nat. Biotechnol. 10.1038/s41587-021-01001-7 (2021). [DOI] [PMC free article] [PubMed]
- 61.Sikkema, L. et al. An integrated cell atlas of the lung in health and disease. Nat. Med.29, 1563–1577 (2023). [DOI] [PMC free article] [PubMed] [Google Scholar]
- 62.Grant, R. A. et al. Prolonged exposure to lung-derived cytokines is associated with activation of microglia in patients with COVID-19. JCI Insight9, e178859 (2024). [DOI] [PMC free article] [PubMed] [Google Scholar]
- 63.Ritz, C., Baty, F., Streibig, J. C. & Gerhard, D. Dose–response analysis using R. PLoS ONE10, e0146021 (2015). [DOI] [PMC free article] [PubMed] [Google Scholar]
Associated Data
This section collects any data citations, data availability statements, or supplementary materials included in this article.
Supplementary Materials
Metadata for RPRA cohort. Dates are reported as days after COVID diagnosis.
Metadata for healthy volunteers.
CT scan data.
Lung fractions from initial CT scans.
Lung fractions from follow-up CT scans.
Cell-type percentages from flow cytometry analysis of BAL fluid.
Marker genes for integrated BAL scRNA-seq object.
Cell-type percentages for integrated BAL scRNA-seq object. Raw percentages and percentages scaled by the abundance of neutrophils are reported.
Input Spectra factors for both BAL and nasal scRNA-seq data.
Gene weights of the top 100 genes of Spectra factors for BAL scRNA-seq object.
Functional annotation for selected BAL Spectra programs and specific genes.
Output of DESeq2 analysis for integrated BAL scRNA-seq data.
Differential expression analysis of Spectra programs between profibrotic MoAM-1 and other macrophage subsets in patients with RPRA.
Output of DESeq2 analysis for MoAM-1 in integrated BAL scRNA-seq data between patients with resolving and patients with nonresolving RPRA.
Differential expression analysis of Spectra programs in immune cells from patients with resolving versus nonresolving RPRA.
Marker genes for integrated and re-annotated scRNA-seq object from Reyfman et al., AJRCCM, 2019.
Cytokine concentrations.
Marker genes for integrated nasal scRNA-seq object.
Output of DESeq2 analysis for integrated nasal scRNA-seq object.
Cell-type percentages for integrated nasal scRNA-seq object.
Gene weights of the top 100 genes of Spectra factors for nasal scRNA-seq object.
CBC panel data.
Data Availability Statement
Count matrices are available via GEO: BAL from healthy volunteers (accession no. GSE232616), nasal curettage from healthy volunteers (accession no. GSE232623) and BAL and nasal curettage from patients with RPRA (accession no. GSE232627).
Code is available at https://github.com/NUPulmonary/Bailey_Puritz_Senkow_RPRA_2024. ScRNA-seq data can be explored via the University of California Santa Cruz Cell Browser at https://www.nupulmonary.org/covid-19.


