

Abstract
A transtibial prosthetic interface typically comprises a compliant liner and an outer rigid socket. The preponderance of today’s conventional liners are mass produced in standard sizes, and conventional socket design is labor-intensive and artisanal, lacking clear scientific rationale. This work tests the clinical efficacy of a novel, physics-based digital design framework to create custom prosthetic liner-socket interfaces. In this investigation, we hypothesize that the novel digital approach will improve comfort outcomes compared to a conventional method of liner-socket design. The digital design framework generates custom transtibial prosthetic interfaces starting from MRI or CT image scans of the residual limb. The interface design employs FEA to simulate limb deformation under load. Interfaces are fabricated for 9 limbs from 8 amputees (1 bilateral). Testing compares novel and conventional interfaces across four assessments: 5-min walking trial, thermal imaging, 90-s standing pressure trial, and an evaluation questionnaire. Outcome measures include antalgic gait criterion, skin surface pressures, skin temperature changes, and direct questionnaire feedback. Antalgic gait is compared via a repeated measures linear mixed model while the other assessments are compared via a non-parametric Wilcoxon sign-rank test. A statistically significant ( ) decrease in pain is demonstrated when walking on the novel interfaces compared to the conventional. Standing pressure data show a significant decrease in pressure on novel interfaces at the anterior distal tibia (
 ), with no significant difference at other measured locations. Thermal results show no statistically significant difference related to skin temperature. Questionnaire feedback shows improved comfort on novel interfaces on posterior and medial sides while standing and the medial side while walking. Study results support the hypothesis that the novel digital approach improves comfort outcomes compared to the evaluated conventional method. The digital interface design methodology also has the potential to provide benefits in design time, repeatability, and cost.
Keywords: Prosthetics, Custom, Comfort, Digital design, FEA-based optimization, 3D printing
Subject terms: Rehabilitation, Mechanical engineering, Biomedical engineering
Introduction
The transtibial (TT) prosthetic interface, consisting of a compliant liner and structural socket, has not changed significantly for decades despite significant advances in technology and an ever-increasing number of persons with amputation1. Of the more than 30 million people living with amputation globally, lower-extremity amputation is the most common type, with TT amputation making up over 50% of all cases2. The comfort of the interface is a major factor in determining the wearability of the prosthetic device3. A poorly-designed interface can cause pain resulting from excessive pressure as well as various skin problems and tissue damage such as ulcers and abscesses4. Given that more than 57% of lower-extremity prosthetic users experience discomfort while using their liner-socket interface, there is a definite need for improvement5.
For the compliant liner component of the TT prosthetic interface, mass production practices are used across a distribution of fixed sizes. Custom liners designed from patient-specific data do exist, but currently require a separate design and fabrication process that is expensive and time-consuming6. The conventional process of designing a TT prosthetic socket consists of creating a modified plaster cast and fabricating test (or “check”) sockets by wrapping thermoplastic material around the mold7. Modifications to the socket to improve comfort after testing are conducted by artisanal practice, not grounded in a clear scientific rationale, nor easily repeatable for subsequent sockets. This process is non-quantitative and dependent on the skill of the prosthetist8. Due to the time requirements and cost of conventional socket design, patients are limited in what they can test and modify during the check socket period. Every change has to be conducted sequentially and extensive trial-and-error is involved. Commonly, prosthetists attend patients at a regional level, making these trial-and-error processes result in high logistical costs to the patient. Active prosthetic wearers need new sockets every 2–4 years, and typically this entire process has to be repeated for every new socket9. Individual socket preferences, such as regions of sensitivity not reflected in the skin geometry, must be manually reapplied to every new socket. Indeed, the inefficiency of the process can result in periods where a patient’s mobility is limited due to not having a well-fitting socket.
Alternative methods to improve the design and fabrication process of the TT liner-socket interface have been explored. Surface 3D scanning has become a common replacement for the initial plaster casting step, adding a digital design step to the process10,11. Some sockets combine 3D surface scanning with on-the-fly adjustments to optimize fit12. However, such surface scanning approaches fail to capture critical internal anatomy such as bone geometry and soft tissue depth enabled by, for example, magnetic resonance imaging (MRI) or computed tomography (CT)13. There are also new methods that fabricate the socket directly on a patient’s residuum, such as the Ossur Direct Socket method14. Direct methods are fast and accurate, but the entire process has to be repeated for each new socket, post-fab modification is limited, and the quality of the socket depends on the skill of the prosthetist. 3D printing is also an up-and-coming way to rapidly and accurately fabricate prosthetic sockets15,16. There are both commercial and research efforts to design and fabricate custom liners, but these are expensive, time consuming, and often suffer from low accuracy due to the use of cast molding and wrapping for fabrication6. Research exists on liners that also contained integrated sensors, but none have shown the ability to capture below-the-surface anatomical features that may be critical to liner and socket comfort17,18. Thus, the most common liners are off-the-shelf items that are not specifically shaped to a patient’s residual limb. In addition, the prosthetic interface can be a financial burden on people with amputation. Cost information of the interface specifically is sparse, as it depends on the level of amputation as well as the difficulty of fit. As a broad range, lower-extremity prosthetic legs can cost between $3000 to $24,000 depending on the type of device9,19. Often insurance partially covers the cost of a new prosthetic leg, forcing persons with amputation to cover the remaining cost differential.
The goal of this trial is to evaluate the efficacy of a digital design framework based on medical imaging and physics-based modeling. The design framework aims to increase interface satisfaction, reduce injuries that result from improper fit, and introduce time, cost, and accessibility benefits to the interface design process. We hypothesize that the novel digital approach will improve comfort outcomes compared to conventional methods of liner-socket design and fabrication. To evaluate this hypothesis, we compare novel and conventional interfaces on 8 persons with transtibial amputation across four assessments: 5-min walking trial, thermal imaging, 90-s standing pressure trial, and an evaluation questionnaire. Comfort outcome measures include antalgic gait criterion as a measure of pain response, skin temperature changes, skin surface pressures, and direct questionnaire feedback.
Results
Evaluation of the prosthetic interface design framework was accomplished by analyzing kinematic, pressure, thermal, and questionnaire data.
Interface design results
Transtibial prosthetic interfaces were successfully designed and fabricated for nine limbs for eight subjects (one bilateral), details given in Table 2. In order to achieve the best initial fit, 3 check sockets were designed and fabricated for the subject to test and compare. The cumulative time, from imaging to fabricated prosthetic liner and 3 sockets averaged 1 week per subject, with an approximate time breakdown in the Methods Section. For 5 of the 9 limbs minor adjustments had to be made to the initial socket design, requiring a reprint of the socket and around 2 days extra time. Biomechanical limb reconstruction and finite element analysis (FEA) design optimization times can be improved as the algorithm matures and with more powerful computational hardware. The fabrication times for both liner and socket are affected by the outsourcing of production and shipping, and can reasonably be expected to decrease through in-house means.
Table 2.
Information about the subjects included in this clinical trial.
| Subject | Location | Birth year | Sex | Height (m) | Weight (kg) | Side | Fem. Len. (m) |
|---|---|---|---|---|---|---|---|
| 1 & 2 | US | 1964 | M | 1.83 | 77 | Bilateral | 0.42 |
| 3 | US | 1971 | M | 1.90 | 84 | Right | 0.49 |
| 4 | US | 1990 | F | 1.68 | 55 | Left | 0.46 |
| 5 | US | 1975 | M | 1.78 | 75 | Left | 0.44 |
| 6 | MX | 1977 | M | 1.70 | 71 | Left | 0.37 |
| 7 | MX | 1979 | M | 1.72 | 97 | Right | 0.44 |
| 8 | MX | 1961 | M | 1.80 | 88 | Right | 0.46 |
| 9 | MX | 1966 | M | 1.65 | 68 | Left | 0.38 |
A lower-body leg MRI for this study cost around $700 and a CT scan $400. Each liner and check socket was $100, making the total cost per subject $1000 to $1500 for a comfortable interface. This represents at least a 50% reduction in cost compared to traditionally designed interfaces.
Kinematic results
Kinematic data was collected using a markered motion capture system and instrumented treadmill. Antalgic gait is defined as the percent of overall stride in stance, given by (1)20. Stride is defined as the time between consecutive heel strikes on one side, and stance is defined as the time between heel strike and the immediately following toe off on one side. Per-subject averages for antalgic gait percentage are shown in Fig. 1. Subjects 6-9 walked at the slower speed. For the bilateral subject, kinematic data for both legs were combined since it does not make sense to look at both limbs in isolation, as longer stance on one side would result in shorter stance on the other. Combining datasets provided an indication of how much overall time each subject spent in the stance phase. Individual average and standard deviation values for antalgic gait are given in Table B1 in the supplementary materials. There is a statistically significant difference  in means between the two groups of subjects walking at different speeds (1 & 2, 3, 4, 5 vs. 6, 7, 8, 9). However, this result is expected for reasons discussed in the Kinematic Evaluation subsection in Methods. We are not interested in the difference in antalgic gait percentage resulting from speed, but in the difference resulting from the different prosthetic interfaces. The mixed model interaction between type (difference in the mean conventional vs. mean novel) and speed gives a non-statistically significant
  , meaning the data for the two speeds can be pooled with a model adjustment for speed. Neither dataset was normal using a Shapiro–Wilk normality test with significance level of
  . The repeated measures model results give a two-sided
  at a significance level of
  , indicating a significant difference in medians between conventional and novel antalgic gait. The model gives a pooled difference in medians of
  , with more time being spent in stance on the novel interfaces. For the population, the median percent of stride in stance is
 on conventional interfaces and
 on novel interfaces.
Fig. 1.
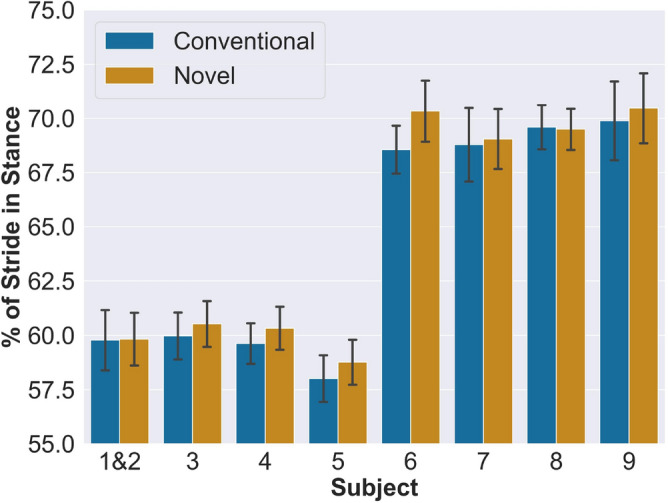
Per-subject antalgic gait averages for conventional and novel interfaces. Subjects 6–9 walked at slower speed.
Another metric of interest is the minimal clinically important difference (MCID) of the novel interface compared to conventional. As subjects 1 & 2, 3, 4, 5 and subjects 6, 7, 8, 9 walked at difference speeds, separate calculations of MCID were performed for the two groups. MCID was calculated using a distribution-based method with effect size of 0.2 for each group. Table 1 shows the subject antalgic gait average values and the MCID results.
Table 1.
Evaluation of clinically important difference for antalgic gait.

|

|
|||||||
|---|---|---|---|---|---|---|---|---|
| 1 & 2 | 3 | 4 | 5 | 6 | 7 | 8 | 9 | |
| Conventional | 59.8 | 60.0 | 59.6 | 58.0 | 68.6 | 68.8 | 69.6 | 69.9 |
| Novel | 59.8 | 60.5 | 60.3 | 58.8 | 70.3 | 69.0 | 69.5 | 70.5 |
| Difference | 0.05 | 0.56 | 0.7 | 0.76 | 1.78 | 0.27 | -0.10 | 0.58 |
| Result | No change | Improve | Improve | Improve | Improve | Improve | No change | Improve |
MCID was calculated for subject groups (1 & 2, 3, 4, 5) and (6, 7, 8, 9) based on their different speed treatments. Units are in % stride in stance.
Lower limb joint angles are also a metric of interest in gait kinematic evaluation. A comprehensive table of joint angles is provided in Fig. A1 of the supplementary materials. As residuum pain due to the prosthetic interface as a measure of comfort is the primary concern in the gait portion of this study, more work is needed to connect joint angle change to residuum pain.
Thermal results
Thermal image data was captured using a FLIR thermal camera before and after walking trials for both conventional and novel interfaces. None of the four thermal imaging directions (anterior, posterior, medial, lateral) showed a significant difference in post-walking overall mean surface temperature between the evaluated prosthetic interfaces. Average values by direction for conventional and novel interfaces are given in Tables B2 and B3 in the supplementary materials.
The same calculations as for overall limb temperature were performed for 6 regions of interest (ROIs), and conventional and novel datasets were compared. No location shows a significant difference in temperature change from reference between the two prosthetic interfaces.
Pressure results
Pressure evaluation used Tekscan force-sensitive resistors applied to 6 different locations on the residual limb. Subjects performed 30s standing on their affected leg, 30s on both legs, and a final 30s back on their affected leg. Normalized pressure values at a specific location were normalized by the maximum pressure value across both conventional and novel interfaces at that location over the 30-s collection period, resulting in a scale from 0 to 1. More details are given in the Pressure Evaluation section of Methods. A significant change in standing pressure across subjects was found at the anterior distal tibia (ADT). Figure 2 shows these ADT normalized pressure values for both interface types by subject. Medians for pressure at the ADT location are 0.886  for the conventional interface and 0.467
  for the novel. Novel interfaces reduced median pressure relative to conventional by
  in normalized units with a
  . No significant difference was found at any of the other 5 locations. Subject averages for the ADT location are given in Table B4, and p-values for the signed-rank test for all 6 locations are given in Table B5 in the supplementary materials.
Fig. 2.

Anterior distal tibia normalized pressure values for conventional and novel interfaces, per subject.
Questionnaire results
Individual questionnaire score results are shown in Fig. 3. An improved overall pressure score during sitting on the novel interface was found with a p-value of  . This response has an median score of 52
  , with an average score above 50 favoring the novel interface. Neither standing nor walking showed a significant difference in score for overall fit or pressure.
Fig. 3.

Questionnaire scores for sitting, standing, and walking pressure on each limb. The questions asked were variations of “Rate the pressure you feel in the novel interface compared to your conventional interface when you are sitting/standing/walking”, depending on the activity the patient had just performed. A score of 50 indicates that the subject felt equivalent pressure in both the novel and conventional interface. A score greater than 50 indicates that the subject felt that the novel interface had a preferable pressure level and distribution than the conventional interface, whereas a score below 50 indicates that the conventional interface had preferable pressure compared to the novel interface.
The posterior and medial sides of the residual limb demonstrated significant reductions in pain while standing, and the medial side while walking on the novel interface. These region-specific questions were scored on a scale of 1–5, with 1 indicating least comfortable and 5 indicating most comfortable. During standing, the posterior region had a median of 4  with
with  , and the medial region had a median of 4
  with
with  . During walking, the medial region had a median of 4
  with
with  . Graphs showing the individual scores of these results are shown in Figs. A2 and A3 in the supplementary materials.
Qualitatively, one subject said that “overall [I am] impressed with the novel socket...the socket fit well and was certainly comfortable enough to stand and walk in.” Another subject described the socket shape as “really close” and said the primary discrepancy was in the difference in material between the novel and conventional. The subjects as a whole expressed a positive outlook for the design method, and were especially excited about the reduction in design time the method may provide. The custom liners also fit well, although the thickness of the liners caused some discomfort during knee bending due to liner material bunching up behind the knee.
Discussion
The evaluated digital design framework introduces benefits to the TT interface design process by capturing the geometry of bone and tendon together with skin surface geometry. Further, the framework incorporates finite element analysis (FEA) to model both the donning of liner and socket components onto the residuum, as well as the functional use case of standing. The ability to define socket and liner shapes based on the unique underlying anatomy of each person allows for a more detailed interface customization. In addition, to optimize liner-socket shape using different anatomical loading scenarios evolved by FEA iteration is a novel development that has not been previously realized in prosthetic interface design.
This study represents the first clinical trial that holistically evaluates a liner-socket design methodology comprising non-contact imaging (MRI/CT) and FEA computation. Taken as a whole, the results of the trial support the hypothesis that the novel digital framework improves comfort outcomes compared to the evaluated conventional method. In our analysis, we hold antalgic gait and questionnaire data to greater weight because the former has extensive previous research and the latter is a direct indication of interface comfort from subject testimony. The antalgic gait metric results suggest that pain on the affected limb was reduced when subjects wore the novel interfaces compared to the conventional interfaces20. Subjects spent more time in stance during each stride when using the novel interfaces compared to the conventional interfaces (as Fig. 1 shows), suggesting a pain reduction when using the novel interfaces21. The results also show that 6 of our 8 patients show clinically important difference in favor of the novel interface, at an effect size of 0.2. Therefore it is fair to assume that the novel interface results in pain reduction beyond basic gait variability. These results are important because chronic residuum pain can lead to further injury and may cause the prosthetic wearer to abandon their device22. The fact that differences in speed were not shown to play a significant role in the effect of conventional vs. novel interfaces on antalgic gait percentage suggests that the digital method may be effective across different walking speeds.
The questionnaire results, while the least objective of the metrics, we feel provide the best insight into how each subject experienced the novel versus conventional interfaces23. The questionnaire data shows a significant reduction in overall pressure experienced while sitting with the novel interface. Further, subjects reported a significantly reduced pain response while standing on the novel interface, specifically on the posterior and medial regions of the residual limb. No significant differences in comfort were reported for dynamic walking between novel and conventional interfaces. Qualitative feedback was also promising, with patients generally excited by the digital design method. The only concerns about the novel socket interfaces from subjects during qualitative feedback were with regard to liner bunching during knee flexion and their personal unfamiliarity with the sleeve suspension system and socket material. In future work, the liner concern can be addressed by implementing a variable-thickness liner algorithm based on skin strain data during knee flexion24. To overcome the unfamiliarity, either long-term acclimatization to the novel suspension and socket or matching these two variables across interfaces could produce a more accurate subjective comparison between conventional and novel interfaces. This is challenging as the suspension types vary across subjects (pin lock, vacuum, sleeve), and each type carries specific physical integration requirements. With more time to acclimate to the novel interface, further improvements to the digital design method, and fabrication of carbon sockets from the framework, further improvements in fit may be achievable.
For the pressure data, the anterior distal tibia (ADT) and fibula head (FH) were the primary anatomical regions of concern because these areas comprise bony protuberances that often cause pain for TT prosthetic users. The successful reduction in pressure at the ADT suggests an improved load distribution away from this sensitive area, which is an important goal when optimizing interface fit. In a well-fit socket, it is especially important to divert load bearing away from the ADT to prevent the wearer from “bottoming out” in the socket.
We were not able to reduce pressure at the fibular head in this trial, but also did not see any negative responses from subjects about that region. The FH is more variable due to the fibula bone varying with type and level of amputation. Distal amputations often retain a significant portion of the fibula but have more soft tissue to distribute load, whereas proximal amputations may have a small or absent fibula but increased load on the bone. While pistoning, or relative movement between the limb, liner, and socket, due to shear deformation while standing is captured in the simulation, pistoning while walking is not and can induce pressure increases in the vertical direction. None of the subjects in this study had chronic pain at the FH, and future studies may look at design solutions at this location for those with significant fibular pain. Only relative pressure could be measured between conventional and novel interfaces, a key limitation of the hardware used in the study for pressure measurement. In addition, study sensors were prone to shift, especially when the liner was rolled onto the limb. This donning action may have potentially caused wires to short, and thus steps were taken to insulate the leads as much as possible.
No difference in post-walking skin surface temperature between conventional and novel interfaces was found. Previous research has found correlations between activity, skin surface temperature, and discomfort for persons with lower-extremity amputation25,26. There is an established connection between heat, friction, and the occurrence of skin afflictions, and people with lower-extremity amputation already experience a higher incidence of pressure sores27,28. We also did not find a significant difference in average skin surface temperature compared to reference resulting from either conventional or novel interfaces. It is possible that the walking trials in this study were not sufficiently demanding to cause significant skin temperature change. It could also be the result of circulatory issues that commonly affect persons with lower-extremity amputation, or other underlying effects29. Heat dissipation properties of liner material, liner-skin friction, and sweat effects may have also played a role.
There are several ways to further improve the digital design framework evaluated in this study. The biomechanical model could be further personalized by measuring individual soft tissue mechanical properties. Moreover, the mechanical properties used in this study have been obtained using indentation force-displacement data, but it has been recently demonstrated that this data is insufficient for obtaining a unique hyperelastic parameter set30. In addition to geometrically optimizing the socket pressure map, compliance can be introduced to the socket wall either through varying material properties or by structural changes such as lattice structures8,31. Compliance mapping can be a function of soft tissue depth, as well as commonly known pain points. The FEA could also be made more complex by introducing additional simulations such as heat transfer and dynamics.
In addition to physical health benefits, the presented digital framework has the potential to improve prosthetic accessibility by decreasing the time and cost necessary to achieve a comfortable prosthetic interface. In terms of time efficiency, the method provides several advantages over the traditional socket design process. The MRI or CT scan of the residuum takes around 1 h, after which the initial interface design can be conducted without requiring patient time. The design computation takes 4–6 h and test socket fabrication an additional 8 h. Therefore, check socket design and fabrication can be completed in less than 24 h, requiring only 1 h of in-office time from the patient for the imaging and 1 h for fitting. Design and fabrication time in this study were mainly limited by the outsourcing of fabrication and shipping times. Iteration to achieve a comfortable final socket design requires time from the patient and prosthetist, but every change to the geometry is saved in the patient’s unique digital profile. This means that the time for the first interface may reach a week, but the time for subsequent interfaces will be reduced, as fewer iterations will be required given the memory provided by the patient’s digital profile. In addition, multiple variations of a socket design can be printed simultaneously, allowing direct comparison and better patient feedback. This is not possible with traditional socket manufacturing. After a few definitive sockets have been designed and used across many years, a patient’s digital profile will reach a mature state where it may be possible to make comfortable interfaces immediately from an updated MRI/CT scan without additional test socket evaluation. Such a digital profile memory may significantly reduce the time to design a successful interface compared to the conventional process, which takes 2–4 weeks, and in which the entire design process must be repeated every time a new definitive socket is manufactured32.
In total, the cost to reach a comfortable check socket was between $1000 and $1500 per subject including imaging. This is significantly less than the cost of a traditionally made interface, even with additional costs for designing a carbon socket from the final check socket19. Bringing down cost is critical to improving accessibility to prosthetic care, and consolidated production and improvement in 3D printing capabilities promise further reductions in the price of a comfortable prosthetic interface. Future work will be needed to gain an accurate measure of the per-interface cost at a production-level scale over a large subject population. Furthermore, outside of design and fabrication costs, the reduced in-office and travel time can result in secondary cost benefits to patients, especially those who live far from prosthetic clinics.
The current study does not contain enough data to claim improved repeatability of the framework across a large subject population, which we recognize is a critical aspect of accessibility. We anticipate that the quantitative and computational aspects of the framework paired with advanced manufacturing will lead to improved repeatability over artisanal conventional methods. An aim would be to evaluate this in a future study.
Our ultimate goal is to implement the digital framework in the field to improve accessibility in areas with few brick-and-mortar clinics or prosthetists. This experiment was purposefully conducted in part in Guadalajara, Mexico in order to begin field testing the framework implementation. Patient data was acquired and pre-processed by the research team in Mexico and exported digitally to the Boston site for digital design work to be conducted. Check liner and sockets were produced stateside, but could equally be produced in country with adequate equipment. Testing was then conducted at the Mexico site in collaboration with the prosthetics facility there. New improvements in technology will help accelerate deployment in the field. Portable CT scanners using cone beam technology can now be used for residual limb imaging on a mobile vehicle, and the digital automation of liner-socket fit will ultimately enable interface design and fabrication to be conducted completely remotely. Conventional socket comfort is not only determined by the availability of the prosthetist but also by their skill, and this is an inequity that our method aims to mitigate by providing high-quality personalized care through the centralization of prosthetic interface design and manufacture, with residual limb scanning and interface fitting still conducted locally. Given that liner-socket design and fabrication need not be conducted at a clinic, a mobile prosthetic delivery service would only require a CT scanner and simple tools required for prosthetic fitting. Such a mobile prosthetic service would remove much of the burden of travel from those who lack easy access to brick-and-mortar clinics33. The mobility of the clinic may also allow for a more consistent follow-up paradigm for prosthetic care delivery.
In this study, a novel digital interface design framework is used to create custom prosthetic liners and sockets for n=8 subjects consisting of 9 limbs. This method uses MRI/CT 3D imaging to construct a computational limb model from which a liner and socket are designed and optimized using physics-based FEA modifications. These interfaces are compared against conventionally-designed ones in a clinical trial that involves kinematic, thermal, pressure, and questionnaire assessments. The novel interfaces are shown to significantly reduce antalgic gait, reduce pressure at the anterior distal tibia, and improve overall comfort during quiet standing. Subjects also reported the novel interfaces reduce pain on the posterior interface region while standing and medial region while walking. Furthermore, there are no aspects in which the novel interfaces are shown to have lower efficacy than the evaluated conventional interfaces. Qualitative feedback from subjects shows positive response to the fit of the novel interfaces and general optimism regarding implementation of this method. In addition to its potential health benefits, the digital design framework can reduce the time and cost of prosthetic interface design, making it a powerful tool in the mission to democratize high-quality prosthetic care.
Methods
The experimental protocol consisted of two primary components: design and evaluation. The design of the novel prosthetic interfaces in this paper utilized an improved version of the framework proposed by Moerman et al.34. Figure 4 shows an overview of this modified framework. In this paper, framework will refer to the entire process from imaging to fabrication (steps A–L in Fig. 4). Algorithm or design algorithm will refer to the interface design process within the framework, steps D–K in Fig. 4. The evaluation took place both in the Biomechatronics Lab at the MIT Media Lab (75 Amherst St., Cambridge, MA, USA) and in the Biomechatronics Lab at Tecnológico de Monterrey (Guadalajara, MX).
Fig. 4.

Map of digital prosthetic interface design framework to evaluation, based on Fig. 3 in Moerman et al., modified and updated34. (A) 3D imaging via MRI or CT. For each subject, a series of medical images covering the complete lower leg and part of the upper leg were obtained. Parameters for imaging are given in Table B6 in the supplementary materials. (B) Biomechanical model reconstruction through segmentation. Components including tibia, femur, patella, patella tendon, and skin were segmented and reconstructed separately and assembled based on their actual position and orientation. (C) Digital image correlation (DIC). Details given in the Digital Image Correlation subsection. (D–E) Preliminary socket and liner design. A direction for body weight loading based on the mechanical axis of human standing was defined. The model was reoriented with this load line parallel to the z axis. Preliminary liner and the socket designs were based on the morphology of the biomechanical limb model, without fitting pressures applied. (F) Pressure region definitions for the socket and the liner design. The liner contains four pressure regions: distal, lower leg (below-knee), knee (around-knee) and upper leg (above-knee) The socket contains four regions: distal, fibular head, patellar tendon, and residual (rest of socket). Details given in the digital design subsection. (G–J) Finite element simulation and optimization loop. The aim was to make the load distribution more even, maximize load bearing around patella bar region, and minimize pressure around sensitive regions after applying body weight. Details given in the digital design subsection. (K) Further modification such as mesh manipulation and liner extension. The modifications were based on subject fitting feedback and measure quadriceps data. (L) Fabrication by 3D printing. (M) Clinical evaluation. Kinematics, pressure in the interface between the skin and the liner, thermal images, and questionnaires were collected and to evaluate comfort of the interface.
Each primary component consisted of several steps, with the structure given as follows, in order of performance with approximate time requirements:
- Design
- Imaging (MRI/CT) (1 h)
- Biomechanical Model Reconstruction (3 h)
- Liner Design (2 h)
- Liner Fabrication and Measurement (2 days)
- Socket Design (4 h)
- Fabrication and Fitting (1 week)
- Evaluation
- Kinematic (2 h)
- Thermal (Concurrent with Kinematic)
- Pressure (1 hr)
- Questionnaire (1 hr)
On the design side, only the Imaging and Fitting parts require in-person time from the patient. Liner and socket fabrication times include shipping, and fitting depends on the availability of the patient and prosthetist.
Subject data
Eight subjects with nine transtibial residual limbs were recruited to participate in this study. Subjects were eligible for participation if they were more than 2 years removed from amputation, K3 or K4 activity level, able to safely undergo MRI or CT imaging, and satisfied with the fit and comfort of their conventionally-designed prosthetic interface to avoid bias. Subject details are given in Table 2. Subjects at the Cambridge, MA, USA site were consented following the MIT Committee on the Use of Humans as Experimental Subjects protocol number 1101004280, initial registration date 10/02/2011 and most recently renewed on 17/02/2022. Subjects at the Guadalajara, MX site were consented under the associated Mexico protocol number PR2021-01 approved by Comité de Etica en Investigación del Hospital la Misión S.A.de C.V on 19/02/2019. The trial is registered on ClinicalTrials.gov, registration number: NCT03544853; Registration Date: 04/06/2018. All experimental methods were performed in accordance with the relevant guidelines and regulations set forth by the oversight boards at both sites. All subjects signed an informed consent form. For the first fitting, three digitally designed sockets were made for each subject with slightly differing pressure maps. The subject tried them on and gave feedback, if any, on areas to be improved. If changes needed to be made to address pain areas, modifications based on direct feedback were made to the patient-specific model and stored in their unique algorithm so the fix is retained for future sockets, reducing future iteration. A modified socket with incorporated changes was printed and tested. Once a comfortable fit was established, that socket formed the final socket used for subsequent testing. A certified prosthetist assisted in determining proper walking alignment to attach the novel interface to the patient’s existing foot/ankle system. The subject was allowed to walk using the novel interface for a minimum of 10 min before any data collection. Suspension, or the method of securing the interface to the limb, was achieved using a 3 mm-thick suspension sleeve from Alps South LLC (St. Petersburg, FL).
Imaging
Both MRI and CT imaging were both tested with the framework in an attempt to determine the best option, and both were deemed acceptable. Thus, each was employed based on device availability and medical patient-specific recommendations.
MRI protocol
MRI was conducted at the imaging center at the MIT McGovern Institute on a Siemens Magnetom 3 Tesla machine (Siemens Medical Systems, Erlangen, Germany) using a Siemens 3T body matrix coil. Scan parameters are given in Table B6 in the supplementary materials. MR-SPOT markers (PinPoint #187, Beekley Medial, USA) were placed on the residuum, 3 along the tibia crest and one at the fibular head for subsequent digital image correlation alignment. MRI was performed with the patient lying supine, the affected side raised on a cushion with a knee bend that aimed to match a natural knee bend when standing unsupported. The residuum was contained in the body matrix coil. Skin marker was used to temporarily locate the position of the markers on the residuum for subsequent digital image correlation, discussed in the Digital Image Correlation section.
CT protocol
CT imaging was performed at the Centro de Imagen Diagnóstico, Guadalajara, Mexico on a Siemens Somatom Definition AS+ (Siemens Medical Systems, Erlangen, Germany). CT imaging was done with the patient lying on their back, the affected leg slightly raised on a cushion under the thigh to keep the residuum elevated, and a slight bend in the knee that aimed to match a natural quiet standing knee bend. Care was taken to ensure the residuum was not in contact with the bed to avoid unwanted skin deformation. The imaging process took around 1 h to complete.
Digital image correlation
The positioning of the limb during MRI resulted in deformation of the soft tissue due to contact with the coil. In order to correct this to provide a more accurate representation of the limb while standing, digital image correlation (DIC) was used. Image sets captured using CT did not require the DIC process because the soft tissue was not significantly deformed during capture. In the MA site, DIC imaging took place immediately (same-day) after MRI. The DIC protocol used a similar equipment and process as laid out in Solav et al.35. The camera rig consisted of 21 cameras in 17 stereo pairs, calibrated by a high-precision 3D-printed calibration object containing 700 black squares on a white background. The rig was placed underneath a table with a hole in the surface, and the calibration object was placed through the hole so that it was positioned in the middle of the rig. The residual limb was randomly speckled with a black-on-white pattern with an average speckle size of 1.8mm using temporary tattoo ink (ProAir, USA). To allow for spatial alignment between the MRI-derived surfaces and DIC- derived surfaces, the locations for the MRI skin markers were highlighted by manually drawing circles using black surgical marker. The patient sat on the table with their limb through the hole, and image sets were captured at relaxed, knee flexion, and knee extension states.
Limb model reconstruction
All image processing and model reconstruction were performed in Matlab (R2023a, Mathworks, USA). Axes definitions are shown in Fig. 5.
Fig. 5.

Overview of the limb 3D biomechanical model creation. (A) Image section planes. (B) Contouring + levelset processing. Tibia shown as example. (C) Surface model generation, with 2D triangle elements. (D) Registration marker reconstruction in MRI model. (E) DIC skin alignment. Blue points are MRI marker positions and red points are matching DIC locations. (F) Model after MRI and DIC skin registration. (G) Final biomechanical model with MRI skin replaced by DIC skin and with local axes.
Both MRI and CT processes resulted in transverse sections of the limb. In order to stitch these sections together to create a three-dimensional representation of the limb, a framework described by Moerman et al. was followed using the open-source GIBBON toolbox34,36. Contours for each major component were identified and reconstructed into three-dimensional surfaces using a Levenberg–Marquardt least-squares optimization to ensure that nodes on the resulting surface were as close as possible to nodes on the contours. The surfaces were then reoriented so that the main axis of the femur matched the positive (upward) z-axis. The positive (forward) x-axis was defined by finding the distance between the geometric centroids of the patella and femur in the transverse plane. The positive y-axis was the cross product of the other two axes. The final step in feature generation was to reconstruct the patellar tendon attachment points to the tibia and patella in order to ensure good contact with no gaps, as the tendon was often difficult to segment in the images. This was done by using the clearest segments, usually from the middle of the tendon, and then defining connection regions on the patella and tibia. The surfaces were then lofted from the segments to the bones to create the tendon mesh. For MRI image sets, the DIC skin surface replaced the MRI skin surface in the biomechanical model. DIC image processing used the open-source Matlab toolbox MultiDIC37. For each stereo image pair, cross-correlation between the images was performed. A subset size of 30 pixels and spacing of 20 pixels was generally used, with adjustments made depending on the quality of the speckle. After all pairs were processed, the image sets where the markers were visible were selected, and the centroids of the marker positions were computed. The correlated points from all the stereo pairs were 3D reconstructed and combined into a single 3D point cloud. This was then transformed using an iterative closest point method so that the skin marker locations matched the locations of the MRI markers on the surface model. A triangular mesh was generated using Rhinoceros5 (Rhino3D, Robert McNeel & Associates, USA). Figure 5 illustrates this process and a final limb model.
Digital design
The socket and liner were designed virtually based on the geometry of the residual limb model. Figure 6 shows a detailed view of the design algorithm (steps D to K of Fig. 4).
Fig. 6.

Detailed look at the interface design algorithm. (D) Interface model generation. (D-a) Load line direction indicated by the central red line. (D-b) Socket cutline control points. (D-c) Cutline refinement. Blue line represents the cutline on the mesh, red line is the final smooth spline. (E) Input geometric meshed model for FEA. (F) Pressure region definitions for the socket and the liner design. (G-J) Finite element simulation and pressure optimization. (K) Further modification. (K-a) Final liner model with the top extruded to the middle of the thigh. (K-b) Extended distal tibia region. Red shows the extended region, and yellow and green show the taper region to smoothly integrate into the socket. (K-c) Extended fibular head region. Colorations are the same as for K-b.
The model was cropped 10mm from the most proximal node on the skin or femur, and the structures were enclosed. The model was reoriented so that the defined load direction was collinear with the Z-axis. All sockets in this trial used a loading direction defined so the load passed vertically from the approximate center location of the hip joint through the center point of the knee, shown in Fig. 6 Step D-a. The model was then ready for defining preliminary liner and socket geometry, as follows:
The liner inner surface was identical to the outer surface of the skin. The liner outer surface was offset from the liner inner surface by 7 mm. The socket inner surface was defined as the liner outer surface below the cutline defined thereafter. The socket outer surface was then offset from the socket inner surface by 8 mm.
The socket proximal cutline was generated based on 14 key points whose positions were defined according to bone and tendon points projected onto the skin, shown in Fig. 6 Step D-b34. Each point was individually controllable, so subject-specific alterations could be made to the cutline. For example, some patients suffer from the posterior edge of the socket digging into their leg during knee flexion, so the rear edge would be lowered in the socket model. Patients with shorter residuums often experience more medial/lateral instability, and therefore the medial and lateral lobes of the cutline could be raised. The cutline was defined on the socket surface by ray tracing a path on the skin surface mesh that intersected all 14 points. This composite mesh curve was used to divide the skin surface into two regions, that within the socket and that without. The face boundaries around the curve were then adjusted to create a smooth spline, and the new mesh was refined to fix any mesh elements with sharp corners touching the spline, as this could lead to computational divergence. The liner and socket surfaces were then capped to create watertight bodies, and the entire model (soft tissue + tendon + liner + socket) was volumetrically meshed with tetrahedral elements using TetGen38. Bones were modeled as rigid voids in the soft tissues. The material models and parameters assigned to each component in the finite element simulation are given in Table B7 in the supplementary materials. Material parameters for the silicone liner were computed using uniaxial tension and compression tests on a FreeLoader material tester39. Tension tests were performed using dogbone samples (65mm total length, 10mm overall width, 20mm gauge length, 3.5mm gauge width, 3mm thickness) and compression with cylindrical samples (30mm diameter, 30mm height). The characterization was based on a hyperelastic second-order nearly-incompressible Ogden model. Soft tissue and tendon material properties were approximated from literature, and socket material property parameters approximate a rigid material34,40,41. The rigid approximation was needed as the framework required multi-generational materials in order to achieve stress-free state during finite element analysis design34,42.
Finite element analysis (FEA) was performed using FEBio solver through the GIBBON toolbox36,43. The simulation consisted of liner and socket donning followed by standing loading. The boundary conditions are visualized in Fig. 7: the bones were fully fixed, the top surface was fixed only in the z-direction, and the skin outer surface was designated as the surface to which pressure was applied.
Fig. 7.

The boundary conditions of the biomechanical model for FEA. (a) The fixed nodes on the bone surfaces. (b) z-fixed nodes at the proximal surface of the model. (c) The skin surface, on which pressure is applied.
Next, pressure regions and target values were set for both the liner and socket. We varied target pressure spatially based on anatomical landmarks in order to relieve pressure at common pain points. The liner was divided into 4 regions of distinct pressure: distal, lower leg, knee, and upper leg. The socket was also divided into 4 regions: distal, fibular head, patellar tendon, and residual (everywhere else within the socket). These are shown in Fig. 6 Steps F-a and F-b. However, more regions of pressure relief were often added to the socket due to its rigid nature, such as at the anterior distal tibia or at the tibial flair. These regions could be added and modified uniquely for each patient. Pressure target values were set as multiples of a base value of 15 kPa34. For liners, optimal multiples were 3.5x distal, 3.5–6.5x gradient lower leg, 7.5x knee, 6.5x upper leg. For sockets, optimal multiples were 0x distal, anywhere from 2.6–4.2x patellar tendon, and anywhere from 0.6–2.0x residual. In our design philosophy using multi-generational materials, a given set of socket/liner fitting pressure values corresponds to a specific geometry/volume of designed socket.
Each iteration of the FEA process consisted of 5 steps, described in detail in Moerman et al.34:
Liner fitting pressures were applied gradually to the skin surface. Liner and socket material properties were turned off to allow for stress-free deformation. The deformed skin geometry then defined the initial liner surface for the next step.
The liner thickness and material properties were turned on. The pressure applied to the skin was reduced gradually, with pressure then being exerted by the liner constraint and increasing progressively. This simulated the donning of the liner.
Socket fitting pressures were applied to skin surface. This deformed the skin, and the liner deformed in tandem due to it retaining its elastic properties. Socket material properties was kept off to allow for stress-free deformation. The deformed geometry defined the socket geometry.
The socket thickness and material properties were turned on. The pressure applied to the biomechanical model was reduced gradually, with pressure then being exerted by the socket constraint and increasing progressively. This simulates the donning of the socket.
Body weight load was applied in the z-direction to the entire model to simulate standing load. Force equivalent to body weight was distributed over the nodes of the socket bottom in the positive Z-direction. The equivalent body weight included two parts. The first was from the force generated due to socket donning, which was distributed over the nodes around the socket bottom at the initial instant to prevent concentrated loads. This is termed the balance force. The other was from the difference obtained by subtracting body weight from balance force, which was then distributed over the same nodes and increased gradually until reaching the maximum.
One iteration was run first to generate the liner geometry. The liner needed only one iteration of FEA because liner fitting pressures were constant, whereas the socket fitting pressures updated with each iteration of FEA. The liner was then 3D printed using large-scale rapid liquid printing and measured to find the actual thickness44. The liner thickness was updated in the computational model, and then a full 3 iterations of FEA were run to generate the socket. In each iteration for socket generation, threshold-based updated socket fitting pressures were calculated based on the output socket pressure map from the previous iteration. The updated geometry was then imported as the input for the next iteration. This results in one major change, shown as the difference between (a) and (b) in Fig. 8, followed by two smaller refinements, shown by (c) and (d). Three iterations were determined through repeated experimentation to give the best geometrical socket fit in a reasonable amount of computational time.
Fig. 8.

(a) Load before body weight is applied (preliminary geometry). (b) Load after 1 iteration of FEA. (c) Load after 2 iterations. (d) Load after 3 iterations. Very little change occurs beyond 3 iterations.
The next step of the process involved making manual modifications to the FEA output that were not sufficiently addressed by the threshold-based updating scheme. This was often required due to the biomedical model not capturing all physical complexities that affect interface comfort, such as air gaps between skin, liner, and socket as well as the unique comfort preferences of the patient due to sensitive nerves or scar tissue. Manual modifications were done by mesh manipulation, where nodes could be moved to alter geometry for reasons such as pressure relief or clearance for ease of donning. For all sockets in this study, nodes in circular region with radius of 25 mm at the distal end of the tibia were moved 3 mm normal to the liner inner surface for more pressure relief, shown by Fig. 6 Step K-b. The region was integrated into the rest of socket through a tapered boundary region spanning 20 mm, over which the extra space was ramped down from 3 to 0 mm.
Prosthetic liners normally extend to mid-thigh level for comfort and security. Since imaging was only taken to just above the knee proximally, we extruded the top curve of the liner to reach the mid-thigh level. The distance of the extrusion was determined by the subject’s femoral length. The subject’s mid-thigh circumference was used to make a constant-thickness conical extrusion using a linear mapping from the top curve of the liner to the mid-thigh circumference, resulting in a liner model shown in Fig. 6 Step K-a.
Fabrication
Liners were fabricated using a new technique developed for rapid 3D printing of soft materials. This was done by directly extruding them into a gel suspension bath that acted as support material44. This allowed the rapid printing of custom liners without having to fabricate molds6. In this study, we collaborated with Rapid Liquid Print (Boston, MA, USA), to 3D print the custom liners from platinum-cure silicone. The silicone material has a tensile strength of 1.4 MPa and 1000% elongation at break. The liner’s 3D model was first turned into a geometrical shell, and a toolpath was defined accordingly. To get a 7 mm liner, the extrusion rate for silicone printing was 12 ml/min. On average, our custom liners were 700–800 ml, giving an average printing time of around 1 h.
Check sockets were 3D printed by Extremiti3D (South Carolina, USA) using either Essentium HSE (Pflugerville, TX, USA) or Filament Innovations Icarus (Coplay, PA, USA) 3D printers. The printing material was Poly-Cyclohexylenedimethylene Terephthalate Glycol (PCTG). This material is similar to PETG, a common thermoplastic used in prosthetic check socket fabrication, with improved impact resistance45,46. The printing time for sockets depended on the size and thickness, but averaged around 6 h. Both liners and sockets arrived nearly ready-to-wear. A socket pyramid adapter was the only component that had to be attached to the distal end of the socket via epoxy and tape. Proper alignment and securing of the pyramid to the socket was performed by the attending prosthetist. Figure 9 shows liner and socket load maps as well as examples of the 3D printed liner and sockets that were used in the clinical trial.
Fig. 9.

(a) Load map on the liner outer surface after 1 iteration of FEA before any manual modifications. (b) Socket load map after 3 iterations of FEA. (c) Fabricated liner. (d) Fabricated socket that has been aligned by a prosthetist and attached to a pylon through a socket pyramid secured by epoxy, heat-shrink, and tape.
The sockets used in this trial were check sockets because they only reached the stage of design iteration and fit testing. This is analogous to the step in the conventional process where a socket is manipulated by a prosthetist to better conform it to a patient’s limb. Final sockets would be made from carbon fiber, but since geometric optimization was the goal of this study, this final step was excluded. The digital framework does have the ability to create a positive mold from which a carbon socket can be created once the final check socket geometry is established.
Kinematic evaluation
Kinematic data was collected using a Vicon motion capture system and treadmill and processed using Vicon’s Nexus software (Vicon Motion Systems Ltd, UK). At the Cambridge site, the Vicon system utilized 12 cameras (MX-T40S, Vicon Motion Systems Ltd, UK) and a 76-marker custom full-body model based on the Helen Hayes marker set47. The Cambridge site also had force plates embedded in the treadmill (Bertec, OH, USA), allowing for ground reaction force (GRF) measurement. The Vicon and treadmill setup is shown in Fig. 10. Heel strike was defined through a combination of the occurrence of ground reaction force and Z-position of the heel marker, and toe off was defined through a combination of the absence of GRF and Z-position of the toe marker.
Fig. 10.
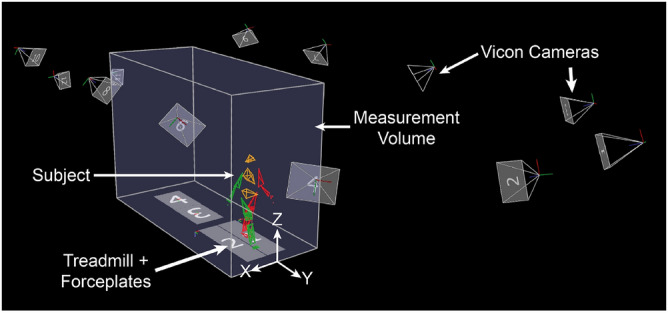
Experimental setup at the Cambridge location.
The Guadalajara site used an 8-camera Vicon setup (Bonita B10, Vicon Motion Systems Ltd, UK) and a 16-marker lower-body model. The treadmill at the Guadalajara site did not have force-measuring capabilities. Therefore, gait parameters were extracted from the motion capture data from foot position. Heel strike was defined as the instance when the heel marker reaches a peak in the Y-direction (anterior). Toe off was defined as the instance when the toe marker reaches a peak in Y-direction (posterior).
Two identical trials were performed, one with the conventional interface system and one with the novel interface. The order of the trials was randomized, chosen by a coin flip. The subject was asked to walk on the treadmill for 5 min at 1.3 m/s. Subjects 6–9 in the Mexico cohort were uncomfortable at this speed and performed the walking trials at 0.58 m/s instead. Three 30-s data captures were recorded, one each at the beginning, middle, and end of the 5-min period. Immediately after the 5-min trial, the socket and liner were doffed for thermal imaging.
Antalgic gait is a measure of change in movement that reflects effects on gait secondary to pain20. Specifically, discomfort on a given interface results in shortened stance time relative to swing time during the gait cycle. This can be expressed as the percentage of stride time (heel strike-to-heel strike) in stance (heel strike-to-toe off) of the affected leg, given by (1).
 |
1 |
Heel strike and toe off are defined by the Vicon “Detect Events From Forceplate” operation, with a vertical GRF threshold of 50N, anterior marker as the toe of each foot, and posterior marker as the heel of each foot. Antalgic gait percentage was calculated for every gait cycle for each affected limb across all data captures. A robust repeated measures linear mixed model was used to compare medians between conventional and novel datasets; this approach does not assume normality of the outcome and accounts for the correlation of the repeated measures on the same patients48. Because the type (difference in the median conventional vs median novel) effect was tested at two speeds, an effect for speed in the mixed model was included. The mixed model also tested if the type effect depends on speed by fitting an interaction between type and speed. We a priori specified that if the interaction was not statistically significant, then we could conclude that the type effect was similar across speeds so that we could present the effect of type adjusted for speed. Two-sided p-values less than  were considered statistically significant. The statistical analyses were performed using SAS version 9.4 (SAS Institute, Cary, NC, USA).
The minimal clinically important difference (MCID) is also important to verify that the change in antalgic gait is not due to gait variability. To evaluate this, a distribution-based method with effect size threshold of 0.2 was used to calculate the MCID for antalgic gait data, defined as  49. Distribution-based was chosen as the data is not patient-chosen and there are no definitive anchor points. As subjects 1–5 and 6–9 were evaluated at different speeds, the MCID was calculated for the two groups independently.
Thermal evaluation
Thermal images were taken using a thermal camera (E4 or E6390, Teledyne FLIR, USA) with an emissivity of 0.98 and reflected temperature of  . Each image set consisted of 4 images of the affected leg, one from each view: anterior, posterior, medial, and lateral, as shown in Fig. 11. When the patient arrived, they doffed their conventional interface and allowed their limb temperature to reach equilibrium for 10 min. A first image set was captured as reference. They then donned the first selected interface for the kinematic walking trial. Immediately post-walking, the patient doffed the interface and another image set was taken. The patient rested for another 10 min to allow their limb to reach equilibrium again, and a second set of reference images was taken. The other interface was donned and the process was repeated, resulting in a total of 16 images in 4 image sets per limb.
Fig. 11.

(a) An example thermal image, showing the anterior view of a right leg with ROI locations. The thermal scale was linearly interpolated based on the color bar. (b) The layout of the 6 ROIs for each image direction of the right leg for thermal data processing. The positions would be mirrored medial-laterally for a left-affected subject. ROI 4 was positioned at the fibular head for anterior, posterior, and lateral images. The fibular head is not visible in the medial view.
For each direction (anterior, posterior, medial, lateral) there were 4 images: 2 reference, 1 conventional, and 1 novel. The color scale from the camera was used to determine temperature values across the limb. For each image, the overall average limb temperature was calculated as well as the temperature at six 1 inch-diameter circular regions of interest (ROI) across the residuum based on the direction, shown in Fig. 11. The temperatures of the two reference images were averaged. For each subject, the percent change in limb temperature from reference was calculated. This metric was calculated for each interface type at every direction. Collective results were compiled into conventional and novel datasets and compared using a Wilcoxon signed-rank to determine significant difference at a significance level of  .
.
Pressure evaluation
Standing pressure was measured at six locations on the limb using force-sensitive resistors (FSR) (A101 or A201, 111N, FlexiForce, TekScan, Boston, MA, USA) calibrated by adjusting voltage using potentiometers in an amplifier circuit read into an Arduino Mega (Arduino, ITA). The voltage in the circuit was mapped to a bit reading, with 1023 corresponding to HIGH and 0 corresponding to LOW. If the pressure read by an FSR was saturated, the potentiometer was used to limit the read voltage in order to get a usable value. The aim was to have all locations read around 500 in neutral double-support standing, though this was impossible for low-pressure locations. Sensors were secured to the skin using a plastic surgical tape (MPR-62202, Shield Line LLC, USA) which could be removed with minimal discomfort. The six locations were: patellar tendon (PT), fibular head (FH), anterior mid-tibia (AMT), anterior distal tibia (ADT), posterior proximal wall (PPW), and posterior distal wall (PDW), shown in Fig. 12.
Fig. 12.

Force sensitive resistor locations for measuring pressure on a left leg. (a) anterior view; (b) posterior view.
Conventional interface pressure was measured first, then novel. The FSRs were taped to the limb, the liner was carefully rolled over the sensors and the socket was donned. The subject stood with full weight on the affected limb to check that all the sensors were functioning and none were maxed out. If a signal was maxed out, the potentiometer was adjusted to bring the signal back into a readable range. Data collection consisted of a 90-s standing trial split into 3 parts: 30 s on the affected leg, 30 s on both legs, and 30 s back on the affected leg. Data was collected at a frequency of 40 Hz. The two 30-s segments were performed to ensure consistent measurement of the affected leg after unloading and reloading weight. The conventional interface was then doffed and the novel donned, with careful attention paid to mitigate any sensor shift. The 90-s trial was repeated on the novel interface without re-calibrating the sensors. This allowed measurement of relative pressure between conventional and novel, but not absolute pressure values. This measurement method is reasonable given the high reported error of FSRs for measuring load in lower limb prosthetics and the inexact repeatability of the setup50.
The raw data was processed by interpolating out errant 0 values and taking a moving average with a window size equals to half the sampling frequency. For each 30-s time period, conventional and novel signals were normalized by the global maximum reading for that location within that period, giving values from 0 (min) to 1 (max). Within each 30-s period, a 6-s window with the least total variance between both conventional and novel pressures was chosen. This was done by incrementally moving through the trial by 6-s, calculating the variances of each interface pressure reading within the window, and averaging them. The lowest average corresponded to the time frame where the subject was standing the most stable. Average pressure values were then computed for conventional and novel interfaces in this 6-s window, and the values for both single-leg standing segments were averaged. For each location, subject averages for the conventional and novel datasets were compared using a Wilcoxon signed-rank at a significance level of  .
.
Questionnaires
A socket evaluation questionnaire (SEQ) was developed and used to get direct subjective feedback on the fit and comfort of prosthetic interfaces from each subject, collecting both qualitative comments as well as quantitatively scored comparisons. This questionnaire is provided as a supplementary material. The SEQ was administered to subjects using both their conventional and novel interfaces once the subject deemed the novel interface sufficiently comfortable for walking. The subject was asked to rate the novel interface compared to their conventional interface in sitting, standing, and walking scenarios. Their evaluations analyzed subjective perception of overall fit, overall pressure, and pain at anterior, posterior, medial, and lateral regions on their residual limb. Fit was defined as the appropriateness of the shape of the interface for the residual limb, whereas pressure was defined as the appropriateness of the level of tightness and pressure distribution felt from the interface on the residual limb.
Fit and pressure between conventional and novel interfaces were rated relatively on scale from 1 to 100, where a score of 50 meant that the subject perceived the two interfaces as being identical in fit or pressure. A score greater than 50 indicated that the subject perceived the novel interface as better in terms of fit or pressure, whereas a score less than 50 indicated that the subject perceived their conventional interface as better in terms of fit or pressure. Similarly, subjects rated the conventional and novel interfaces according to their comfort in various anatomical regions of the residual limb on a scale of 1–5. A score of 3 indicated an approximately equal level of comfort in the given anatomical region, a score of 5 indicated a strong preference for the novel interface, and a score of 1 translated to a strong preference for the conventional interface.
Rating results were compiled by case for the subject population into datasets of n=9 and compared to a control dataset of n=9 and values of 50 using a Wilcoxon signed-rank at a significance level of  . Qualitative feedback was also collected and reported.
Supplementary Information
Acknowledgements
All authors thank Bob Emerson, C.P. for his help in fitting and aligning Cambridge subjects on the novel prosthetic interfaces, Bjorn Sparrman for his help in printing the custom liners used in the study, and Michael Nawrot for his contributions in setting up and operating the Vicon motion capture system. In addition, the authors thank Julia Howarth for her contributions to socket fittings, evaluation, and data analysis. Further, the authors thank Carl A. Seelhoff and Kaili Glasser for their help in patient registration and evaluation. The authors also wish to thank the following research personnel who collaborated in the experimental design and equipment development at the Guadalajara, Mexico site: Rita Q. Fuentes, Luis Carlos Felix-Herran, Jorge Luis Perez, Daniel Pizarro-Bermudez, Jorge Saenz-Carrillo; Marco Barreto, Oscar Mancha-Mendoza, Pedro Chavarrias-Solano, Rebeca Reyes-Sicairos, Gisel Jimena Sánchez-Salazar, Sebastián Lazarini, Marisol Lemus, Victor Castillo-Madrigal, Elias Diaz-Pérez, Juliana Muñoz-Lopez, Jocelyn Ordoñez-Jarrillo, Rodrigo Trujillo-Aguilar, Oswaldo Lopez, Liliana Avila-Flores. All authors acknowledge both the support received from the NGO Tecnologías al Servicio de la Comunidad, A.C. to invite and follow up with Guadalajara, MX protocol participants and from Proactible, S.A.P.I. for conventional fabrication and novel socket fitting and aligning of Guadalajara, MX subjects during the protocol.
Author contributions
D.R.C.L. contributed to the modification of the digital design framework, the design and fabrication of prosthetic interface, the experimental design of the study, data acquisition, data analysis, interpretation of the data, and writing and revision of this manuscript. X.Y. contributed to the modification of the digital design framework, the design and fabrication of prosthetic interface, the experimental design of the study, data acquisition, and revision of the manuscript. F.R. contributed to the recruitment of participants, the creation of the prosthetic interface evaluation questionnaire, data acquisition, data analysis, and interpretation of the data. B.A. and M.B. contributed to data acquisition and data analysis. D.S. contributed to the recruitment of participants, imaging and biomechanical model reconstruction, experimental design of the study, and revision of the manuscript. S.R.L. contributed to data analysis and interpretation of the data. K.M.M. contributed to the design and creation of the digital design framework. C.I.M. contributed to imaging and biomechanical model reconstruction and data acquisition. A.M.J. contributed to imaging and biomechanical model reconstruction, experimental design of the study, and hardware creation. J.C.H. contributed to project management, funding acquisition, the recruitment of participants, data acquisition, data analysis, and revision of the manuscript. H.M.H. contributed to the design and creation of the digital design framework, project management, funding acquisition, experimental design, and revision of the manuscript. All authors have read and approved the final manuscript.
Data availability
The datasets used and/or analyzed during the current study are available from the corresponding authors on reasonable request.
Declarations
Competing Interests
Authors Duncan R.C. Lee, Xingbang Yang, Dana Solav, Kevin M. Moerman, Christina I. Meyer, Aaron M. Jaeger, and Hugh M. Herr are listed as inventors on patent applications related to the presented transtibial liner-socket design methodology. All other authors do not have any competing interests.
Footnotes
Publisher’s note
Springer Nature remains neutral with regard to jurisdictional claims in published maps and institutional affiliations.
These authors contributed equally: Duncan R. C. Lee and Xingbang Yang.
Contributor Information
Duncan R. C. Lee, Email: drclee@media.mit.edu
Joel C. Huegel, Email: jhuegel@tec.mx
Hugh M. Herr, Email: hherr@media.mit.edu
Supplementary Information
The online version contains supplementary material available at 10.1038/s41598-024-74504-3.
References
- 1.Murphy, E. F. Sockets, linings, and interfaces. Clin. Prosthet. Orthot.8, 4–10 (1984). [Google Scholar]
- 2.Edwards, M. L. Lower limb prosthetics. In Clinician’s Guide to Assistive Technology 297–310. 10.1016/B978-081514601-8.50026-4 (Elsevier, 2002).
- 3.McDonald, C. L., Westcott-McCoy, S., Weaver, M. R., Haagsma, J. & Kartin, D. Global prevalence of traumatic non-fatal limb amputation. Prosthet. Orthot. Int.45, 105–114. 10.1177/0309364620972258 (2021). [DOI] [PubMed] [Google Scholar]
- 4.Highsmith, J. T. & Highsmith, M. J. Common skin pathology in LE prosthesis users. J. Am. Acad. Phys. Assist.20, 33–36. 10.1097/01720610-200711000-00018 (2007). [DOI] [PubMed] [Google Scholar]
- 5.Spittle, M., Collins, R. J. & Conner, H. The incidence of pressure sores following lower limb amputations. Pract. Diabetes Int.18, 57–61. 10.1002/pdi.139 (2001). [Google Scholar]
- 6.Yang, X. et al. Material, design, and fabrication of custom prosthetic liners for lower-extremity amputees: A review. Med. Novel Technol. Devices17, 100197. 10.1016/j.medntd.2022.100197 (2023). [Google Scholar]
- 7.How to make Prosthetics. Hangar Clinic. https://www.scheckandsiress.com/blog/how-to-make-prosthetics (2022).
- 8.Sengeh, D. M. & Herr, H. A variable-impedance prosthetic socket for a transtibial amputee designed from magnetic resonance imaging data. JPO J. Prosthet. Orthot.25, 129–137. 10.1097/JPO.0b013e31829be19c (2013). [Google Scholar]
- 9.Zepeda, E. What is a Prosthetic Socket: Function & Fitting. Primecare Orthotics & Prosthetics. https://primecareprosthetics.com/blog/prosthetic-socket-a-full-explanation (2022).
- 10.Rosicky, J., Grygar, A., Chapcak, P., Bouma, T. & Rosicky, J. Application of 3D scanning in prosthetic and orthotic clinical practice. In Proceedings of the 7th International Conference on 3D Body Scanning Technologies, Lugano, Switzerland, 30 Nov.–1 Dec. 2016 88–97. 10.15221/16.088 (Hometrica Consulting - Dr. Nicola D’Apuzzo, 2016).
- 11.Solutions. Prosfit. https://prosfit.com/solutions (2024).
- 12.Vanhemert, K. Forget cheetah blades. This prosthetic socket is a real breakthrough. Wired Mag. (2014).
- 13.Dickinson, A. S. et al. Selecting appropriate 3D scanning technologies for prosthetic socket design and transtibial residual limb shape characterization. JPO J. Prosthet. Orthot.34, 33–43. 10.1097/JPO.0000000000000350 (2022). [Google Scholar]
- 14.Direct socket—frequently asked questions. Ossur. https://www.ossur.com/en-gb/prosthetics/one-visit-prosthetics/information-for-users/one-visit-solutions-faqs (2024).
- 15.Górski, F., Wichniarek, R., Kuczko, W. & Żukowska, M. Study on properties of automatically designed 3D-printed customized prosthetic sockets. Materials14, 5240. 10.3390/ma14185240 (2021). [DOI] [PMC free article] [PubMed] [Google Scholar]
- 16.Nguyen, K.-T., Benabou, L. & Alfayad, S. Systematic review of prosthetic socket fabrication using 3D printing. In Proceedings of the 2018 4th International Conference on Mechatronics and Robotics Engineering 137–141. 10.1145/3191477.3191506 (ACM, New York, 2018).
- 17.Paternò, L., Dhokia, V., Menciassi, A., Bilzon, J. & Seminati, E. A personalised prosthetic liner with embedded sensor technology: A case study. Biomed. Eng. Online19, 71. 10.1186/s12938-020-00814-y (2020). [DOI] [PMC free article] [PubMed] [Google Scholar]
- 18.Oldfrey, B. et al. Additive manufacturing techniques for smart prosthetic liners. Med. Eng. Phys.87, 45–55. 10.1016/j.medengphy.2020.11.006 (2021). [DOI] [PubMed] [Google Scholar]
- 19.Donnelley, C. A. et al. Cost analyses of prosthetic devices: A systematic review. Arch. Phys. Med. Rehabil.102, 1404–1415. 10.1016/j.apmr.2021.02.010 (2021). [DOI] [PubMed] [Google Scholar]
- 20.Auerbach, N. & Tadi, P. Antalgic Gait in Adults (StatPearls Publishing, 2022). [PubMed] [Google Scholar]
- 21.Hebenstreit, F. et al. Effect of walking speed on gait sub phase durations. Hum. Mov. Sci.43, 118–124. 10.1016/j.humov.2015.07.009 (2015). [DOI] [PubMed] [Google Scholar]
- 22.Morgan, S. J., Friedly, J. L., Amtmann, D., Salem, R. & Hafner, B. J. Cross-sectional assessment of factors related to pain intensity and pain interference in lower limb prosthesis users. Arch. Phys. Med. Rehabil.98, 105–113. 10.1016/j.apmr.2016.09.118 (2017). [DOI] [PMC free article] [PubMed] [Google Scholar]
- 23.Legro, M. W. et al. Prosthesis evaluation questionnaire for persons with lower limb amputations: Assessing prosthesis-related quality of life. Arch. Phys. Med. Rehabil.79, 931–938. 10.1016/s0003-9993(98)90090-9 (1998). [DOI] [PubMed] [Google Scholar]
- 24.Meyer, C. Design and efficacy of a variable thickness transtibial prosthetic liner (2021).
- 25.Hagberg, K. & Brånemark, R. Consequences of non-vascular trans-femoral amputation. Prosthet. Orthot. Int.25, 186–194. 10.1080/03093640108726601 (2001). [DOI] [PubMed] [Google Scholar]
- 26.Peery, J. T., Ledoux, W. R. & Klute, G. K. Residual-limb skin temperature in transtibial sockets. J. Rehabil. Res. Dev.42, 147. 10.1682/JRRD.2004.01.0013 (2005). [DOI] [PubMed] [Google Scholar]
- 27.Naylor, P. F. D. Experimental friction blisters. Br. J. Dermatol.67, 327–342. 10.1111/j.1365-2133.1955.tb12657.x (1955). [DOI] [PubMed] [Google Scholar]
- 28.Sprigle, S., Linden, M., McKenna, D., Davis, K. & Riordan, B. Clinical skin temperature measurement to predict incipient pressure ulcers. Adv. Skin Wound Care14, 133–137. 10.1097/00129334-200105000-00010 (2001). [DOI] [PubMed] [Google Scholar]
- 29.Paula-Ribeiro, M., Garcia, M. M., Martinez, D. G., Lima, J. R. & Laterza, M. C. Increased peripheral vascular resistance in male patients with traumatic lower limb amputation. Blood Press. Monit.20, 341–345. 10.1097/MBP.0000000000000148 (2015). [DOI] [PubMed] [Google Scholar]
- 30.Oddes, Z. & Solav, D. Identifiability of soft tissue constitutive parameters from in-vivo macro-indentation. J. Mech. Behav. Biomed. Mater.140, 105708. 10.1016/j.jmbbm.2023.105708 (2023). [DOI] [PubMed] [Google Scholar]
- 31.Herr, H. M. et al. Quantitative design and manufacturing framework for a biomechanical interface contacting a biological body segment (2021).
- 32.How long does the custom prosthetics process take? (2023).
- 33.Tuominen, E. K. J., Kankare, J., Koskinen, S. K. & Mattila, K. T. Weight-bearing CT imaging of the lower extremity. Am. J. Roentgenol.200, 146–148. 10.2214/AJR.12.8481 (2013). [DOI] [PubMed] [Google Scholar]
- 34.Moerman, K. M., Solav, D., Sengeh, D. & Herr, H. Automated and data-driven computational design of patient-specific biomechanical interfaces. 1–17. 10.31224/osf.io/g8h9n (2016).
- 35.Solav, D., Moerman, K. M., Jaeger, A. M. & Herr, H. M. A framework for measuring the time-varying shape and full-field deformation of residual limbs using 3-D digital image correlation. IEEE Trans. Biomed. Eng.66, 2740–2752. 10.1109/TBME.2019.2895283 (2019). [DOI] [PMC free article] [PubMed] [Google Scholar]
- 36.Moerman, K. M. GIBBON: The geometry and image-based bioengineering add-on. J. Open Source Softw.3, 506. 10.21105/joss.00506 (2018). [Google Scholar]
- 37.Solav, D., Moerman, K. M., Jaeger, A. M., Genovese, K. & Herr, H. M. MultiDIC: An open-source toolbox for multi-view 3D digital image correlation. IEEE Access6, 30520–30535. 10.1109/ACCESS.2018.2843725 (2018). [Google Scholar]
- 38.Si, H. TetGen A quality tetrahedral mesh generator and three-dimensional delaunay triangulator version 1.4 user’s manual. Tech. Rep., Weierstrass Institute for Applied Analysis and Stochastic (2006).
- 39.Amend, J. R. & Lipson, H. FreeLoader: An open source universal testing machine for high-throughput experimentation. In Volume 6: 35th Mechanisms and Robotics Conference, Parts A and B 685–693. 10.1115/DETC2011-48296 (ASMEDC, 2011).
- 40.Sengeh, D. M., Moerman, K. M., Petron, A. & Herr, H. Multi-material 3-D viscoelastic model of a transtibial residuum from in-vivo indentation and MRI data. J. Mech. Behav. Biomed. Mater.59, 379–392. 10.1016/j.jmbbm.2016.02.020 (2016). [DOI] [PubMed] [Google Scholar]
- 41.Johnson, G. A. et al. Tensile and viscoelastic properties of human patellar tendon. J. Orthop. Res.12, 796–803. 10.1002/jor.1100120607 (1994). [DOI] [PubMed] [Google Scholar]
- 42.Ateshian, G. A. & Ricken, T. Multigenerational interstitial growth of biological tissues. Biomech. Model. Mechanobiol.9, 689–702. 10.1007/s10237-010-0205-y (2010). [DOI] [PMC free article] [PubMed] [Google Scholar]
- 43.Maas, S. A., Ellis, B. J., Ateshian, G. A. & Weiss, J. A. FEBio: Finite elements for biomechanics. J. Biomech. Eng.134, 10.1115/1.4005694 (2012). [DOI] [PMC free article] [PubMed]
- 44.Hajash, K., Sparrman, B., Guberan, C., Laucks, J. & Tibbits, S. Large-scale rapid liquid printing. 3D Print. Addit. Manuf.4, 123–132. 10.1089/3dp.2017.0037 (2017). [Google Scholar]
- 45.Gerschutz, M. J., Haynes, M. L., Nixon, D. M. & Colvin, J. M. Tensile strength and impact resistance properties of materials used in prosthetic check sockets, copolymer sockets, and definitive laminated sockets. J. Rehabil. Res. Dev.48, 987. 10.1682/JRRD.2010.10.0204 (2011). [DOI] [PubMed] [Google Scholar]
- 46.PCTG Technical Data Sheet. Spectrum Filaments. https://spectrumfilaments.com/wp-content/uploads/2022/05/en_tds_spectrum_pctg.pdf (2022).
- 47.Kadaba, M. P., Ramakrishnan, H. K. & Wootten, M. E. Measurement of lower extremity kinematics during level walking. J. Orthop. Res.8, 383–392. 10.1002/jor.1100080310 (1990). [DOI] [PubMed] [Google Scholar]
- 48.Lipsitz, S. R., Fitzmaurice, G. M., Orav, E. J. & Laird, N. M. Performance of generalized estimating equations in practical situations. Biometrics50, 270. 10.2307/2533218 (1994). [PubMed] [Google Scholar]
- 49.Franceschini, M. et al. The minimal clinically important difference changes greatly based on the different calculation methods. Am. J. Sports Med.51, 1067–1073. 10.1177/03635465231152484 (2023). [DOI] [PMC free article] [PubMed] [Google Scholar]
- 50.Swanson, E. C., Weathersby, E. J., Cagle, J. C. & Sanders, J. E. Evaluation of force sensing resistors for the measurement of interface pressures in lower limb prosthetics. J. Biomech. Eng.141, 10.1115/1.4043561 (2019). [DOI] [PMC free article] [PubMed]
Associated Data
This section collects any data citations, data availability statements, or supplementary materials included in this article.
Supplementary Materials
Data Availability Statement
The datasets used and/or analyzed during the current study are available from the corresponding authors on reasonable request.