

Abstract
Tissue regeneration and maintenance rely on coordinated stem cell behaviors. This orchestration can be impaired by oncogenic mutations leading to cancer. However, it is largely unclear how oncogenes perturb stem cells’ orchestration to disrupt tissue. Here, we used intravital imaging to investigate the mechanisms by which oncogenic Kras mutation causes tissue disruption in the hair follicle. Through longitudinally tracking hair follicles in live mice, we found KrasG12D, a mutation that can lead to squamous cell carcinoma, induces epithelial tissue deformation in a spatiotemporally specific manner, linked with abnormal cell division and migration. Using a reporter mouse capture real-time ERK signal dynamics at the single cell level, we discovered that KrasG12D, but not a closely related mutation HrasG12V, converts ERK signal in stem cells from pulsatile to sustained. Finally, we demonstrated that interrupting sustained ERK signal reverts KrasG12D-induced tissue deformation through modulating specific features of cell migration and division.
Introduction
Tissue function depends on orchestrated cell organization and behaviors, facilitated by dynamic cell-cell communication. The coordination of these events can be disrupted by oncogenic mutations, leading to cancer. However, understanding how oncogenic mutations initiate tissue disruption and cancer requires the challenging task of tracking the same cells and tissues as they transition from normal to oncogenic. Furthermore, cancer formation is context dependent, with identical mutations resulting in diverse outcomes based on microenvironment. 1, 2. Recent findings that phenotypically normal tissues can carry many oncogenic mutations3 further underscore the importance of identifying specific contexts that promote tissue disruption.
Skin epithelium is a powerful system for studying cancer biology because of its well-characterized cancer types, associated oncogenes, and mouse models that recapitulate human cancers4. Cutaneous squamous cell carcinoma (cSCC) is one of the most frequent cancers originating from the skin epithelium. Mouse models with Ras oncogene expression in the skin epithelium have identified the population in the hair follicle that can initiate cSCC, along with various tissue abnormalities preceding cancer phenotypes5–8. However, the cellular and molecular mechanisms underlying these precancerous tissue changes remain largely unclear, partly because the skin epithelium constantly regenerates and dynamically responds to oncogenes. Notably, mutation-induced aberrations may resolve over time, and the same mutation can yield different outcomes in distinct epithelial compartments9, 10. Capturing spatiotemporal tissue dynamics alongside molecular and cellular changes resulting from oncogenic mutations is essential.
Among skin epithelial tissues that are used to model cSCC, the hair follicle epithelium is particularly suited for dissecting the context-dependent mechanisms of oncogenesis due to its cyclic nature, creating diverse microenvironments where oncogenic mutations can impact the orchestration of different types of cell behaviors. When going through different phases of the hair cycle, including rest (Telogen) and multiple stages of growth (Anagen) and regression (Catagen), hair follicles drastically change their cellular compositions and exhibit spatiotemporally distinct cellular and molecular phenotypes (Extended Data figure 1a) 11–15. For example, during the growth phase, hair follicle stem cells undergo coordinated expansion, reorganization, and differentiation into multiple cell types to build a stereotypic architecture of concentric layers. The outermost layer (Outer Root Sheath, ORS) comprises the expanded stem cells (ORS cells) that proliferate and migrate downwards to sustain hair follicle growth and refill the progenitors inside at the bottom of the hair follicle15. These progenitors rapidly divide to generate cells moving upwards to form the multiple differentiated inner layers. These cell behaviors are spatiotemporally orchestrated, occurring both across and within different layers. Particularly, as growth progresses the proliferation of outer stem cells becomes restricted to the lower part of the hair follicle16. Together, these characteristics make the hair follicle an excellent model to interrogate how oncogenic mutations disrupt coordinated cellular behaviors to induce specific outcomes.
Here, by combining an inducible oncogenic Kras model with intravital imaging, we uncover mechanisms underlying Ras mutation-induced tissue disruption. Longitudinal tracking of the same tissues in live mice showed that the KrasG12D mutation induces epithelial deformation in the hair follicle in a spatiotemporally specific manner. Through time lapse analyses and live extracellular signal-regulated kinase (ERK) reporter, we reveal that the normal pulsatile ERK signals in the stem cells can be converted by KrasG12D into sustained activation, which is associated with abnormal cell division and migration. Furthermore, by temporarily inhibiting ERK activation with drug treatment, we demonstrate that sustained ERK signaling induced by KrasG12D is required for the formation and maintenance of the epithelial deformation. Together, our work suggests that spatiotemporally specific tissue disruption can be induced by oncogenic mutations through modulating signaling dynamics.
Results
KrasG12D induces specific spatiotemporal tissue deformation
Several months after being induced in hair follicle stem cells, oncogenic KrasG12D mutation can cause the formation of papilloma as well as cSCC if combined with the loss of tumor suppressor genes5–8. Before tumor emergence, multiple types of architecture disruption were identified, including follicular hyperplasia and cyst formation. However, it is still not clear how these tissue abnormalities arose with respect to the specific tissue regeneration processes that oncogenes may disrupt.
In order to understand the emergence of these tissue abnormalities, we first used live imaging to longitudinally track hair follicles with KrasG12D mutant epithelial cells to identify when and where during the hair cycle mutant cells cause specific types of tissue disruption. We employed an inducible Cre driver that can target most stem cells in the hair follicle (Lgr5-CreER) to induce KrasG12D expression (LoxP-STOP-LoxP-KrasG12D/+) right before the first rest phase of the hair cycle. These mice also express an epithelial nuclear marker (K14-H2BGFP) (Figure 1a) that allowed us to track the same skin of the live mice every 3–4 days throughout the growth and regression phases (Figure 1b). By incorporating a Cre reporter (LoxP-STOP-LoxP-tdTomato), we estimated that the Kras mutant allele was induced in the vast majority of the hair follicle stem cells in the rest phase as well as their progeny during the following phases in the experimental mice (Figure 1c). We focused on skin areas where hair type is largely uniform to minimize potential variation stemming from different hair types (Extended Data figure 1b).
Figure 1. KrasG12D induces spatiotemporally specific tissue deformation in hair follicle regeneration.

a, Schematic showing the genetic approach to induce KrasG12D in the hair follicle stem cells via tamoxifen (TAM) inducible Cre-LoxP system.
b, Schematic showing the timing of the KrasG12D induction and repeated imaging relative to the hair cycle stages.
c, Representative two-photon images of the wild-type resting and growing hair follicles carrying Cre-inducible tdTomato (magenta) reporter after induction.
d, Representative two-photon images of the control and KrasG12D hair follicles at different stages of the hair cycle. Bump-like tissue deformation in the ORS is outlined by a red dashed line.
e, Fraction of the KrasG12D hair follicles with tissue deformation at different stages of hair follicle growth. n=4 mice. 169 early & middle growth and 311 late growth hair follicles were analyzed. ****, p<0.0001. Two-sided unpaired t-test was used to calculate p value.
f, Fraction of tissue deformations occupying upper, lower, and bulb ORS for individual KrasG12D hair follicles. n=97 hair follicles that developed deformation in 4 KrasG12D mice were analyzed. ****, p<0.0001. Two-sided paired t-test was used to calculate p value. No tissue deformation that occupied bulb ORS was detected. Schematic shows different parts of ORS. The border (dashed line) between the upper and lower ORS is determined by the midpoint of the hair follicle length above the bulb.
Data are presented as mean ±S.D. with individual data points in e and f. Epithelial nuclei were labeled by K14-H2BGFP (yellow in c and white in d). Scale bars, 20 µm.
Interestingly, through tracking the hair follicles in the same mice, we found that mutant hair follicles did not exhibit obvious architectural defects during the early and middle growth stages (Anagen I-III) (Figure 1d and 1e). However, as hair follicles grew into late stages (started from Anagen IV), bump-like tissue deformations specifically formed in the outermost layer (ORS) of the mutant hair follicles, where the expanded stem cells (ORS cells) are located (Figure 1d and 1e). Consistent with previous studies, the inner layers that consist of hair progenitors and differentiating cells did not show abnormal architecture5, 8. When mutant hair follicles entered the regression phase, new architectural abnormalities emerged, including malformed epithelial strand and follicular cyst (Figure 1d, Regression). Importantly, the hair follicles with a delayed entrance to the growth cycle did not show deformation at early growth stages, at the same time as other follicles in the same skin but at late growth stages developed the phenotype (Extended Data figure 1c). This indicates that the temporal specificity of the Kras-induced tissue abnormality is due to changes between different hair follicle stages, not the duration of exposure to oncogenic Kras. In addition to the temporal specificity of this tissue aberrancy, we also found that the bump-like tissue deformations preferentially formed at specific positions along the hair follicle length. In the late growth stages, the upper ORS was significantly more likely to form the tissue deformation than the lower ORS, while the bottom ORS at the surface of the hair bulb was never deformed (Figure 1f). Together, these findings show that oncogenic KrasG12D induces tissue deformation in a spatiotemporally specific manner during hair follicle regeneration, particularly a bump-like structure in the upper ORS at the late growth stage.
KrasG12D causes abnormal cell division and migration
The spatiotemporal specificity of the bump-like tissue deformation made us wonder what cellular alterations induce this tissue architecture disruption, and particularly how these alterations vary in different niches within the hair follicle. Previous studies identified high numbers of proliferative cells in relatively late stages hair follicles where tissue deformation had been induced by KrasG12D 5, 8. However, it is still unclear whether other abnormal cell behaviors are induced by Kras mutation, when those abnormal cell behaviors initiate relative to tissue deformation, and where these changes occur within the hair follicle. To better understand the cellular mechanisms that drive tissue deformation, we performed proliferation analyses in early bump formation stages and used time lapses to examine additional cell behaviors. By using an EdU (5-ethynyl-2-deoxyuridine) cell proliferation assay, we found that more proliferative cells were detected in the ORS of the KrasG12D mutant hair follicles (Figure 2a and 2b). Interestingly, we observed that proliferation in the Kras mutant follicles was not spatially restricted as typically found in wild-type follicles16. Although the number of the EdU+ cells was not different in the lower ORS between the control and mutant (Figure 2c), the relative proportion of proliferation in the upper versus lower ORS was significantly higher in the Kras mutant hair follicles (Figure 2d). These data suggest that instead of elevating cell division over the entire ORS, the KrasG12D mutation releases the proliferation restriction in the upper ORS.
Figure 2. KrasG12D causes abnormal cell division and migration during hair follicle growth.

a, Representative images of the control and KrasG12D hair follicles on tissue sections with EdU (magenta) and DAPI (cyan) labeling for analyzing cell proliferation in the ORS. Upper and lower ORS are separated by a yellow dashed line. The diamond symbol denotes the hair shaft.
b, Average numbers of EdU+ ORS cells quantified on tissue sections in the control and KrasG12D hair follicles. n=4 control mice and 4 KrasG12D mice. *, p=0.0218.
c, Average numbers of EdU+ lower ORS cells quantified on tissue sections in the control and KrasG12D hair follicles. n=4 control and 4 KrasG12D mice. ns, not significant, p=0.6461.
d, Ratio of the EdU+ upper ORS cells to the total EdU+ ORS cells in the control and KrasG12D hair follicles. n=4 control and 4 KrasG12D mice. **, p=0.0022.
e, Percentages of the planar and perpendicular divisions in the control and KrasG12D hair follicles. n=3 control and 3 KrasG12D mice. *, p=0.0378.
f, Representative two-photon time lapse frames of the control and KrasG12D hair follicles showing division angles of the ORS cells. Nuclei of dividing cells are marked with yellow dashed lines.
g, Representative two-photon time lapse frames of the control and KrasG12D hair follicles showing migration tracks of ORS cells over 7.5 hours.
h, Average cell displacement per hour of the control and KrasG12D ORS cells. n= 3 control and 3 KrasG12D mice. *, p=0.0224.
i, Two-photon time lapse frames showing one KrasG12D ORS cell migrating upwards.
j, Length comparison between the P35 control hair follicles and the P35 and P39 KrasG12D hair follicles. n=3 P35 control mice, 3 P35 KrasG12D mice and 3 P39 KrasG12D mice. ***, p=0.0006 (P35) and 0.0003 (P39).
k, Schematic showing abnormal division and migration of the KrasG12D ORS cells contribute to tissue deformation.
Two-sided unpaired t-test was used to calculate p values in b-e, h, j. Data are presented as mean ±S.D. with individual data points in b- d, h, j, and stacked bars with mean +S.D. in e. Epithelial nuclei were labeled by K14-H2BmCherry (white in f, g and i). Scale bars, 20 µm.
Cell proliferation can affect overall tissue architecture in multiple ways, depending on how it is carried out in 3D space. Through time lapse analysis of the 3D hair follicles in live mice, we found that the division angle of the ORS cells was significantly more likely to be perpendicular to the basement membrane in the mutant hair follicles than in the control, where divisions are mostly planar (Figure 2e and 2f). Those perpendicular divisions resulted in one daughter being placed into the suprabasal layer, which can contribute to bump formation. This result is reminiscent of the effect of active Kras in epidermal stem cells of the footpad, which is devoid of hair follicles17.
In addition to the ectopic divisions, we also identified abnormal migrations of the Kras mutant ORS cells via long time lapses (5–8 hours). In wild-type hair follicles at the growth phase, the ORS cells migrate downwards to extend the hair follicle length13, 15. However, compared with the control, the Kras mutant ORS cells had significantly shorter displacement along the growth axis (Figure 2g and 2h; Supplementary movie 1). Occasionally, some mutant cells also migrate upwards, rather than downwards (Figure 2i). These migration defects together with the abnormal division angles can cause cell accumulation in the upper ORS and ultimately less hair follicle extension. Consistent with that, the Kras mutant hair follicles were significantly shorter than the controls across different stages (Figure 2j). Even the mutant hair follicles that were close to the end of the growth phase (P39) remained shorter than the earlier stage (P35) controls, suggesting the length difference was not due to any delay of hair cycle. Altogether, our findings suggest that spatially mis-regulated cell division, abnormal division angle, and migration caused by KrasG12D mutation may lead to the bump-like tissue deformation (Figure 2k).
KrasG12D converts pulsatile into sustained ERK activation
Ras proteins are core components of multiple signaling pathways. The mis-regulated KrasG12D mutant cell behaviors could be a result of miscommunication between the cells and their microenvironments. A previous study found that ERK activation was upregulated in the deformed Kras mutant hair follicles8, raising the question of whether mis-regulated ERK signaling mediates the KrasG12D-induced tissue deformation. Interestingly, recent studies showed that the particular temporal patterns of ERK activation can coordinate collective cell behaviors at the tissue level18–22. Thus, to assess how KrasG12D changes ERK signal dynamics during hair follicle growth, we used a reporter mouse expressing the ERK-KTR biosensor23, 24. This biosensor allows us to capture real time ERK activity measurements at the single cell level in live mice based on its nucleocytoplasmic distribution (Figure 3a, nuclear localization indicates inactive ERK and nuclear exclusion indicates highly active ERK). We focused on analyzing the hair follicle growth stage when ORS deformation starts to emerge (Anagen IV). At this stage, hair follicle epithelial cells form longitudinal layers that are symmetrically organized, including the inner layers of multiple types of differentiated cells and the outermost layer of expanded stem cells (ORS cells). Time lapses of the wild-type hair follicles that express the ERK reporter showed that different cell populations have distinct ERK activation dynamics (Figure 3b). Specifically, the innermost differentiated cell types show sustained low activation; the middle layers of differentiated cell types show sustained high activation; and the outer layers of cell types including the ORS cells show pulsatile activation. This pattern suggests that different ERK signal dynamics may be associated with cell population-specific behaviors and functions. Notably, the pulsatile ERK activation in the ORS was often manifested as directional wave-like signal spread between cells (Extended Data figure 2a). This resembles the epidermal growth factor receptor (EGFR)-mediated ERK signal propagation between epithelial cells both in culture and in skin epidermis, which was found to direct collective cell migration19, 21, 22. Given that KrasG12D induces tissue deformation and abnormal cell behaviors, including the migration defects, specifically in the ORS, we focused on analyzing the ERK signal dynamics in those stem cells.
Figure 3. KrasG12D converts pulsatile into sustained ERK activation in the hair follicle stem cells.

a, Schematic showing that the ERK-KTR-mClover biosensor reports ERK activation status based on its nucleocytoplasmic distribution.
b, Representative two-photon time lapse frames of the wild-type late growth hair follicle expressing the ERK biosensor. Example cells in different layers are outlined by dashed lines (blue, inner differentiated cell; red, middle differentiated cell; yellow, outer stem cell). Their ERK activation dynamics are indicated by the selected time frames and plotted curves. Schematic shows distinct ERK activation dynamics at different layers of the late growth hair follicle.
c, Representative two-photon time lapse frames of the wild-type, KrasG12D, and HrasG12V hair follicles, showing different ERK activation dynamics in the ORS. Hair follicle borders are marked with white dashed lines and inner layers are masked in opaque blue to better show the ORS cells.
c′, ERK activation curves of one representative ORS cell in each hair follicle in c. Peaks within the curves were identified by a threshold of local maxima to reflect the pulsing frequency. Complete datasets of all the analyzed cells can be found in Source data.
d, Pulsing frequency of the ERK signal in the wild-type, KrasG12D, and HrasG12V ORS cells represented by peak numbers in the 3-hour ERK activation curve. n=448 cells in 32 hair follicles in 3 control mice, 364 cells in 26 hair follicles in 3 KrasG12D mice, and 364 cells in 26 hair follicles in 3 HrasG12V mice. ****, p<0.0001.
e, Cumulative ERK activity of the wild-type, KrasG12D and HrasG12V ORS cells represented by the area between the curve and the threshold. Cells analyzed were the same as in d. ****, p<0.0001.
Two-sided unpaired t-test was used to calculate p values in d, e. Data are presented as mean with individual data points in d and violin plots with median and quartiles in e. Scale bars, 20 µm.
Time lapses of the Kras mutant hair follicles showed that most ORS cells persistently maintained nuclear exclusion phenotype of the reporter protein, indicating active ERK signaling, in contrast to the frequent switching between nuclear localization and exclusion in the control (Figure 3c, Control and KrasG12D) (Supplementary movie 2). Further quantitative analysis of the ERK activation in single cells based on the ratio of the cytoplasm- versus nucleus-localized reporter showed that Kras mutant ORS cells maintained sustained ERK activation instead of the pulsatile signals observed in the control (Figure 3c’, Control and KrasG12D, one representative cell for each). By identifying and counting peak numbers in the activation curve, we observed that the KrasG12D ORS cells had significantly lower pulsing frequency when compared with the control (Figure 3d). Furthermore, we found that the Kras mutant ORS cells had much more cumulative ERK signal activation estimated by the area above the activation threshold (Figure 3e). These together suggest that KrasG12D converts pulsatile into sustained ERK activation in the ORS cells in the late growth stage, which results in high cumulative ERK signal activation.
To further test whether this ERK activation change is associated with the formation of ORS deformation, we analyzed ERK signal dynamics in the hair follicles carrying another oncogenic Ras mutation, HrasG12V, which could potentially alter ERK signal but which we previously showed does not induce bump-like ORS deformation10. Using a similar genetic approach as for KrasG12D to induce HrasG12V (Lgr5-CreER; LoxP-Hras-LoxP-HrasG12V/+) in the ORS cells did not cause sustained ERK activation. Instead, HrasG12V cells had significantly higher pulsing frequency and lower cumulative ERK activity when compared with KrasG12D (Figure 3c-3e, HrasG12V) (Supplementary movie 2). As Hras and Kras have similar expression levels, and HrasG12V and KrasG12D are controlled by the endogenous transcriptional elements, the difference in ERK activity and phenotype is unlikely due to these mutant genes’ expression levels (Extended Data figure 2b). These data suggest that the bump-like tissue deformation in the Kras mutant hair follicles correlates with the sustained ERK activation specifically induced by KrasG12D.
Since the tissue deformation and abnormal cell behaviors in the Kras mutant hair follicles showed spatial specificity, we wondered whether the ERK signal change induced by KrasG12D was also spatially different across regions of the hair follicle. To address this question, we analyzed ERK signal dynamics based on the different positions of the mutant ORS cells and found that upper and lower ORS cells had similar sustained and high ERK signaling levels (Extended Data figure 2b and 2c). These data suggest that spatially distinct factors either downstream of or parallel to the ERK kinase cause the spatial specificity of KrasG12D induced tissue abnormality.
Altogether, our data demonstrate that KrasG12D converts pulsatile into sustained ERK activation in the ORS of hair follicles at the late growth stage, which may cause the bump-like tissue deformation.
Interrupting sustained ERK activity rescues deformed tissue
To further understand whether sustained ERK activation induced by KrasG12D was the cause of the tissue deformation in the growing hair follicle, we intradermally injected MEK inhibitor (MEKi) to transiently interrupt the sustained ERK signal in the Kras mutant hair follicles. Using the live ERK reporter, we confirmed that MEKi injection can block ERK activation in all the skin cells, including the pulsatile ERK activation in the ORS cells of the late growth hair follicles (Figure 4a). Importantly, through tracking the same tissues over time we discovered that the effect of the drug only lasted for a few hours. The ERK activation reappeared within the time frame of 3 to 6 hours after MEKi injection (Extended Data figure 3a; Figure 4b). Therefore, our approach represents a transient blockage of the ERK activity, which we leveraged to interrupt the sustained ERK signal in the Kras mutant cells instead of fully blocking it.
Figure 4. Interrupting sustained ERK activation both prevent and reverse KrasG12D-induced tissue.

deformation a, Representative two-photon time lapse frames of the wild-type late growth hair follicles expressing the ERK biosensor 2.5 hours after intradermal injection of the MEK inhibitor (MEKi) or vehicle.
b, Representative two-photon time lapse frames of the wild-type late growth hair follicles expressing the ERK biosensor 6 hours after intradermal injection of MEKi.
c, Schematic showing the schedule of imaging and drug treatment of the same mice for testing the consequence of interrupting sustained ERK activation in the KrasG12D hair follicles. MEKi and vehicle were intradermally injected into the left ear and right ear, respectively, of the same mouse.
d, Representative two-photon images of the same KrasG12D hair follicles treated with vehicle or MEKi in the same mouse.
e, Fraction of the KrasG12D hair follicles having tissue deformation after the treatment of MEKi or vehicle. n=3 mice. 104 vehicle-treated and 170 MEKi-treated hair follicles were analyzed. *, p=0.0352. Two-sided unpaired t-test was used to calculate p value. Data are presented as mean ±S.D. with individual data points.
f, Representative two-photon images of the same KrasG12D hair follicles before and after MEKi treatment showing reversal of the tissue deformation.
ORS layers are outlined by dashed lines in a and b. Bump-like tissue deformation in the ORS is outlined by red dashed lines in d and f. Epithelial nuclei were labeled by K14-H2BmCherry (d and f). Scale bars, 20 µm.
To assess whether interrupting sustained ERK activation can affect the ORS deformation phenotype in the Kras mutant hair follicles, we combined live imaging-based longitudinal tracking with the drug injection approach (Figure 4c). We first imaged the hair follicles at the middle and late growth stages on both ears of the Kras mutant mice. Then we intradermally injected MEKi into one ear and vehicle into the other ear as the internal control, once a day for three days. Afterwards, we imaged the same hair follicles again to assess the phenotype. Through this approach, we found that although in the vehicle-injected ear, Kras mutant hair follicles still formed ORS deformation, the vast majority of the hair follicles in the MEKi-injected ear did not show any architecture abnormality (Figure 4a and 4e). More interestingly, for the hair follicles that had already formed tissue deformation prior to the drug treatment, that phenotype was reversed after the three-day MEKi treatment (Figure 4f). Immunostaining of the injected skin showed no elevated cell apoptosis and no sign of cell differentiation in the mutant ORS (Extended Data figure 3b-3e). Moreover, the frequency and pattern of cell proliferation were not changed after MEKi injection, and reducing cell divisions by Mitomycin C injection still led to tissue deformation in the mutant hair follicles (Figure 5a-5d), suggesting that the rescue of the tissue deformation was not due to reduced cell proliferation. Further time lapse analyses within the first two days of MEKi injection uncovered a laterally convergent cell movement, a gradual restoration of migration speed, and a correction of the division angle among the mutant ORS cells (Figure 5e-5g) (Supplementary movie 3). Together, these data show that the sustained ERK activation induced by KrasG12D is required for both the formation and maintenance of the ORS deformation of the mutant hair follicles through modulating specific features of cell migration and division.
Figure 5. Interrupting sustained ERK activation alters specific cell behaviors in KrasG12D mutant hair follicles.

a, Image stack projections of the representative KrasG12D hair follicles treated with vehicle or MEKi in the whole mount skin stained for EdU (magenta) and cell nuclei (DAPI, cyan).
b, Average EdU+ ORS cells in the KrasG12D hair follicles treated with vehicle or MEKi. n=3 mice (60 hair follicles from the skin treated with vehicle and 60 hair follicles from the skin treated with MEKi). ns, not significant, p=0.2906.
c, Ratio of the EdU+ upper ORS cells to the total EdU+ ORS cells in the KrasG12D hair follicles treated with vehicle or MEKi. n=3 mice (60 hair follicles from the skin treated with vehicle and 60 hair follicles from the skin treated with MEKi). ns, not significant, p=0.0898.
d, Representative two-photon images of the same control and KrasG12D hair follicles treated with MMC in the same mouse. Epithelial nuclei were labeled by K14-H2BmCherry. Bump-like tissue deformation in the ORS is outlined by red dashed line.
e, Representative two-photon time lapse frames of the KrasG12D hair follicle after the treatment of MEKi showing laterally convergent movement of the ORS cells within the deformation over 3.5 hours. Phenomenon was observed in 12 hair follicles in 6 mice. Epithelial nuclei were labeled by K14-H2BGFP.
f, Average cell displacement per hour of the KrasG12D ORS cells after MEKi treatment. For the left analysis, n=3 mice on Day 1 and 3 mice on Day 2. For the right analysis, n=10 hair follicles on Day 1 and 12 hair follicles on Day 2. ns, p=0.0876. *, p=0.0350.
g, Percentages of the planar and perpendicular divisions in the KrasG12D hair follicles without and with MEKi treatment based on time lapse analysis. n=3 KrasG12D (same as Figure 2e) and 6 KrasG12D+MEKi mice. *, p=0.0165.
Two-sided unpaired t-test was used to calculate p values in b, c, f and g. Data are presented as mean ±S.D. with individual data points in b, c and f, and stacked bars with mean +S.D. in g. Scale bars, 20 µm.
Discussion
Cancer formation is context-dependent2. Tumor microenvironment, or ‘niche’, is one of the key factors that determine tissue-specific differences1. Understanding niche-specific mechanisms that support or inhibit oncogenesis can inform therapeutic strategies for cancer prevention and treatment. Here, by using intravital imaging to longitudinally track tissues carrying an oncogenic Kras mutation during hair follicle regeneration, we find that precancerous tissue disruption is also niche-dependent. Particularly, spatiotemporally specific conditions in the upper part of the late growth hair follicle enable the KrasG12D mutation to induce abnormal cell behaviors and bump-like deformation of the stem cell layer. Further analyses of the downstream signaling revealed that KrasG12D converts pulsatile into sustained ERK activation to induce tissue deformation, and temporal interruption of this sustained ERK signal can reverse abnormal tissue architecture. These together offer insights into the mechanisms of oncogene-induced tissue disruption, where aberrant signaling dynamics synergize with environmental cues to impair spatiotemporally orchestrated cell arrangement. Given that KrasG12D is a driver mutation for many cancers across multiple organs25, the mechanism we identified have broad implications for understanding the fundamental principles of cancer initiation.
ERK signal controls various cell behaviors such as proliferation, migration, differentiation, and survival, in both normal and pathological conditions. Interestingly, studies found that this pathway can execute these functions through different activation dynamics. For example, in cell culture and fly embryos, ERK activation duration controls proliferation and differentiation decisions26, 27. Furthermore, wave-like intercellular ERK signal propagation has been discovered in various contexts to coordinate collective cell behaviors19–22, 28–30. In a cancer context, in vitro works showed that changes in both intracellular and intercellular ERK activation dynamics can be triggered by oncogenes to promote proliferation18, 31. However, whether and how oncogenic mutations alter ERK signaling dynamics in vivo to disrupt cell coordination was unknown. Here, using a live ERK reporter, we observed different ERK signaling dynamics associated with distinct cell behaviors in normal late growth hair follicles. Pulsatile activity, including wave-like regional signal propagation, was associated with stem cells proliferating and collectively migrating downwards, possibly coordinating these behaviors to sustain tissue growth. Furthermore, we identified sustained ERK activation induced by KrasG12D that can disrupt both intracellular ERK fluctuation and intercellular signal propagation to lead to disordered cell behaviors and ultimately tissue deformation. Interestingly, while temporary ERK inhibition rescued tissue architecture, stem cell hyperproliferation persisted, suggesting that excessive cell proliferation does not drive the initial tissue deformation, as has often been argued5, 8. Instead, we propose that sustained ERK signaling alters specific features of cell migration and division to disrupt tissue architecture. This disruption depends on long-term sustained ERK activity, as even temporary inhibition of the ERK activation (a few hours per day) can reverse the deformation phenotype. This finding has implications for drug delivery in treating precancerous states, as intermittent dosing may restore cell coordination and correct early tissue aberrancies with minimal impact on normal tissue homeostasis.
KrasG12D and HrasG12V had differential effects on ERK signaling dynamics and tissue architecture. While both increased cell proliferation in growing hair follicle 5, 8, 10, only KrasG12D induced sustained ERK activation in ORS cells, causing tissue deformation. The differential effects of KrasG12D and HrasG12V raise the question of how ERK signaling dynamics are regulated. The ERK activation dynamics have been shown in vitro to arise from feedback mechanisms in the pathway32. Interestingly, a recent study showed that Dual Specificity Phosphatase 6 (DUSP6), an ERK specific phosphatase, can modulate the level of ERK signal pulses in skin epidermal cells to initiate their differentiation33. Hair follicle stem cells may use similar mechanisms to achieve pulsatile ERK activation. KrasG12D might induce sustained ERK signal by bypassing or suppressing those feedback mechanisms via processes that HrasG12V does not affect. Moreover, considering Raf activation as a key generator of pulsatile ERK activity34, KrasG12D, but not HrasG12V, may excessively activate Raf, altering the pulsing frequency. Similar differential effects between Ras oncogenes were observed in other contexts, suggesting isoform-specific mechanisms driving tissue disruption25.
We showed spatially specific abnormal cell proliferation and tissue deformation in the KrasG12D mutant hair follicles at late growth stages. However, ERK activation dynamics were changed throughout the hair follicle, suggesting that additional factors downstream of or in synergy with ERK account for the spatial specificity of the mutant phenotype. Notably, proliferation of ORS cells in wild-type hair follicles is spatially patterned along the growth axis16 and single cell transcriptome analysis revealed position-specific signatures within the ORS population11. Interestingly, a previous study showed that hemidesmosome components were differentially expressed at different positions of the ORS in late growth hair follicles35, suggesting that basement membrane may confer spatial regulations. Furthermore, polarized signals sent from the upper hair follicle structures such as bulge and sebaceous gland, or the lower mesenchymal niche, may also contribute to the spatially specific phenotype11, 36. Thoroughly characterizing factors that distinguish these location-specific cell phenotypes and how they are established in normal hair follicles will be critical for understanding niche-dependent responses to oncogenic mutations.
Methods
Mice
K14-H2BGFP37 mice were obtained from E. Fuchs. Lgr5-IRES-CreER mice were obtained from H. Clevers. K14-H2BmCherry38 and ERK-KTR-mClover23 mice were generated and described previously. R26-LoxP-STOP-LoxP-tdTomato39, LoxP-STOP-LoxP-KrasG12D 40, LoxP-Hras-LoxP-HrasG12V 41 and Lgr5-GFP-IRES-CreER42 mice are available from The Jackson Laboratory. K14-H2BmCherry was always bred together with ERK-KTR-mClover to facilitate nuclei identification. Mice were bred to the CD1 background and were housed on ventilated Tecniplast lixit racks with ambient temperature of 22 °C and 50% ± 10% humidity with a 12 h:12 h light:dark cycle (07:00–19:00 light).
To induce KrasG12D in the hair follicle stem cells, Lgr5-IRES-CreER; LoxP-STOP-LoxP-KrasG12D/+ (with or without R26-LoxP-STOP-LoxP-tdTomato; K14-H2BGFP or K14-H2BmCherry; ERK-KTR-mClover) mice were given a single dose of tamoxifen (2mg in corn oil) around postnatal day 18 (P18) by intraperitoneal injection. Sibling mice without KrasG12D and also treated with tamoxifen were used as control. HrasG12V was induced similarly. Live imaging for revisiting the same skin was performed every 3–4 days between P25 and P52 in order to capture different stages of hair cycle. Hair follicle stages were determined based on previous literature43.
For MEKi treatment, 50 μM MEKi (PD0325901) in PBS with 0.5% DMSO was injected intradermally into one ear of the mice once per day for three days. Vehicle (PBS with 0.5% DMSO) was injected into the other ear of the mice at the same time. Live imaging was performed right before the first injection and one day after the last injection.
Experimental and control mice were determined by genotyping and were randomly selected from either sex for experiments. All studies and procedures involving animal subjects were approved by the Institutional Animal Care and Use Committee at Yale School of Medicine and conducted in accordance with the approved animal handling protocol no. 11303. No tumors were anticipated to form within the experimental time window.
Intravital imaging
Imaging procedures were similar to those previously described15. Mice were anaesthetized with vaporized isoflurane delivered by a nose cone (1.5% in oxygen and air). Mice were placed on a warming pad during imaging. The ear was mounted on a custom-made stage and a glass coverslip was placed directly against it. A LaVision TriM Scope II (LaVision Biotec) microscope equipped with a Chameleon Vision II (Coherent) two-photon laser (using 940 nm for exciting green fluorophore) and a Chameleon Discovery (Coherent) two-photon laser (using 1120 nm for exciting red fluorophore) was used to acquire z-stacks of 50–200 μm in 3μm steps through either a Nikon 25x/1.10 or a Nikon 40x/1.15 water immersion objective. Optical sections were scanned with a field of view of 0.08 or 0.20 mm2. For imaging large areas, multiple tiles (up to 56) of optical fields were captured using a motorized stage. Image stacks were saved by ImSpector 7.0 (LaVision). Patterns of hair follicle clusters were used as landmarks for revisiting the same skin area. For capturing cell behaviors and ERK signaling dynamics, serial optical stacks were obtained at 8–10 and 5 minutes intervals respectively to generate time lapses.
EdU cell proliferation assay and immunofluorescence
For EdU cell proliferation assay, mice were intraperitoneally injected once with 50 μg/g EdU, 6 hours before tissue collection. To compare cell proliferation between the KrasG12D and control hair follicles, back skins were dissected and embedded in optimal cutting temperature (OCT; Tissue Tek). Frozen OCT blocks were sectioned at 50 μm to include better 3D structure of the hair follicles. To assess cell proliferation in the hair follicles after drug injection, ear skins were dissected and incubated in 5 mg/ml dispase II solution at 37 °C for 10 min to remove epidermis. The dermal fraction was then fixed in 4% paraformaldehyde in PBS overnight at 4 ºC. EdU labelling was done by using the Click-iT Alexa Fluor 555 kit (Thermofisher) according to the manufacturer’s instructions. DAPI (Thermofisher) was used for nuclear counterstain afterwards. To assess cell apoptosis in the hair follicle after drug injection, whole mount immunofluorescent staining was performed as described previously15. Fixed ear tissues were cut into small pieces and incubated in the blocking solution (5% normal goat serum, 1% bovine serum albumin and 2% Triton X-100 in PBS) for 6–8 hrs at room temperature (RT). Blocked tissues were incubated with primary antibody against cleaved-Caspase 3 (1:200, CST, #9664) diluted in the blocking solution for 24 hrs at RT. Tissues were then washed in PBS with 2% Triton X-100 for 6–8 hrs and incubated with secondary antibody (goat anti-rabbit Alexa568, 1:200, Invitrogen, #A-11011) diluted in the blocking solution and DAPI for 24 hrs at RT. Afterwards, tissues were washed in PBS with 2% Triton X-100 for 6–8 hrs. Stained tissues were then dehydrated in a rising ethanol series: 30%, 50%, 70%, 100% in water, pH 9.0 for 1 hour each, at RT. Dehydrated tissues were transferred into ethyl cinnamate (Sigma) in Eppendorf tubes (polypropylene) for clearing. Cleared tissues were mounted in CoverWel imaging chambers (Sigma) with ethyl cinnamate for imaging. To assess differentiation in the control and KrasG12D hair follicles, mouse ears were dissected and embedded in OCT. Frozen OCT blocks were sectioned at 100 μm and stained for differentiation markers following the procedure similar to the whole mount staining. Primary antibodies: rabbit anti-K14 (1:400, BioLegend, #905301), guinea pig anti-K75 (1:400, ARP, #03-GP-CK6HF) and rabbit anti-GATA3 (1:250, Abcam, #ab199428), secondary antibodies: goat anti-rabbit Alexa568 (1:500, Invitrogen, #A-11011), goat anti-rabbit Alexa488 (1:500, Invitrogen, #A32731), goat anti- guinea pig Alexa546 (1:500, Invitrogen, #A-11074), nuclei dye DAPI (Invitrogen) and SiR-DNA (Spirochrome) were used for staining.
Large areas of 3D image stacks of the tissue sections and whole mount were acquired by the LaVision TriM Scope II (LaVision Biotec) microscope.
Image analysis
Raw image stacks were imported into Fiji (ImageJ, NIH) or Imaris (BitPlane) for analysis. Tiles of optical fields were stitched in Fiji. Selected optical planes or z-projections of sequential optical sections were used to assemble figures. Hair follicles with inadequate resolution to discern their structure and constituent cells, either due to depth or obstruction by other objects, were excluded from the analyses.
Tissue deformation in the ORS was evaluated within the 3D image stacks, defined by the regional emergence of more than two layers of ORS cells from the outer surface of the hair follicle.
For quantifying EdU+ cells and hair follicle length on tissue sections, only the hair follicles whose entire length could be captured in the thick sections were selected for analyses. Hair follicle length was measured from the bottom of the bulge to the bottom of the hair follicles to reflect the growth of the cycling portion. Upper and lower ORS were divided by the midline of the hair follicle length above the bulb. Only the EdU+ cells in the middle plane of the hair follicles were quantified in order to normalize the areas of the ORS between hair follicles. EdU+ ORS cells in the ear whole mount tissue after MEKi injection were quantified in the entire ORS of each 3D hair follicle.
For cell migration analysis, time lapses were imported into Imaris and cell nuclei were identified and tracked by the Spot function. Cell displacement along the hair follicle axis was then calculated based on the distance between nuclei at different time points.
To quantify the ERK signal dynamics, fluorescent intensity of the ERK reporter within the cell nucleus of individual cells at each time point of the time lapse was sample by the Measure function of Fiji. Meanwhile, an average cytoplasmic reporter intensity was sampled similarly for each cell. Specifically, a single optical z-section was picked for each cell and the area of the nucleus versus cytosol was determined by the nuclear reporter K14-H2BmCherry. For each time point, the mean fluorescent intensity within a sampling area, manually selected by drawing a fixed-sized circle in a given cellular compartment, was used to represent the reporter intensity for each cell. The log base 2 of the ratio between the background-subtracted cytoplasmic and nuclear intensity was then plotted in Matlab (MathWorks) to generate the activation curve over time. Peak identification within the activation curve was done by the Findpeak function in Matlab with 0.4 Minimum peak prominence. Accumulative ERK activity was calculated by using the Trapz function in Matlab to measure the area between the activation curve and the arbitrary threshold line (−0.3, based on the wild-type curves).
Hair type analysis
To quantify the frequency of different hair types, clumps of hairs were plucked with forceps from the region of the ear skin where we performed intravital imaging. Hairs were then mounted in anhydrous glycerol (AmericanBio) and imaged under ZEISS SteREO Discovery.V12 equipped with a digital camera (AxioCam MR R3). Hair types were classified based on their different morphologies, as previously reported44.
Flow cytometry
Lgr5-GFP-IRES-CreER; K14-H2BmCherry mice were euthanized at P29 (Anagen) for fluorescence-activated cell sorting (FACS). Anagen stage was confirmed by tissue sections. Back skin was processed to obtain single cell suspension as previously described45. In brief, back skin was placed dermis side down in 0.25% collagenase (Sigma) in HBSS (GIBCO) at 37 °C for 45 min followed by additional 20 min in 0.25% trypsin (GIBCO). Skin cells within dermis were collected by gently scraping with a blunt scalpel and then filtered through a 45 µm strainer. After washing with FACS buffer (PBS, 3% FBS, 2mM EDTA), ORS cells were sorted based on GFP+ and mCherry+ using the Becton Dickinson FACS Aria II outfitted with FACSDiva software v.8.0.1. Cells were sorted into RLT lysis buffer (Qiagen RNeasy Plus Micro) for RNA isolation. FACS profiles were analyzed using FlowJo v.10.6.2.
qRT-PCR
RNA was extracted from the sorted ORS cells using Qiagen RNeasy Plus Micro kit. cDNA was made using SuperScript IV First-Strand Synthesis kit (ThermoFisher). qPCR was conducted using FastStart Universal SYBR green Master (Sigma) on the CFX Connect Real-Time PCR Detection System (Bio-rad). The following primers were used to detect specific genes:
GAPDH: forward: AACTTTGGCATTGTGGAAGG; reverse: ACACATTGGGGGTAGGAACA
Kras: forward: GGAGTACAGTGCAATGAGGGAC; reverse: CCAGGACCATAGGCACATCTTC
Hras: forward: TCGCACTGTTGAGTCTCGGCAG; reverse: TATGCTGCCGAATCTCACGGAC
Statistics and reproducibility
Statistical calculations were performed using Prism 9 (GraphPad). Student’s t-test was used to determine the significance between two groups. A p value of <0.05 was considered significant; precise p values can be found in the figure legends. No statistical method was used to predetermine sample size, but our sample sized are similar to those reported in previous publications9, 13–15. Data distribution was assumed to be normal, but this was not formally tested. Data collection and analysis were not performed blind to the conditions of the experiments. Mouse numbers represent the biological replicates. Sample size and replicates are indicated in the figure legends. All experiments presented in the article were repeated in at least three independent biological replicates.
Data availability
Source data are provided with this study. All other data that support the findings of this study are available from the corresponding author upon reasonable request.
Extended Data
Extended Data Fig. 1. Information on hair cycle and hair type for data interpretation.

a, Schematic showing different stages of the hair follicle regeneration cycle. b, Representative images and percentages of each hair type in the region of the mouse ear skin where intravital imaging was conducted. c, Representative two-photon images of the KrasG12D hair follicles in the same mouse 13 days after induction. In the skin region that hair follicles entered late growth stages, bump-like deformation emerged in the ORS, while in the area of early and middle growth stages, hair follicles were normal. Scale bar, 20 µm.
Extended Data Fig. 2. Characteristics of ERK signal dynamics and expression levels of Kras and Hras.

a, Representative two-photon time lapse frames of the wild type late growth hair follicle expressing the ERK biosensor showing wave-like ERK signal propagation in the ORS. In this example, the wave initiated from the middle ORS and propagated towards both the upper and lower ORS. Scale bar, 20 µm. b, Back skin cells at Anagen were processed for flow cytometry and gated for ORS cells using Lgr5-GFP and K14-H2BmCherry. Sorted ORS cells were then used to conduct qRT-PCR to compare the expression levels between Kras and Hras. n=4 mice. ns, not significant, p=0.0852. Two-sided paired t-test was used to calculate p value. Scale bar, 20 µm. c, Pulsing frequency of the ERK signal in the upper and lower ORS cells of the control and KrasG12D hair follicles. n=236 upper and 162 lower ORS cells in 3 wild type mice, 1666 upper and 91 lower ORS cells in KrasG12D mice. ns, not significant, p=0.6385 and 0.0571. Two-sided unpaired t-test was used to calculate p value. d, Cumulative ERK activity of the upper and lower ORS cells of the control and KrasG12D hair follicles. The same cells in c were analyzed. ns, not significant, p=0.5064, **, p=0.0058. Two-sided unpaired t-test was used to calculate p value. Data are presented as mean with individual data points in c and violin plots with median and quartiles in d. Scale bar, 20 µm.
Extended Data Fig. 3. MEKi injection temporarily inhibits ERK without promoting apoptosis or differentiation.
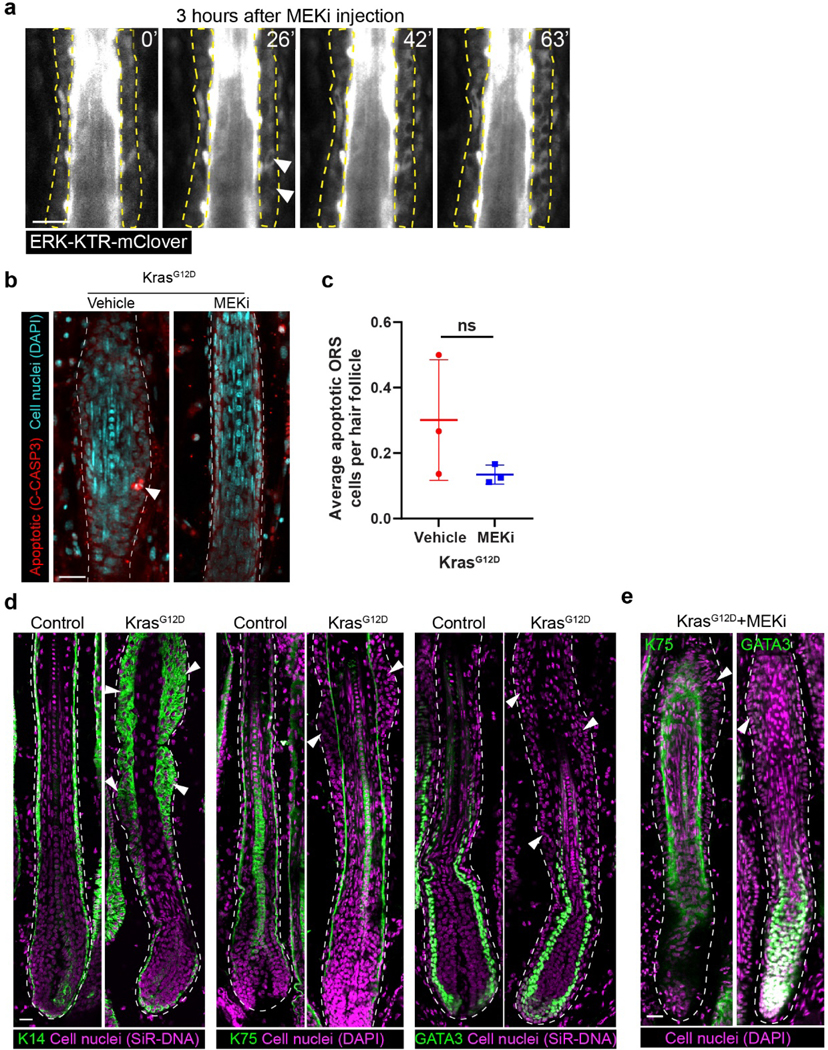
a, Representative two-photon time lapse frames of the wild type late growth hair follicles expressing the ERK biosensor 3 hours after intradermal injection of MEKi. Note that ERK activation began to emerge in the ORS (arrowheads) shortly after the time lapse started. b, Representative KrasG12D hair follicles treated with vehicle or MEKi in the whole mount skin stained for cleaved-Caspase3 (C-CASP3, red) and cell nuclei (DAPI, cyan). Apoptotic cell is indicated by arrowhead. c, Average numbers of apoptotic cells in the KrasG12D hair follicles treated with vehicle or MEKi. n=3 mice (102 hair follicles from the skin treated with vehicle and 115 hair follicles from the skin treated with MEKi). ns, not significant, p=0.1964. d, Representative images of the control and KrasG12D hair follicles stained for basal marker K14 or differentiation markers K75 and GATA3 (green). Cell nuclei were labeled by SiR-DNA or DAPI (magenta). Representative tissue deformations in the ORS are indicated by arrowheads. e, Representative images of the KrasG12D hair follicles after MEKi treatment stained for differentiation markers K75 and GATA3 (green). Cell nuclei were labeled by DAPI (magenta). Representative tissue deformations in the ORS are indicated by arrowheads. Border of the hair follicle is marked by white dashed lines in b, d and e. Two-sided unpaired t-test was used to calculate p values. Data are presented as mean ±S.D. with individual data points in c. Scale bars, 20 µm.
Supplementary Material
Acknowledgments
We thank the Greco lab members for helpful discussion and thoughtful feedback. We thank Hans Clevers for the Lgr5-IRES-CreER mice, Elaine Fuchs for the K14-H2BGFP mice, Mandar Deepak Muzumdar for the LoxP-STOP-LoxP-KrasG12D mice and Slobodan Beronja for the LoxP-Hras-LoxP-HrasG12V mice. V.G. was a New York Stem Cell Foundation Robertson Investigator and HHMI Scholar. T.X. was supported by the New York Stem Cell Foundation Druckenmiller Fellowship and the Dermatology Foundation Research Grant. S.G. was supported by the Human Frontier Science Program. The Regot Lab is supported by an NIH NIGMS R35 (R35GM133499) and an NIH NCI R01 (R01CA279546). Research reported in this publication was supported by the National Institute of Arthritis & Musculoskeletal & Skin Diseases of the National Institutes of Health under award number R01AR063663 (V.G. as PI) and R01AR067755 (V.G. as PI), and the National Institute on Aging of the National Institutes of Health under award number DP1AG066590 (V.G. as PI). The content is solely the responsibility of the authors and does not necessarily represent the official views of the National Institutes of Health.
Footnotes
Author Contributions
T.X., S.R. and V.G. designed the experiments. T.X. performed the experiments and analyzed the data. S.G. characterized and maintained the KrasG12D and HrasG12V mice. H.W. recorded some of the time lapses after MEKi injection. D.G. assisted with the two-photon imaging and performed cell migration analysis. C.M.-M. performed FACS work. H.M., H.A.P. and H.F. assisted with data analysis. T.X, K.S., L.E.G., S.R. and V.G. wrote the manuscript with input from all the authors.
Competing Interests
The authors declare no competing financial or non-financial interests.
References
- 1.Bissell MJ & Hines WC Why don’t we get more cancer? A proposed role of the microenvironment in restraining cancer progression. Nat Med 17, 320–329 (2011). [DOI] [PMC free article] [PubMed] [Google Scholar]
- 2.Schneider G, Schmidt-Supprian M, Rad R & Saur D Tissue-specific tumorigenesis: context matters. Nat Rev Cancer 17, 239–253 (2017). [DOI] [PMC free article] [PubMed] [Google Scholar]
- 3.Kakiuchi N & Ogawa S Clonal expansion in non-cancer tissues. Nat Rev Cancer 21, 239–256 (2021). [DOI] [PubMed] [Google Scholar]
- 4.Amberg N et al. Mouse models of nonmelanoma skin cancer. Methods Mol Biol 1267, 217–250 (2015). [DOI] [PubMed] [Google Scholar]
- 5.Lapouge G et al. Identifying the cellular origin of squamous skin tumors. Proc Natl Acad Sci U S A 108, 7431–7436 (2011). [DOI] [PMC free article] [PubMed] [Google Scholar]
- 6.Latil M et al. Cell-Type-Specific Chromatin States Differentially Prime Squamous Cell Carcinoma Tumor-Initiating Cells for Epithelial to Mesenchymal Transition. Cell Stem Cell 20, 191–204 e195 (2017). [DOI] [PMC free article] [PubMed] [Google Scholar]
- 7.White AC et al. Stem cell quiescence acts as a tumour suppressor in squamous tumours. Nat Cell Biol 16, 99–107 (2014). [DOI] [PMC free article] [PubMed] [Google Scholar]
- 8.White AC et al. Defining the origins of Ras/p53-mediated squamous cell carcinoma. Proc Natl Acad Sci U S A 108, 7425–7430 (2011). [DOI] [PMC free article] [PubMed] [Google Scholar]
- 9.Brown S et al. Correction of aberrant growth preserves tissue homeostasis. Nature 548, 334–337 (2017). [DOI] [PMC free article] [PubMed] [Google Scholar]
- 10.Pineda CM et al. Hair follicle regeneration suppresses Ras-driven oncogenic growth. J Cell Biol 218, 3212–3222 (2019). [DOI] [PMC free article] [PubMed] [Google Scholar]
- 11.Joost S et al. The Molecular Anatomy of Mouse Skin during Hair Growth and Rest. Cell Stem Cell 26, 441–457 e447 (2020). [DOI] [PubMed] [Google Scholar]
- 12.Lee J & Tumbar T Hairy tale of signaling in hair follicle development and cycling. Semin Cell Dev Biol 23, 906–916 (2012). [DOI] [PMC free article] [PubMed] [Google Scholar]
- 13.Rompolas P et al. Live imaging of stem cell and progeny behaviour in physiological hair-follicle regeneration. Nature 487, 496–499 (2012). [DOI] [PMC free article] [PubMed] [Google Scholar]
- 14.Rompolas P, Mesa KR & Greco V Spatial organization within a niche as a determinant of stem-cell fate. Nature 502, 513–518 (2013). [DOI] [PMC free article] [PubMed] [Google Scholar]
- 15.Xin T, Gonzalez D, Rompolas P & Greco V Flexible fate determination ensures robust differentiation in the hair follicle. Nat Cell Biol 20, 1361–1369 (2018). [DOI] [PMC free article] [PubMed] [Google Scholar]
- 16.Sequeira I & Nicolas JF Redefining the structure of the hair follicle by 3D clonal analysis. Development 139, 3741–3751 (2012). [DOI] [PubMed] [Google Scholar]
- 17.Morrow A, Underwood J, Seldin L, Hinnant T & Lechler T Regulated spindle orientation buffers tissue growth in the epidermis. Elife 8 (2019). [DOI] [PMC free article] [PubMed] [Google Scholar]
- 18.Aikin TJ, Peterson AF, Pokrass MJ, Clark HR & Regot S MAPK activity dynamics regulate non-cell autonomous effects of oncogene expression. Elife 9 (2020). [DOI] [PMC free article] [PubMed] [Google Scholar]
- 19.Aoki K et al. Propagating Wave of ERK Activation Orients Collective Cell Migration. Dev Cell 43, 305–317 e305 (2017). [DOI] [PubMed] [Google Scholar]
- 20.De Simone A et al. Control of osteoblast regeneration by a train of Erk activity waves. Nature 590, 129–133 (2021). [DOI] [PMC free article] [PubMed] [Google Scholar]
- 21.Hino N et al. ERK-Mediated Mechanochemical Waves Direct Collective Cell Polarization. Dev Cell 53, 646–660 e648 (2020). [DOI] [PubMed] [Google Scholar]
- 22.Hiratsuka T et al. Intercellular propagation of extracellular signal-regulated kinase activation revealed by in vivo imaging of mouse skin. Elife 4, e05178 (2015). [DOI] [PMC free article] [PubMed] [Google Scholar]
- 23.Pokrass MJ et al. Cell-Cycle-Dependent ERK Signaling Dynamics Direct Fate Specification in the Mammalian Preimplantation Embryo. Dev Cell 55, 328–340 e325 (2020). [DOI] [PMC free article] [PubMed] [Google Scholar]
- 24.Regot S, Hughey JJ, Bajar BT, Carrasco S & Covert MW High-sensitivity measurements of multiple kinase activities in live single cells. Cell 157, 1724–1734 (2014). [DOI] [PMC free article] [PubMed] [Google Scholar]
- 25.Li S, Balmain A & Counter CM A model for RAS mutation patterns in cancers: finding the sweet spot. Nat Rev Cancer 18, 767–777 (2018). [DOI] [PubMed] [Google Scholar]
- 26.Johnson HE & Toettcher JE Signaling Dynamics Control Cell Fate in the Early Drosophila Embryo. Dev Cell 48, 361–370 e363 (2019). [DOI] [PMC free article] [PubMed] [Google Scholar]
- 27.Marshall CJ Specificity of receptor tyrosine kinase signaling: transient versus sustained extracellular signal-regulated kinase activation. Cell 80, 179–185 (1995). [DOI] [PubMed] [Google Scholar]
- 28.Gagliardi PA et al. Collective ERK/Akt activity waves orchestrate epithelial homeostasis by driving apoptosis-induced survival. Dev Cell 56, 1712–1726 e1716 (2021). [DOI] [PubMed] [Google Scholar]
- 29.Pond KW et al. Live-cell imaging in human colonic monolayers reveals ERK waves limit the stem cell compartment to maintain epithelial homeostasis. Elife 11, e78837 (2022). [DOI] [PMC free article] [PubMed] [Google Scholar]
- 30.Valon L et al. Robustness of epithelial sealing is an emerging property of local ERK feedback driven by cell elimination. Dev Cell 56, 1700–1711 e1708 (2021). [DOI] [PMC free article] [PubMed] [Google Scholar]
- 31.Bugaj LJ et al. Cancer mutations and targeted drugs can disrupt dynamic signal encoding by the Ras-Erk pathway. Science 361 (2018). [DOI] [PMC free article] [PubMed] [Google Scholar]
- 32.Dessauges C et al. Optogenetic actuator - ERK biosensor circuits identify MAPK network nodes that shape ERK dynamics. Mol Syst Biol 18, e10670 (2022). [DOI] [PMC free article] [PubMed] [Google Scholar]
- 33.Hiratsuka T, Bordeu I, Pruessner G & Watt FM Regulation of ERK basal and pulsatile activity control proliferation and exit from the stem cell compartment in mammalian epidermis. Proc Natl Acad Sci U S A 117, 17796–17807 (2020). [DOI] [PMC free article] [PubMed] [Google Scholar]
- 34.Aoki K et al. Stochastic ERK activation induced by noise and cell-to-cell propagation regulates cell density-dependent proliferation. Mol Cell 52, 529–540 (2013). [DOI] [PubMed] [Google Scholar]
- 35.Sugawara K et al. Spatial and temporal control of laminin-332 (5) and −511 (10) expression during induction of anagen hair growth. J Histochem Cytochem 55, 43–55 (2007). [DOI] [PMC free article] [PubMed] [Google Scholar]
- 36.Rezza A et al. Signaling Networks among Stem Cell Precursors, Transit-Amplifying Progenitors, and their Niche in Developing Hair Follicles. Cell Rep 14, 3001–3018 (2016). [DOI] [PMC free article] [PubMed] [Google Scholar]
Methods-only references
- 37.Tumbar T et al. Defining the epithelial stem cell niche in skin. Science 303, 359–363 (2004). [DOI] [PMC free article] [PubMed] [Google Scholar]
- 38.Mesa KR et al. Niche-induced cell death and epithelial phagocytosis regulate hair follicle stem cell pool. Nature 522, 94–97 (2015). [DOI] [PMC free article] [PubMed] [Google Scholar]
- 39.Madisen L et al. A robust and high-throughput Cre reporting and characterization system for the whole mouse brain. Nat Neurosci 13, 133–140 (2010). [DOI] [PMC free article] [PubMed] [Google Scholar]
- 40.Jackson EL et al. Analysis of lung tumor initiation and progression using conditional expression of oncogenic K-ras. Genes Dev 15, 3243–3248 (2001). [DOI] [PMC free article] [PubMed] [Google Scholar]
- 41.Chen X et al. Endogenous expression of Hras(G12V) induces developmental defects and neoplasms with copy number imbalances of the oncogene. Proc Natl Acad Sci U S A 106, 7979–7984 (2009). [DOI] [PMC free article] [PubMed] [Google Scholar]
- 42.Barker N et al. Identification of stem cells in small intestine and colon by marker gene Lgr5. Nature 449, 1003–1007 (2007). [DOI] [PubMed] [Google Scholar]
- 43.Muller-Rover S et al. A comprehensive guide for the accurate classification of murine hair follicles in distinct hair cycle stages. J Invest Dermatol 117, 3–15 (2001). [DOI] [PubMed] [Google Scholar]
- 44.Chi W, Wu E & Morgan BA Dermal papilla cell number specifies hair size, shape and cycling and its reduction causes follicular decline. Development 140, 1676–1683 (2013). [DOI] [PMC free article] [PubMed] [Google Scholar]
- 45.Greco V et al. A two-step mechanism for stem cell activation during hair regeneration. Cell Stem Cell 4, 155–169 (2009). [DOI] [PMC free article] [PubMed] [Google Scholar]
Associated Data
This section collects any data citations, data availability statements, or supplementary materials included in this article.
Supplementary Materials
Data Availability Statement
Source data are provided with this study. All other data that support the findings of this study are available from the corresponding author upon reasonable request.