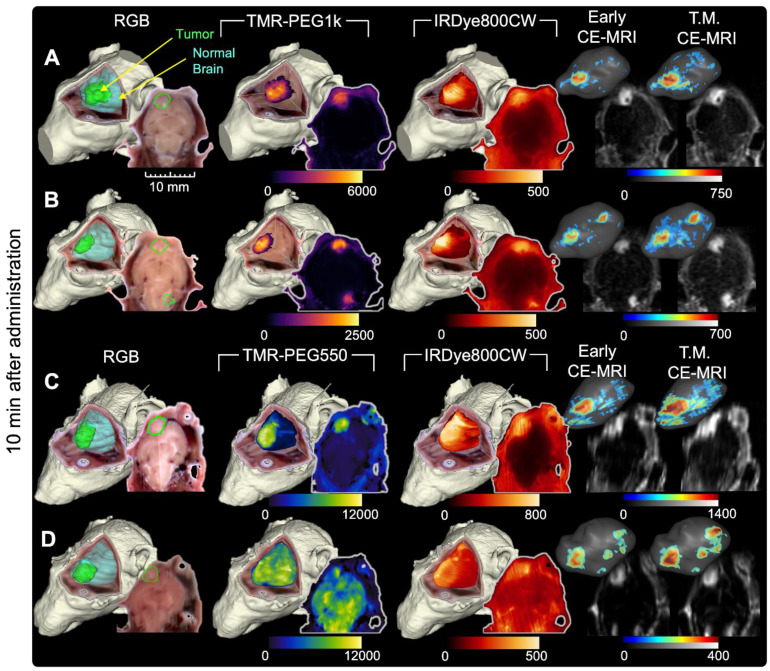
Figure 2.
Representative cryo-imaging and CE-MRI image volumes of mice with U251 tumors 10 min after agent administration. Each row shows data for one animal. (A, B) Images of animals administered TMR-PEG1k and IRDye800CW. Columns from left to right show the RGB rendering with tumor and normal brain surfaces, TMR-PEG1k, IRDye800CW, Early CE-MRI and T.M. CE-MRI. (C, D) Images of animals administered TMR-PEG550 and IRDye800CW with an analogous column arrangement as described for (A) and (B). Units for fluorescence volumes are relative fluorescence units (RFU). The 10 mm scale bar applies to all 2-D images shown. No minimum threshold values were applied to the 2-D images. The fluorescence volume renderings were displayed as a MIP with an intensity threshold set to twice that of a naïve brain for that fluorescence channel. The 3-D renderings for the CE-MRI brain volumes were visualized with a signal intensity threshold of 4 times the noise floor.

