

Abstract
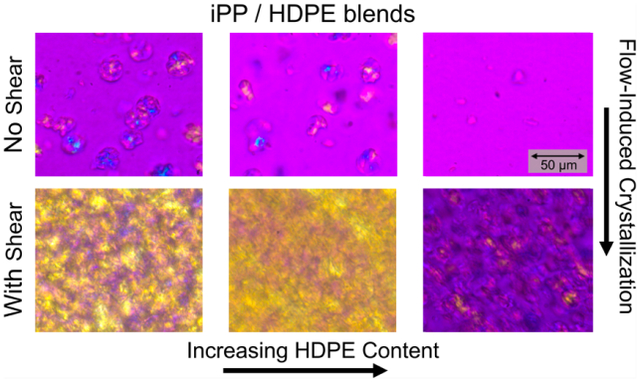
Polyolefins, including high-density polyethylene (HDPE) and isotactic polypropylene (iPP), account for over half of the worldwide plastics market and have wide-ranging applications. Recycling of these materials is hindered due to separation difficulties as co-mingled blends of HDPE and iPP often exhibit brittle mechanical behavior because phase separated domains detach under stress due to low interfacial adhesion. Motivated to improve mechanical properties of mixed recyclates during processing, this work examines the effect of shear on the crystallization kinetics and rheological properties of HDPE–iPP blends utilizing a combination of differential scanning calorimetry (DSC), rheo-Raman spectroscopy, polarized optical microscopy, and scanning electron microscopy (SEM). In the quiescent experiments, the crystallization temperature as a function of blend composition exhibits a distinct decrease when the iPP forms the droplet phase, as expected, due to fractionated crystallization. In the presence of shear, we find elongated domains due to high capillary number. Unexpectedly, we find a compositional dependence to the flow-induced crystallization (FIC) of iPP: stronger FIC is observed in all blends compared to the pure iPP. Moreover, the flow completely counteracts the reduced crystallization arising from fractionated crystallization, indicating that the flow is able to induce nucleation in droplets to an extent such that it offsets the reduction in active nucleating agents in finite size droplets. We attribute these effects to differing microflow fields in the various morphologies as the iPP domains deform under shear.
Graphical Abstract
INTRODUCTION
The two most abundant plastics produced worldwide are polyethylene (PE) and polypropylene (PP).1,2 High-density polyethylene (HDPE) and isotactic polypropylene (iPP) are often found together in mixed waste streams and are difficult to separate on an industrial scale due to their similar densities and hydrocarbon backbones.3–6 Thus, the mechanical properties of blends of PE and PP have become a subject of great economic and sustainability interest in the use of mixed plastics as recyclates.6–10 The effectiveness of blending depends on the miscibility of the components, however, and PE and PP are immiscible, resulting in phase separated materials with poor interfacial adhesion.11,12 This leads to composite material that are often brittle and have poor impact strength.7,13–15
Recent efforts to improve mechanical properties in PE–iPP blends have focused on the addition of compatibilizers,7,15–23 controlling the molar mass distributions,24 and the use of various processing techniques.25–29 For example, Eagan et al.7 and Shen et al.18 have both utilized low concentrations of block polymer compatibilizers to achieve tensile properties similar to those of the individual blend components. López-Barrón et al.16 have shown that blends with low concentrations of an industrially made comb block copolymer can induce strain hardening in HDPE–iPP blends. Processing strategies such as hot drawing of an extruded PE–PP blend to produce microfibrillar composites have been implemented by Rosales et al.,27 yielding microfibrillar blends that exhibited improved fracture and impact behaviors to those of the unprocessed blends. Additionally, Qu et al.26 have demonstrated an industrial-scale physical alloying technique that produces PE–PP blends with an ordered honeycomb structure with improved tensile properties in comparison to the individual components. Efforts such as these demonstrate the great interest in achieving mixed polyolefin recyclates with enhanced mechanical properties.
As semicrystalline polymers, the material properties of PE and PP depend on their relative amounts of crystalline and amorphous domains as well as the crystallization kinetics. For PE–PP blends, the melt morphology and rheological behavior of each component will also affect the crystallization kinetics and final properties of the blended product. The internal morphology of PE–PP blends depends on a wide variety of factors, including the composition,10,30,31 polymer architecture,8 flow and processing histories,3,32–35 viscosity ratio,6,36,37 and additives such as compatibilizers.14,16,38 These factors can also directly affect the crystallization kinetics in a blend. The combined morphology and crystallization relationship will determine the final properties, yet this complex structure–processing–property relationship is still not well understood.
Previous reports on the crystallization kinetics in PE–iPP blends without shear have shown conflicting results on the changes due to blend composition. For polymer blends, when small droplets of one phase are dispersed in a matrix, the finite-size of discrete droplets can reduce the crystallization rate and temperature due to fractionated crystallization.39,40 Fractionated crystallization occurs when there are more droplets than active nuclei, thus suppressing crystallization of the polymer in droplets without active nucleating agents. Fractionated crystallization becomes more apparent as the droplet size decreases.40 The reduced crystallization rate of the minority phase can lead to coincident crystallization where both phases crystallize at the same time,13 and has been shown experimentally by Morales et al.41 for blends of PP droplets in a matrix of linear low-density PE. Additionally, Martuscelli et al.42 have shown that the presence of PP droplets reduces crystallization rate of a HDPE matrix. On the other hand, for PE–PP blends with PP as the majority component, some studies have shown enhanced crystallization behavior of the PP with the PE acting as nucleating agents for PP matrix, though the results depended on the type and grade of PE used.13 Other studies have found that PE retards the crystallization of the iPP.10,43,44 A more recent study also showed that a crystalline PP matrix can induce surface nucleation in dispersed PE droplets.45 Several possible phenomena besides fractionated crystallization have been also postulated to describe the suppression of crystallization in polymer blends, including the migration of active nuclei from one phase to another during the mixing process and the partial miscibility of two phases.10,44–46 Overall, the crystallization behavior of PE–PP blends is complex, and the poor adhesion between immiscible phases makes it difficult to predict the final mechanical properties. This is especially true when shear is applied during processing where the kinetics of crystallization in multi-component materials is poorly understood.
Polyolefins are typically processed in the melt state, and there is a well-developed literature on single component crystallization under flow, a phenomenon called flow-induced crystallization (FIC).47–56 In FIC of single component melts, the polymer chains align and are stretched by the external flow field, lowering the thermodynamic barrier toward crystal formation and enhancing the crystallization kinetics.34,55,57 For polymer blends, this becomes more complex due to the effect of the flow on the morphology of the phase separated domains. On the one hand, depending on the viscosity ratio and the shear rate, the flow field can deform the dispersed phase, leading to stronger microflow fields within the dispersed phase that can lead to FIC within that phase.58,59 Presumably, the crystal structure and crystallization kinetics would change as the shear rate increases until sufficiently high shear conditions are met, and the droplets are broken up by flow, decreasing the average droplet size.32 This reduction in droplet size could lead to a retardation of the crystallization due to fractionated crystallization or other effects discussed previously. In this case, the flow would be suppressing rather than inducing crystallization in the dispersed phase. For the polymer matrix as well as the droplet phases, the effect of flow on the crystallization behavior is worthy of further explanation and investigation.
Previous work on the effect of flow on polyolefin blend crystallization has mainly focused on the formation of oriented shish-kebab structures under various processing conditions,60–65 though a few studies have examined the change in crystallization kinetics in polyolefin blends under shear.66–68 Yu et al.66 experimentally investigated FIC in blends of iPP and poly(ethylene-co-octene) (PEOc) with steady shear rheology and found that blends with majority iPP exhibited enhanced FIC over that of pure iPP under isothermal conditions. The authors extended this work to theoretical modeling of iPP and PEOc blends both under shear and elongational flows.67 The model was consistent with their experimental results and also showed that elongational flow had a stronger effect than shear on the FIC. More recently, Janchai and Yamaguchi68 used polarized optical microscopy to compare the nonisothermal crystallization kinetics of blends of iPP–LDPE and iPP–HDPE to pure iPP both with and without shear. The FIC of the iPP was enhanced by the addition of 30% by mass LDPE, whereas iPP–HDPE blends showed no FIC enhancement over iPP alone under their experimental conditions. These works indicate that blending can enhance the FIC behavior of iPP when iPP is the majority component. To our knowledge no work has looked at the combined effects of composition, morphology, and flow on the crystallization kinetics of each component in polyolefin blends.
To begin to address these phenomena, we utilize a multimodal approach to capture both the melt state rheology and the crystallization behavior for polymer blends under shear. Typical methods for characterizing the crystallization kinetics for multicomponent systems include differential scanning calorimetry (DSC) and polarized optical microscopy, however, these methods do not typically allow for shear to be applied to the sample. Rheological measurements, on the other hand, are useful for probing crystallization kinetics because the modulus increases by orders of magnitude as the crystalline network spans the gap and the polymer solidifies.69–71 Recent work by Huang et al.10 used a combination of DSC, optical microscopy with an attached temperature cell, and rheo-Raman spectroscopy to show that, under quiescent conditions, the addition of HDPE suppressed the crystallization of iPP, with a dependence on the blend composition and morphology. To expand on this work with the case of shear, utilization of rheo-Raman spectroscopy allows for application of a well-defined deformation and temperature profile and enables determination of the effect of shear on each component in the blend. Knowledge of the rheological behavior and the effect of shear on multiple components is critical for process line design and control, especially if the components are crystallizing at different times as is typical for mixed recyclates.
Here, we examine the effect of HDPE–iPP blend composition on crystallization with and without a short shear pulse, at a fixed cooling rate. Five compositions—from pure iPP to pure HDPE—were prepared to probe this dependence and track the domain morphological changes that occur due to shear. We observe an unexpected enhancement of FIC in the blends relative to the pure iPP. And furthermore, we find that the fractionated crystallization of iPP droplets which is observed under quiescent conditions is completely counteracted by the shear, indicating that the nucleation induced by the flow is able to overcome the reduction in active nucleating agents in finite size droplets. We consider the effects of the microflow fields as the primary driver of these phenomena.
EXPERIMENTAL SECTION
Sample Preparation.
High-density polyethylene (HDPE) and isotactic polypropylene (iPP) used in this study were generously provided by Braskem. The HDPE is commercially known as HD7000C and contains added antioxidants (melt flow rate (MFR) = 0.35 g/10 min at 190 °C). The iPP is known as Barefoot 6021 with added antioxidants (MFR = 2 g/10 min at 230 °C). The molecular masses of the polymer pellets were measured via high-temperature size exclusion chromatography (HT-SEC), giving a mass average relative molecular mass Mw = 110 kg/mol and dispersity Đ = 5.3 for HDPE, and Mw = 340 kg/mol and Đ = 5.3 for iPP. After melt processing, the molecular masses of the extruded filaments were measured again for each polymer, giving Mw = 95 kg/mol and Đ = 4.6 for HDPE, and Mw = 290 kg/mol and Đ = 4.4 for iPP. The decrease in Mw and Đ after processing indicate a selective degradation and/or breakage of larger chains due to mechanochemical degradation.72,73
Samples were prepared from HDPE and/or iPP using a twin-screw compounder manufactured by Daca Instruments. Polymer pellets were blended in the compounder for 5 min at 200 °C and 150 rpm and then extruded as a long filament that was cut into short segments for experiments. Blends were prepared at mass fractions of 0, 30, 50, 70, and 100% HDPE to iPP, in order to explore a range of blend morphologies.
High-Temperature Size Exclusion Chromatography (HT-SEC).
HT-SEC was performed on a Polymer Char SEC-IR instrument equipped with an IR4 detector, a Wyatt Technology Dawn Heleos II multiangle light scattering detector (MALS) (18 angles), and a four-capillary differential viscometer. All measurements were taken using 1,2,4-trichlorobenzene (TCB) at 160 °C containing 300 mg/kg Irganox 1010 as the eluent and three Tosoh HT columns (two Tosoh TSKgel GMHHR-H (S) HT2, 13 μm mixed bed, 7.8 mm ID × 30 cm columns and one Tosoh TSKgel GMHHR-H (20) HT2, 20 μm, 7.8 mm ID × 30 cm column with an exclusion limit ≈ 4 × 10⁸ g/mol) as the stationary phase. Samples were dissolved at a concentration between 1 and 2 mg/mL at 160 °C for 60 min with gentle agitation under a nitrogen atmosphere, and 5 μL of n-dodecane was added to the sample as a flow rate marker. Samples were eluted at a flow rate of 1 mL/min.
Narrow dispersity polystyrene standards (EasyCal, Agilent) were used for column calibration. The infrared (IR) response was calculated using 6 α-olefin copolymer linear low-density PE standards consisting of poly(ethylene-stat-1-octene) with short chain branching (SCB) numbers ranging from 2.6 to 45.3 CH3/1000 carbons (Polymer Char) for HDPE samples or a series of PE–PP blends for iPP samples.74 For the latter, the total IR response was plotted against the SCB content (measured offline using nuclear magnetic resonance) and a calibration curve generated from this data. These standards were used to calibrate the methyl and alkyl IR absorption bands during detection. Calibration and data analysis were conducted with proprietary software from the instrument vendor. Representative IR traces, Mark–Houwink plots, and detailed results from data analyses are included in the Supporting Information. All injections were done at least two times, and the reported error on all measurements is one standard deviation of the mean.
Rheology and Raman Spectroscopy.
The primary instrument used in this study is a rheo-Raman instrument composed of a Raman microscope (Thermo Fisher DXR Raman Microscope) coupled to a rotational rheometer (Anton Paar MCR 502 WESP) via a fiber optic probe to simultaneously measure rheology and Raman spectroscopy.75 All measurements were taken using an 8 mm stainless steel parallel-plate upper geometry and under a nitrogen atmosphere. The gap was zeroed after equilibration at 200 °C for 10 min. Samples were melted at 200 °C and compressed slowly to a 0.5 mm gap. To provide a consistent shear history for all samples, the loaded sample was sheared at 200 °C for 5 min at a rate of 0.1 s−1. After annealing, the sample was cooled to 160 °C at 5 °C/min and then cooled to 100 °C at 1 °C/min for crystallization experiments. Oscillatory shear measurements were performed during the cooling process at a frequency of 1 Hz and strain amplitude of 0.004. To prevent sample detachment during crystallization, the amplitude was reduced to 0.0025 and a compressive force of 1 N was applied when the normal force dropped below a threshold of −1 N due to sample shrinkage. To determine the effect of shear on the crystallization kinetics, the cooling experiments were repeated with an added shear pulse step when the sample reached 142 °C using a shear rate of 10 s−1 for 6 s. The sample was then allowed to continue cooling to 100 °C. This protocol was chosen to provide a high strain to the polymer while attempting to minimize edge fracture. Raman spectra were collected every 20 s, concurrently with the rheology measurements, using a 780 nm laser at a power of 24 mW. A plot of the temperature and shear protocol is included in Figure S2.
For determination of the elastic and viscous moduli of the homopolymer melts, small-amplitude oscillatory shear (SAOS) rheology was performed on HDPE and iPP using a strain-controlled TA Instruments ARES-G2 fitted with 8 mm stainless steel parallel plates and a forced convection oven under a nitrogen atmosphere. The gap was zeroed after the plates were equilibrated at 200 °C for 30 min. The polymer was then loaded on the hot plates and compressed to a 0.5 mm gap. The gap was held constant by automatically compensating for the thermal expansion of the 8 mm parallel plates. Frequency sweeps were performed at 190, 170, 150, and 140 °C for iPP and at the same temperatures for HDPE along with 130 °C. The frequency range was 100 to 0.01 rad/s at the higher temperatures and 100 to 0.1 rad/s at lower temperatures, with 10 points per decade and a strain amplitude of 0.05.
Polarized Optical Microscopy.
In order to visualize the effects of the shear and temperature protocol on the development of crystalline structure at the 1 to 100 μm level and also to gain qualitative information regarding chain alignment, we utilize transmission polarized optical microscopy in conjunction with a temperature-controlled shear cell. The shear and temperature protocols are applied via a Linkam shear cell (CSS450) which allows optical access. The shear cell is rotated in the microscope so that the flow direction at the point of imaging is at an angle of −40° with respect to the bottom polarizer. (Ideally, the shear cell would be at an angle of −45°, but a geometrical constraint prevents this.) For the imaging, we use an Olympus BX51 optical microscope in transmission mode with a full wave retardation waveplate (530 nm) placed past the objective lens, in conjunction with crossed polarizers, placed in the optical train before the condenser and after the waveplate. The slow axis of the retardation plate is perpendicular to the flow direction. In such a geometry of flow and optical components, the transmitted colors provide qualitative information regarding chain orientation relative to flow. Woo and Lee76 provide examples of the use of retardation plates for measurement of chain orientation. In these experiments, the thickness is 100 μm rather than the 500 μm used in the rheo-Raman measurements. As it will be shown, the droplet sizes are significantly less than the Linkam gap, so any thickness dependent effects should be minimal.
Differential Scanning Calorimetry (DSC).
DSC was performed on a TA Instruments DSC2500 calorimeter under a nitrogen atmosphere purge. Similar to the rheo-Raman experiments, the samples were heated to 200 °C and annealed for 5 min, cooled at 5 °C/min to 160 °C, cooled at 1 °C/min to 40 °C, heated at 5 °C/min to 100 °C, and heated at 1 °C/min to 190 °C. Instrument calibrations were performed according to the manufacturer specifications.
Scanning Electron Microscopy (SEM).
For SEM experiments, sample disks from rheo-Raman experiments both with and without a shear pulse were cryo-fractured near the outer edge and placed in a cross-section vise holder with the fractured surface facing upward. A schematic of the fracturing procedure is shown in Figure S3. Fracturing the sample near the outer edge allows for the shear direction to be parallel to the fracture surface. The samples were then imaged using a JEOL 7800F at 1 kV. Images were obtained from multiple areas near the center of the sample surface to characterize the blend morphology. Image analysis was performed using the ImageJ software to measure droplet and thread sizes.
Raman Analysis through Multivariate Curve Resolution with Alternating Least-Squares (MCR-ALS).
The percent crystallinity of each component in the blends was determined through multivariate curve resolution with alternating least-squares (MCR-ALS) of Raman spectra following a previously reported procedure.10 Briefly, the Raman spectra of the blends were deconvoluted into four individual components, which we term the basis spectra, using a publicly available MATLAB toolbox for MCR-ALS developed by Jaumot et al.77,78 The spectra from a single cooling experiment from 160 to 100 °C were baseline-corrected, normalized, and input into the toolbox. The expectation is that the four basis spectra will correspond closely to these four simple spectral cases: pure PE melt; pure iPP melt; high crystallinity HDPE; and high crystallinity iPP. To help ensure this outcome, we further input four experimentally measured single component spectra: (i) semicrystalline HDPE at 100 °C, (ii) amorphous HDPE at 150 °C, (iii) semicrystalline iPP at 100 °C, and (iv) amorphous iPP at 150 °C (Figure 1a). The four basis spectra produced by MCR-ALS do in fact closely resemble the four single component experimental spectra. For each spectrum in the cooling experiment, MCR-ALS produces the relative abundance of each of the basis spectra. The crystalline mass fraction of each component is then determined by summing the weighted semicrystalline and amorphous spectral contributions of that component, followed by traditional peak-fitting analyses. The method of Strobl and Hagedorn79 was followed to determine the crystallinity of the HDPE by computing the ratio of the crystalline peak intensity at 1416 cm−1 to the total twisting vibrational peak intensity at 1300 cm−1. For iPP, the crystallinity was determined following the method of Nielsen et al.80 by computing the ratio of the 808 cm−1 peak intensity to the total integrated intensity from 780 to 880 cm−1. Analysis in this region is unaffected by the potential formation of different polymorphs due to flow.81,82 The crystallinity values from MCR-ALS and subsequent peak-fitting were then corrected based on the final crystallinity determined via DSC. This analysis was performed on each input spectrum from a cooling experiment to determine the crystallinity within each phase as a function of temperature.
Figure 1.
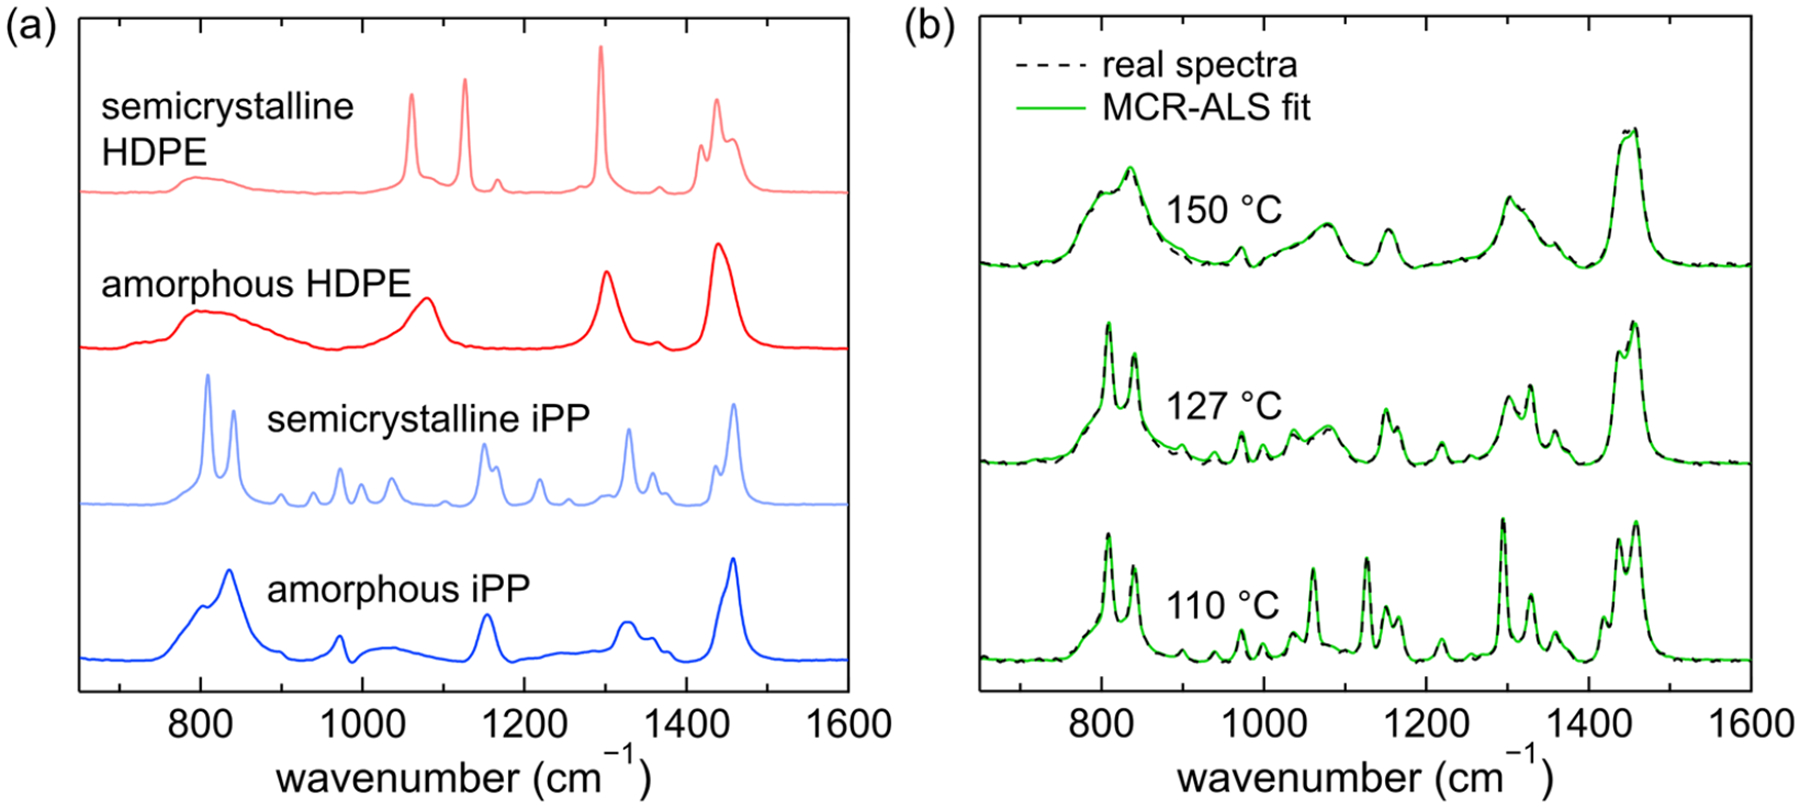
(a) Input spectra for MCR-ALS: semicrystalline HDPE, amorphous HDPE, semicrystalline iPP, and amorphous iPP. (b) Raman spectra, in the 650 to 1600 cm−1 wavenumber range, of a 50% HDPE, 50% iPP blend at 150, 127, and 110 °C (black lines), overlaid with corresponding MCR-ALS fits (green lines). At 150 °C, both HDPE and iPP are amorphous. At 127 °C, HDPE is amorphous, and iPP has 46% crystallinity. At 110 °C, both polymers are semicrystalline with 70 and 47% crystallinity for HDPE and iPP, respectively.
The applicability of MCR-ALS in fitting Raman spectra of HDPE–iPP blends to ascertain the crystalline and amorphous contributions of each phase is demonstrated in Figure 1b. The experimental Raman spectra for a 50% HDPE, 50% iPP blend are plotted at three different temperatures: 150, 127, and 110 °C. MCR-ALS and subsequent peak-fitting of these spectra determined that both HDPE and iPP are amorphous at 150 °C, as expected from DSC. At 127 °C, HDPE remains amorphous, and iPP is 46% crystalline. At 110 °C, both HDPE and iPP are semicrystalline with 70 and 47% crystallinity, respectively. The MCR-ALS fits are included in green, nearly overlapping with the original experimental spectra and demonstrating the ability of MCR-ALS to fit Raman spectra of HDPE–iPP blends and determine the contributions from the amorphous and crystalline components in each phase at various temperatures.
RESULTS
In the presence of flow, there are several dimensionless numbers that we consider to assess the response of the blend at both the domain level and the chain level. First, as the polymers are immiscible, we consider the capillary numbers, which are associated with domain deformation under flow. Next, in the absence of flow, we consider time scales associated with chain relaxation and domain relaxation. And finally, we consider Weissenberg numbers associated with chain stretch and chain reptation for both components–these are relevant to the consideration of shear rates associated with standard FIC.
The melt rheology for HDPE and iPP are shown in Figure 2. The master curves are constructed via the time–temperature superposition principle using minimal vertical offsets and horizontal shift factors (aT) at a reference temperature (Tref) of 150 °C. The shift factors and Arrhenius fits are reported in Figure S4, and the melt rheology for the HDPE and iPP prior to compounding are reported in Figure S5. The moduli and complex viscosity for HDPE are higher than that of iPP for the entire frequency range. In addition, HDPE shows little relaxation over the frequency range with a barely distinguishable crossover between the storage modulus G′ and loss modulus G″, likely due to the high viscosity and molecular mass dispersity, preventing the extraction of the longest relaxation time for HDPE. The terminal viscosity was not reached for HDPE or iPP due to degradation of the samples at higher temperatures.
Figure 2.
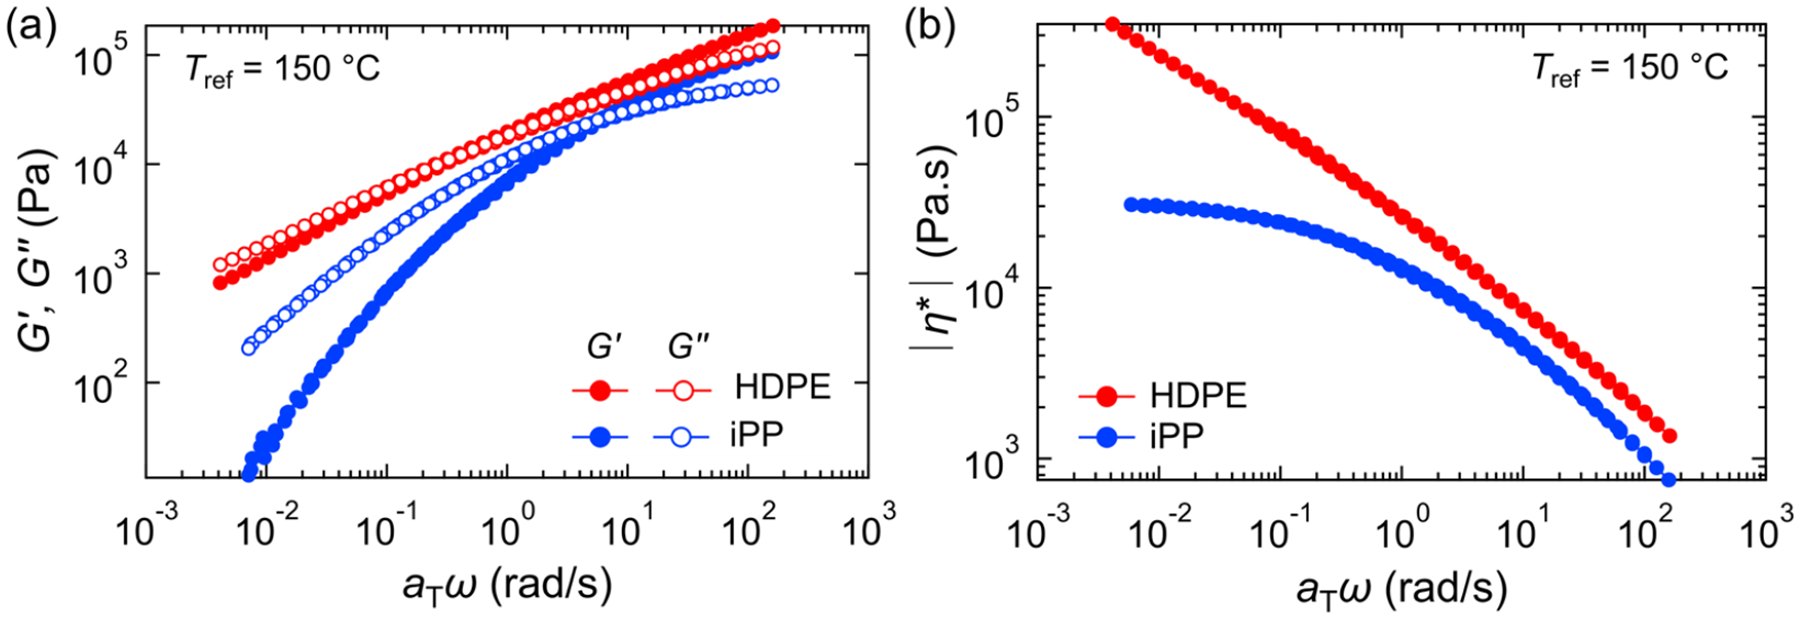
(a) Small-amplitude oscillatory shear rheology master curves of the frequency dependence of the storage modulus G′ (closed symbols and loss modulus G″ (open symbols) for HDPE (red) and iPP (blue). The reference temperature Tref is 150 °C. (b) Magnitude of the complex shear viscosities |η*| as a function of angular frequency ω at Tref = 150 °C for HDPE (red) and iPP (blue).
The morphology of polymer blends and their deformation of the dispersed phase is highly dependent on the viscosities of the individual components and the viscosity ratio (λ) of the dispersed phase (ηd) to the matrix (ηm), as well as the capillary number (Ca).32,83,84
| (1) |
| (2) |
The capillary number is the ratio of the viscous stresses () to interfacial stresses (σ/a) on a droplet where is the shear rate, σ is the interfacial tension, and a is the droplet radius or radius of a domain thread. For very high viscosity ratios, the dispersed phase acts as hard domains that undergo little to no deformation. For intermediate (λ ≈ 1) to low viscosity ratios, the dispersed phase undergoes elongation under shear and can break up into ribbons or smaller droplets above a critical capillary number (Cac ≈ 0.5 when λ ≈ 1).32 Using the Cox–Merz rule,85 the steady shear viscosity at an apparent shear rate () corresponds to the complex viscosity at the same angular frequency (ω = 10 rad/s). For this frequency, the viscosities of HDPE and iPP are 7400 Pa·s and 4600 Pa·s, respectively. Thus, for blends with a majority iPP, i.e., HDPE droplets, λHDPE ≈ 1.6, and blends with iPP droplets give λiPP ≈ 0.6. Since the viscosity ratio is near 1 for both types of droplets, it is expected that droplet deformation will occur in both cases, however, a higher HDPE viscosity suggests that iPP droplets will undergo more deformation that HDPE droplets.
The capillary number for each polymer can also be estimated using an approximate droplet radius of 0.5 to 5 μm (see discussion of SEM images below) and an interfacial tension of 1.7 mN/m, reported by Souza and Demarquette86 for an HDPE–PP blend of similar molecular masses. For the shear rate of , this results in capillary numbers ranging from 14 to 140 for HDPE in an iPP matrix and 22 to 220 for iPP droplets in an HDPE matrix, respectively. With such high capillary numbers, it is expected that both types of droplets will elongate and eventually breakup into smaller droplets under shear.
In the absence of flow, we can consider the time scale associated with domain relaxation by setting the capillary number to unity: td ≈ ηm/(σ/a). Assuming the time scale is dominated by the more viscous component (the HDPE), we find that for a 5 μm droplet or thread radius, and using the complex viscosity at its lowest measured frequency (ηm ≈ 3 × 10⁵ Pa·s), we find td ≈ 1000 s, indicating that the domains that are elongated by the shear pulse should relax very slowly over the course of the experiment. Also note (below) that this time is significantly longer than that of reptation or stretching relaxations of either component.
Another important consideration for the shear pulse experiments is the deformation of the polymer chains by the external flow. This depends on the competition between flow strength and chain relaxation and can be quantified by the Weissenberg number (Wi):87,88
| (3) |
where is the shear rate and τ is a characteristic relaxation time. Using two characteristic time scales, reptation or terminal relaxation time τrep and Rouse relaxation time τRouse, the effect of flow can be divided into three primary regimes:88 (i) , where weak flow has negligible effect on chain deformation; (ii) Wirep > 1 and , where chains orient to enhance crystallization but there is little segmental stretch; and (iii) Wirep > 1 and Wis > 1, where strong flow induces chains to both orient and stretch. Thus, FIC can occur when Wirep > 1. For our system, terminal relaxation is not reached for either polymer, and τrep cannot be measured by rheology. Instead, using the GPC data, we can estimate
| (4) |
where M is the molar mass of the longest chains (ca. 106 g/mol), Me is the entanglement molecular mass, and τe is the entanglement relaxation time.89 Using values from the literature (τe,HDPE = 1.5 × 10⁻⁷ s at 170 °C and τe,iPP= 7.0 × 10⁻⁹ s at 190 °C),89 τRouse,HDPE ≈ 0.020 s and τRouse,iPP ≈ 0.011 s at 142 °C. This gives Wis,HDPE ≈ 0.20 and Wis,iPP ≈ 0.11 at a shear rate of 10 s−1. The terminal relaxation time can be estimated from the Likhtman and McLeish theory90 such that
| (5) |
This gives τrep,HDPE ≈ 56 s and τrep,iPP ≈ 3.5 s, as well as Wirep,HDPE ≈ 560 and Wirep,iPP ≈ 35. Additionally, we can estimate average characteristic relaxation times using the crossover of G′ and G″ from the rheology in Figure 2a and use these times to calculate WiHDPE ≈ 420 and WiiPP ≈ 15 at 142 °C for . These values are between the Rouse and reptation Wi calculated from the molar mass of the longest chains, and indicate that FIC is possible for both polymers in our blends.
DSC.
The DSC crystallization curves for the five compositions are shown in Figure 3—we pay particular attention to the compositional dependence of the iPP. The melting curves on the second heat are included in Figure S5. Neat iPP exhibits a crystallization temperature of 132 °C, while neat HDPE crystallizes at 125 °C. For both the 30 and 50% HDPE blends, separate crystallization peaks can be seen, and we associate the one at higher temperature with the iPP and the lower with HDPE. There is a slight depression in the iPP crystallization temperature as more HDPE is added. Significantly, for the 70% HDPE blend, iPP is now the minority component, and a substantial reduction in the crystallization temperature is observed in the small shoulder to the right of the sharp HDPE peak. The drop in crystallization temperature when iPP is the dispersed phase is attributed to the nucleation suppression due to fractionated crystallization. The concept behind fractionated crystallization is that crystallization is retarded when many droplets do not contain active nucleating agents. This occurs when the bulk density of nucleating agents is less than the density of droplets.
Figure 3.
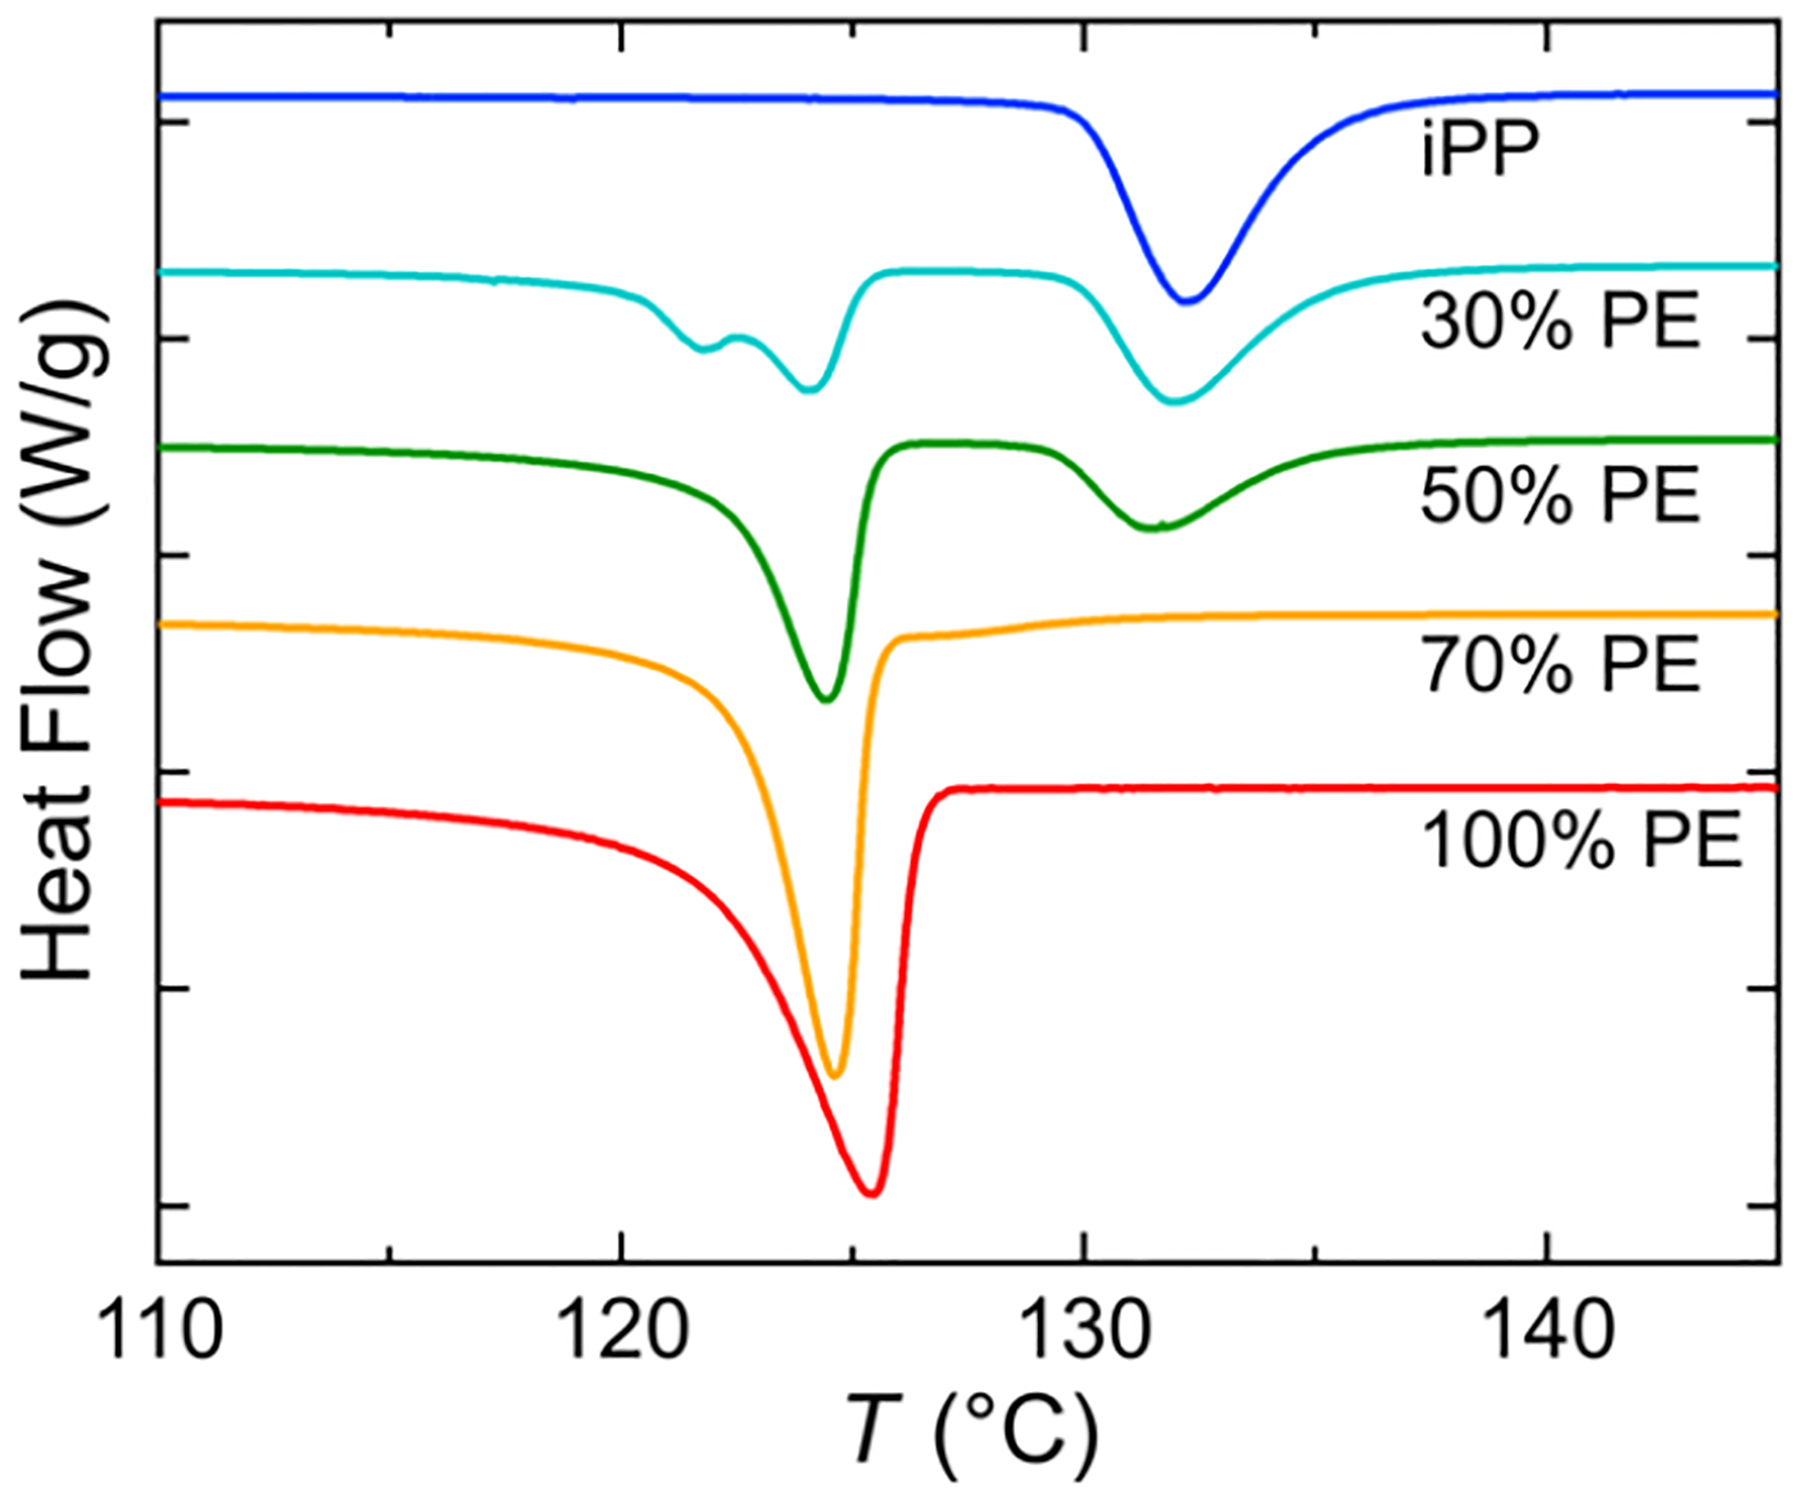
DSC traces during 1 °C/min cooling ramps of HDPE–iPP blends. The endotherm direction is up. Curves have been offset for ease of viewing.
Rheo-Raman Spectroscopy with and without Shear.
To examine the effect of shear on the crystallization kinetics and rheological properties, we performed cooling experiments using rheo-Raman spectroscopy where we heat the samples to 200 °C, cool the samples to 160 °C at 5 °C/min, and subsequently cool to 100 °C at 1 °C/min, with the added shear step at 142 °C for shear pulse experiments, as discussed in the Rheology and Raman Spectroscopy subsection. Figure 4 shows the complex modulus |G*|, loss factor tan δ = G″/G′, the dynamic moduli (G′ and G″), and the crystallinity of each component for a quiescent experiment on a 50% HDPE, 50% iPP blend. The crystallinity was determined from Raman spectroscopy as discussed above. The onsets of crystallization for iPP and HDPE occur at different temperatures, which agrees well with the DSC measurements shown in Figure 3. The separate crystallization processes are also shown in the two distinct transitions that can be seen in the rheology results. As iPP crystallizes, the moduli increase significantly and tan δ decreases. A second upturn in the moduli is observed as the HDPE crystallizes. This is also reflected in the upturn in tan δ at the same temperature. Overall, there is good agreement between the rheology and crystallinity from Raman spectroscopy, and slight differences between the DSC and Raman transition temperatures can be attributed to the differences between sample thicknesses and thermal lag.
Figure 4.
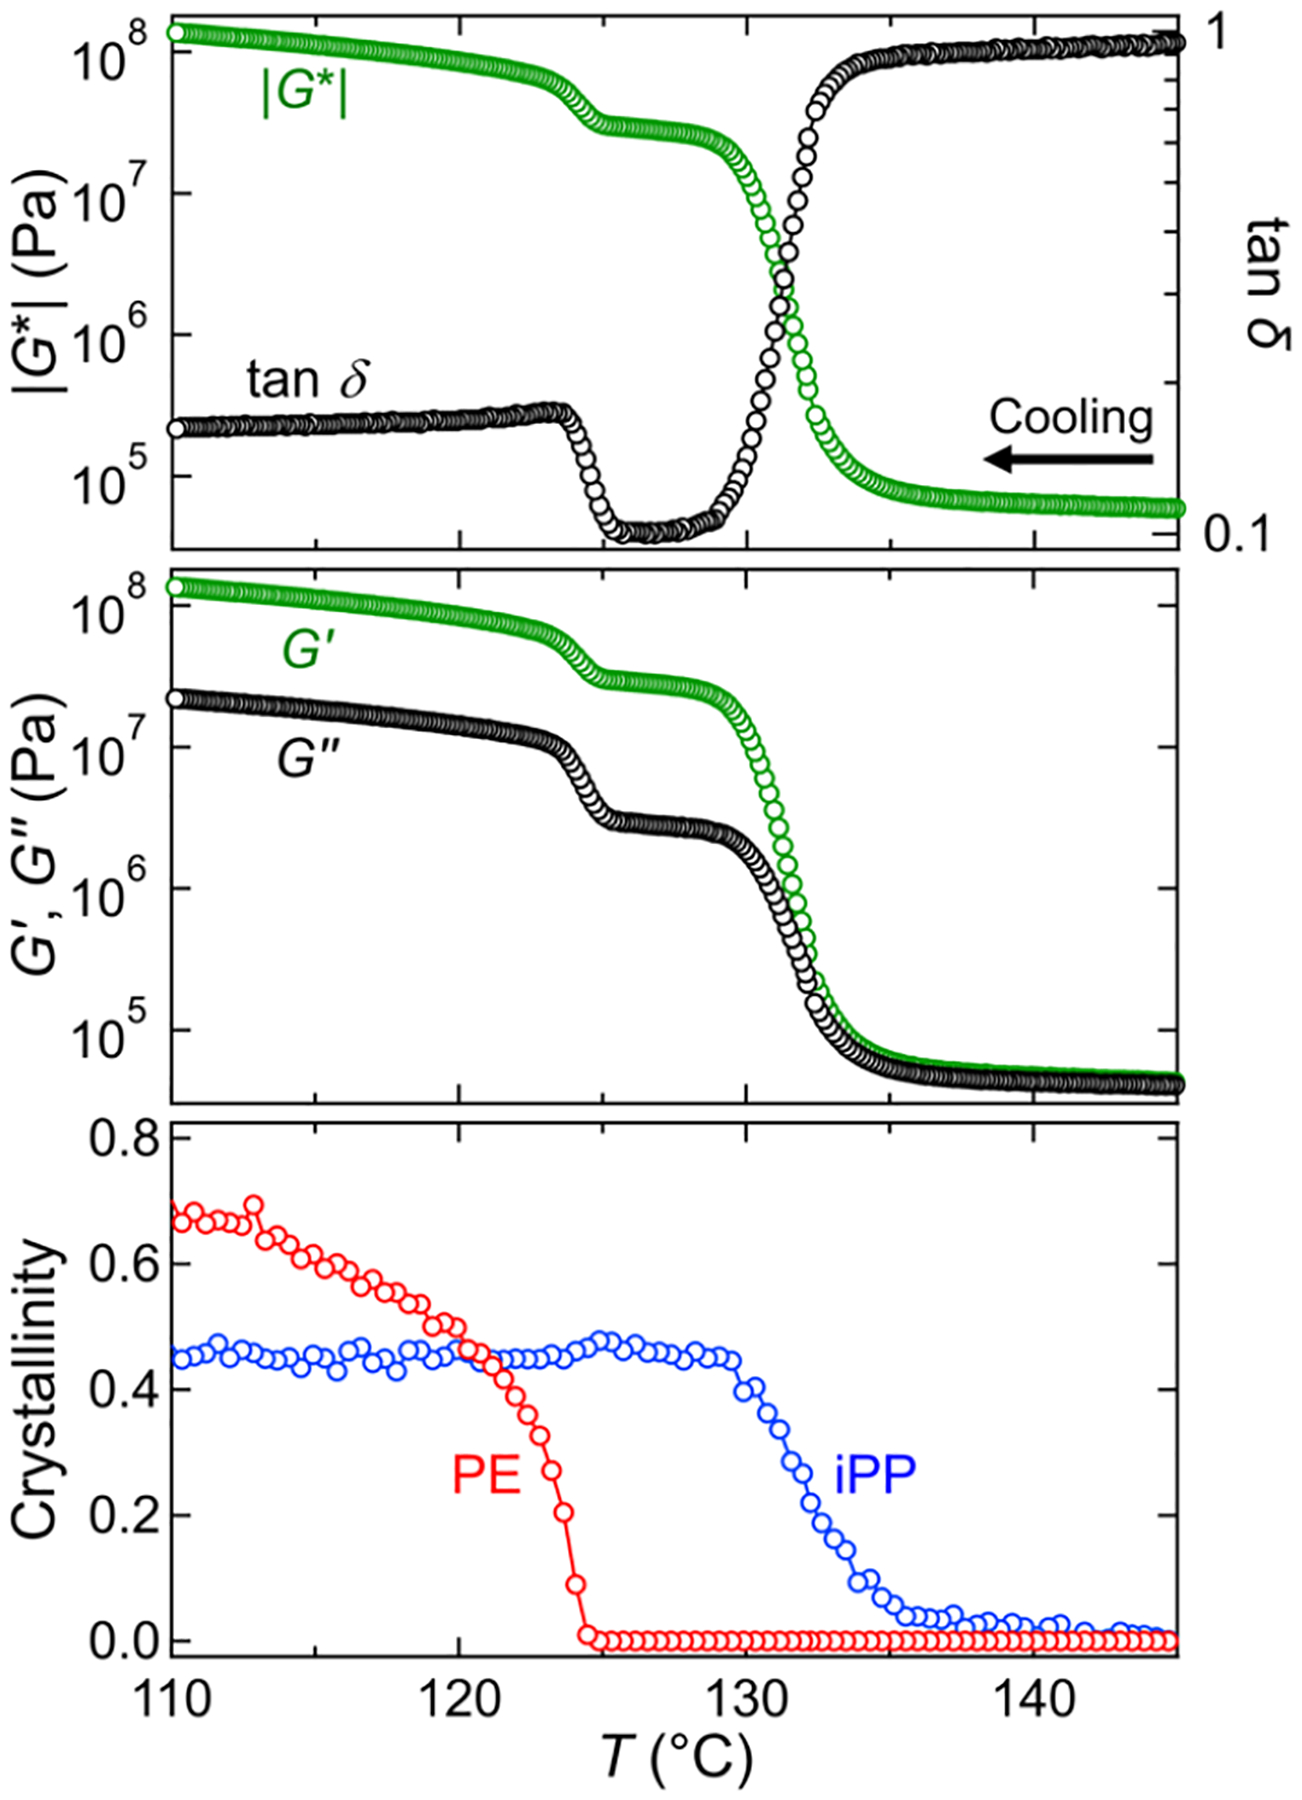
Representative rheology and crystallinity results for a blend of 50% HDPE and 50% iPP cooled at 1 °C/min. Top: complex modulus |G*| (green) and loss factor tan δ (black) as a function of temperature. Middle: storage G′ (green) and loss G″ (black) moduli as a function of temperature. Bottom: mass fraction crystallinity of iPP (blue) and PE (red) phases, determined from Raman spectra. The moduli and tan δ show two transitions upon cooling, corresponding to the crystallization of each phase.
We start by considering the pure components, and for now just consider the rheology (because there is no ambiguity as to which component is crystallizing, and it affords greater precision). Figure 5 shows the growth of modulus during a cooling ramp with and without shear for the 100% HDPE (Figure 5a) and the 100% iPP (Figure 5b). By ascribing the crystallization temperature as the point of maximal slope in the curves, we can ascertain the FIC in the pure components. After shearing, we find that the change in crystallization temperature δTc for the HDPE is 0.10 °C whereas for the iPP it is 0.42 °C. In the case of HDPE, the shear temperature is much higher than the melting temperature. This gives chains time to relax prior to crystallization and preventing FIC in the HDPE. For the iPP, the effect may feel modest considering the Weissenberg number, but the total work on the sample is low because the shear pulse is only 6 s long.
Figure 5.
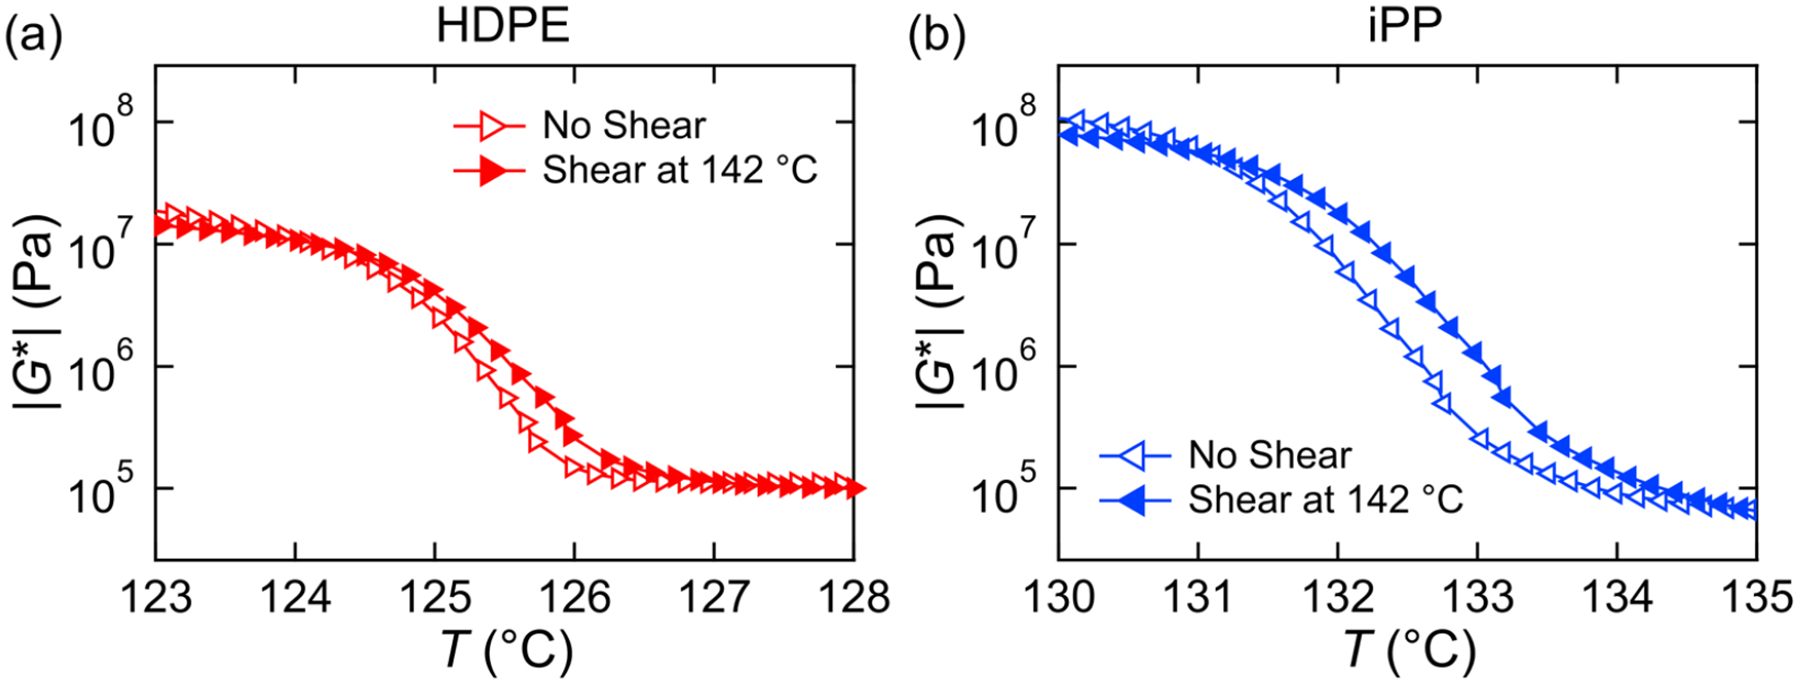
Complex modulus |G*| as a function of temperature for (a) HDPE and (b) iPP with (closed symbols) and without (open symbols) a 10 s−1 shear pulse at 142 °C for 6 s.
Polarized optical microscopy images of 100% iPP also show that FIC is occurring, evident by the higher number of spherulites and increase in yellow color in the sheared sample (Figure S7) when compared to the nonsheared sample at the same temperature. It is likely that this small amount of FIC is below the detection limit of the Raman spectrometer.
We now consider the effects of composition in Figure 6 by comparing the rheology and Raman-derived crystallinity in each phase for all compositions, both without a shear pulse (quiescent, top row, open symbols) and with a shear pulse at 142 °C (bottom row, closed symbols). Similar to the 50% HDPE blend (green) discussed above, the quiescent rheology of the 30% HDPE blend (teal) shows two upturns in modulus, separated by plateaus, corresponding to the separate crystallizations of iPP and HDPE, respectively. There is also little change in the crystallization temperatures for the individual components. In contrast, the 70% HDPE sample (gold) does not show an increase in modulus at the iPP crystallization temperature during cooling and only shows a slight increase in modulus prior to the HDPE crystallization temperature, which is reflected in the retardation of the crystallinity of the iPP phase. The decrease in slope of the iPP crystallinity suggests that iPP has slower crystallization kinetics when in the dispersed phase. The quiescent rheo-Raman results reinforce the trends seen in the DSC crystallization curves concerning the distinct crystallizations of the iPP and HDPE phases for the lower concentrations of HDPE and the reduction of the iPP crystallization temperature for the 70% HDPE blend. The results discussed here are dissimilar to the results previously reported by Huang et al.10 where the crystallization temperature for iPP, reflected in both the Raman crystallinity and the rheology measurements, monotonically decreased with the addition of HDPE from (0 to 30)%. This discrepancy is likely due to the higher molecular masses used in our system, specifically, the HDPE and iPP used here are likely to be more immiscible, and thus the iPP crystallization remains relatively constant for small additions of HDPE.
Figure 6.
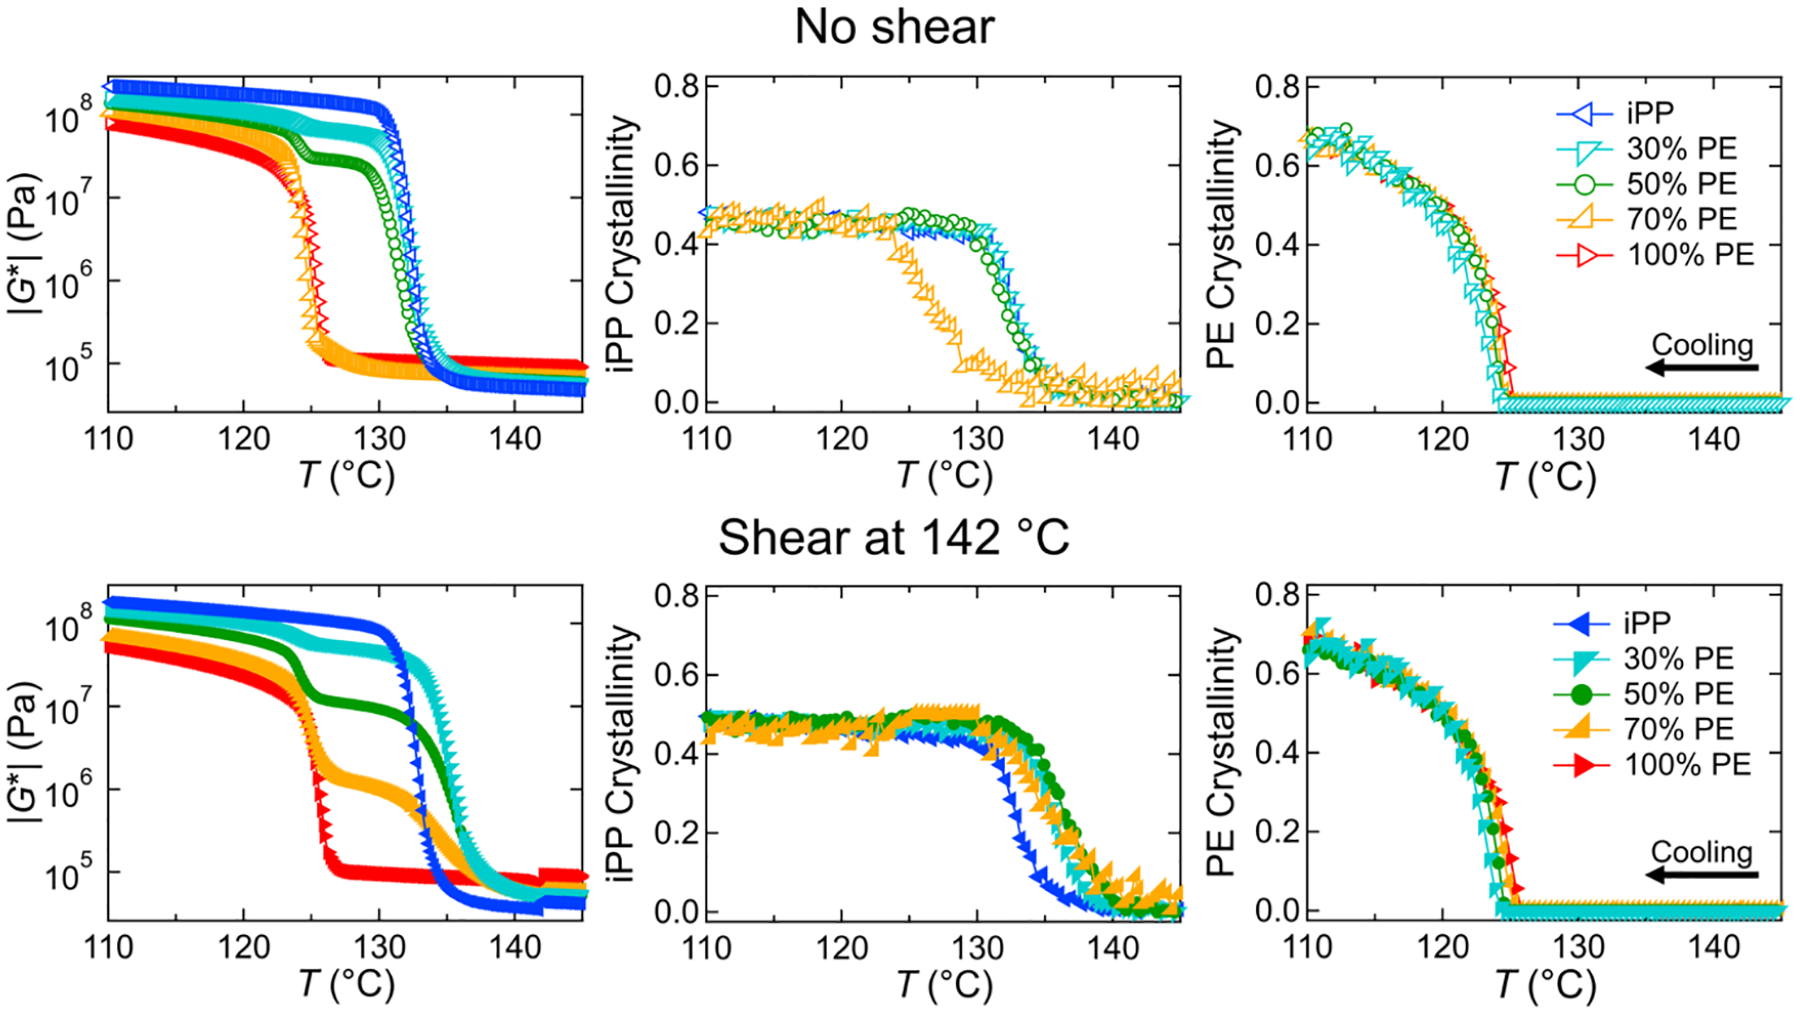
Complex modulus |G*| and crystallinity of iPP and PE from Raman spectroscopy for the five blend compositions as a function of temperature for (top) the quiescent experiments and (bottom) the experiments with a 10 s−1 shear pulse at 142 °C for 6 s.
The results from the 142 °C shear pulse experiments are shown in the bottom row of Figure 6 to allow for direct comparison between quiescent and sheared samples. For 100% HDPE (red), there is little change in the temperature dependence of the modulus and crystallinities due to the shear pulse, and only a modest change in the rheology for the 100% iPP (blue), as discussed above. In contrast, all three blend compositions show an increase in the crystallization temperature for iPP. The first upturn in modulus shifts to higher temperature for both the 30 and 50% HDPE samples, and the 70% HDPE blend now shows two clear transitions. These changes are reflected in the increase in iPP crystallinity at higher temperatures for all three compositions, indicating that FIC has occurred. The FIC appears to be more significant when iPP is the dispersed phase as the crystallization temperature has increased such that it is similar to that of the other compositions. The HDPE crystallinity, however, appears to remain unchanged by the shear pulse for all compositions, both as the matrix and as the disperse phase. This could be due to the large gap between the HDPE melting temperature (≈135 °C, Figure S6) and the shear pulse temperature (142 °C). A shear pulse at a lower temperature might have more of an effect on the HDPE phase.
Optical Microscopy.
To characterize spherulite or semi-crystalline superstructure growth rates, since these structures are expected to be the dominant rheology modifiers,91 polarized optical microscopy was used during quiescent and shear pulse cooling experiments of HDPE–iPP blends as described in the Polarized Optical Microscopy subsection. A magenta color indicates unaligned or amorphous domains, yellow indicates alignment in the direction of flow for shear experiments, and blue indicates alignment perpendicular to the flow direction. Figure 7 shows the effect of the 142 °C shear pulse on the crystallization of a 70% HDPE, 30% iPP blend. The top row shows the quiescent experiment as a function of temperature. At 137 °C, there are no visible spherulites present in the sample, which is expected from the rheo-Raman results. As cooling proceeds, spherulites begin to nucleate and grow within the iPP dispersed phase, however their growth is limited by the size of the droplets. Around or below 125 °C, HDPE crystallization occurs. The spherulites grow in all directions indicated by the mix of yellow and blue in the images. The bottom row shows the images taken during a shear pulse experiment. At 137 °C, just after the shear pulse, alignment of the semicrystalline domains in the flow direction can already be seen, indicative of FIC. Both round and elongated structures are present in the image and also appear to be aligned in the flow direction. This suggests that the droplets are deformed by the flow, which can be explained by the viscosity ratio being ≈1 and the capillary number Ca ≫ 1 as discussed previously. The iPP spherulites continue to grow as the system cools, though again the growth is restricted due to the droplet size. By 120 °C, the HDPE has crystallized as well, and the strong yellow color suggests that the HDPE semicrystalline domains are also aligned in the direction of flow. Representative optical microscopy images for the other blend compositions with and without the shear pulse are included in the Supporting Information.
Figure 7.
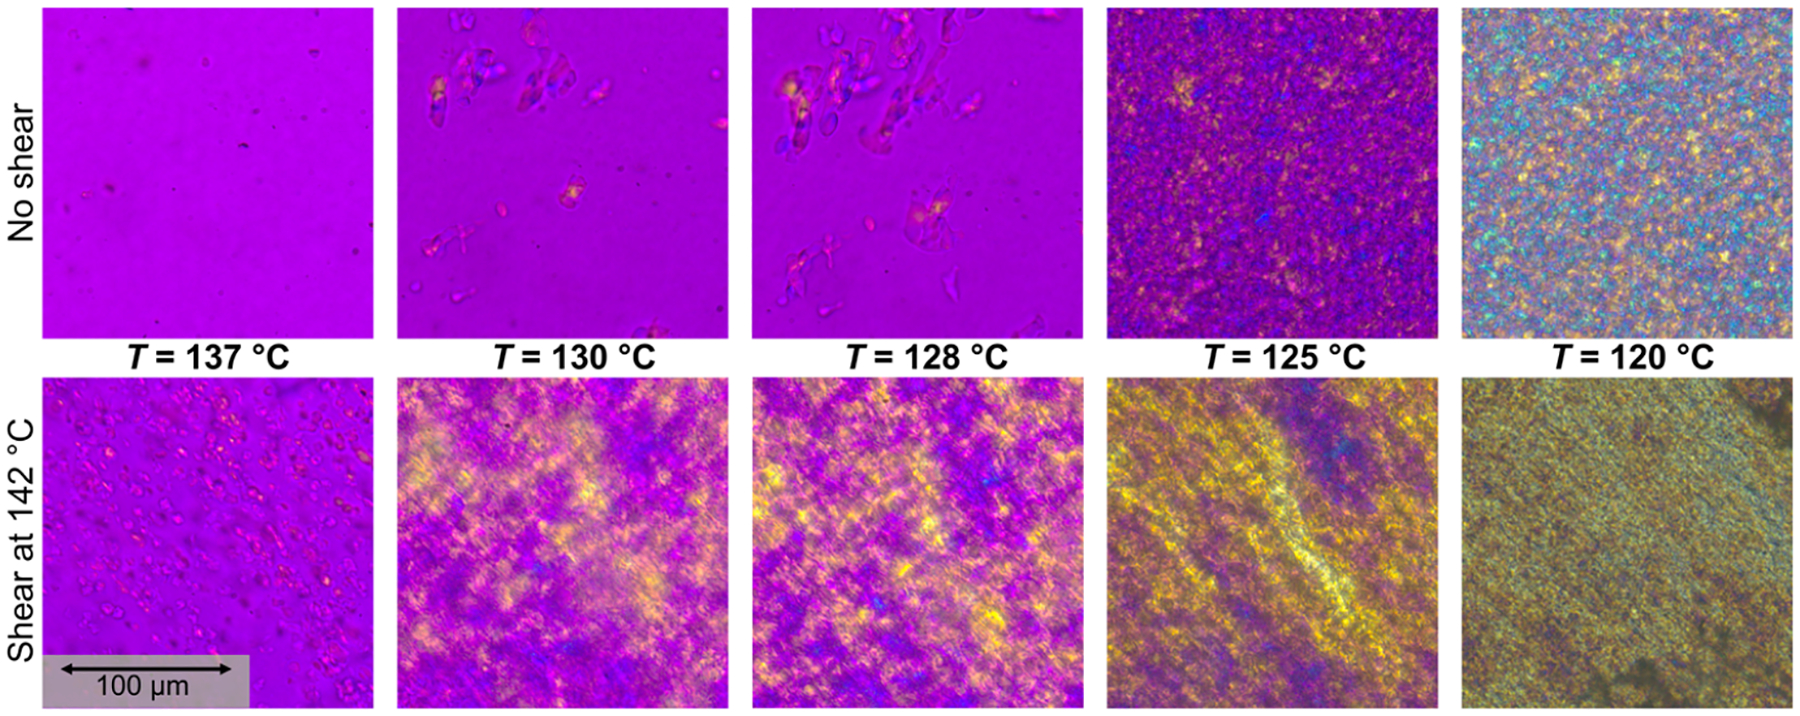
Polarized optical microscopy images of a 70% HDPE, 30% iPP blend as a function of temperature with (bottom) and without (top) a shear pulse at 142 °C for 6 s at .
In Figure 8, we compare the shear pulse experiments for the samples where iPP is a majority component: 100% iPP (top row) and the 30% HDPE, 70% iPP blend (bottom row). Soon after the shear pulse, at 139 °C, the 100% iPP sample displays a few spherulites with chain alignment in the direction of shear. The 30% HDPE sample, however, shows a higher number of smaller spherulites, suggesting that the shear pulse has enhanced nucleation of iPP in the matrix. The trend continues as the samples cool, with more crystallization occurring for the 30% HDPE, 70% iPP sample than for the 100% iPP. By 135 °C, the majority of the iPP has crystallized in the matrix of the blend sample and there is significant chain alignment in the flow direction. In contrast, the 100% iPP sample continues to crystallize until 130 °C, where the sample begins to detach from the upper plate due to the decrease in volume as it solidifies, indicated by the dark outline between spherulites. The images discussed here corroborate the rheo-Raman data showing that the iPP in the 30% HDPE blend has a higher crystallization temperature than pure iPP after the shear pulse.
Figure 8.
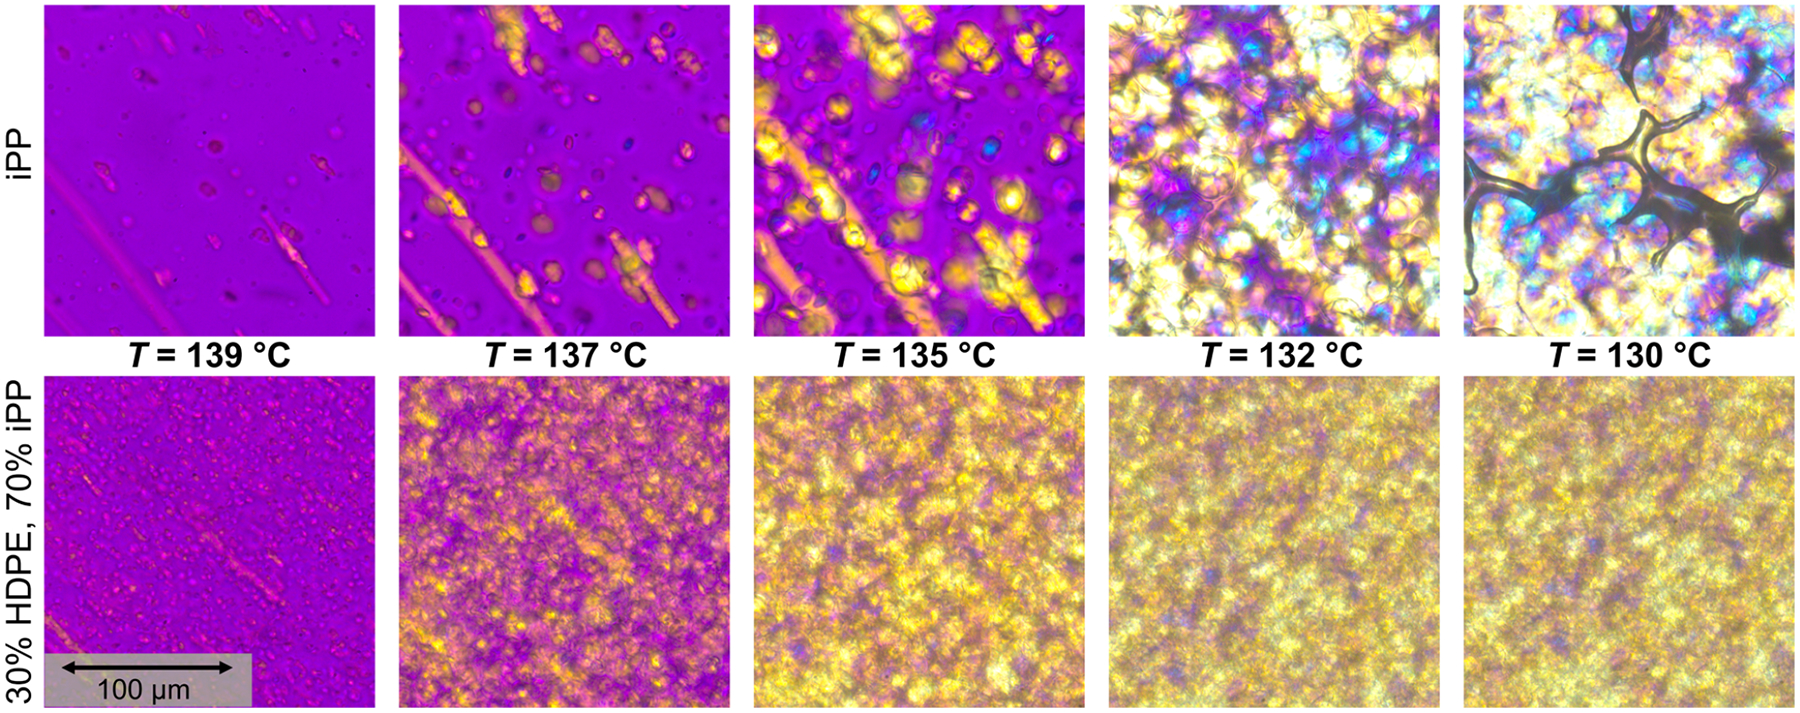
Polarized optical microscopy images as a function of temperature for iPP (top) and a 30% HDPE, 70% iPP blend (bottom) after a shear pulse at 142 °C for 6 s at .
In Figure 9, we show the optical microscopy images collected at 135 °C for 100% iPP and all three blends both for quiescent experiments (top row) and with a shear pulse (bottom row). This temperature is selected to correspond to initial increase in measurable crystallinity through Raman spectroscopy. The 100% HDPE sample is not included due its lower crystallization temperature below 135 °C. In the quiescent experiments, iPP spherulites can be seen in the 0 to 50% HDPE compositions. There are fewer spherulites in the 30 and 50% HDPE blends than in the 100% iPP, and their shape seems to be less round, which is likely due to spherulite growth around domains of HDPE. This effect was previously reported by Huang et al.10 in HDPE–iPP blends via phase-contrast polarized optical microscopy images. The 70% HDPE sample shows little to no spherulites present at 135 °C, consistent with Figure 6. When the 142 °C shear pulse is applied, the 100% iPP sample now displays an increase in chain alignment in the flow direction, but the number of spherulites does not appear to be significantly different. The 30 and 50% HDPE blends, on the other hand, show a significant increase in crystallization and chain alignment in the flow direction after the shear pulse is applied, where it appears that, for both compositions, most of the sample has crystallized by 135 °C. With the shear pulse, the 70% HDPE sample shows a number of nuclei in droplets that appear elongated and aligned in the flow direction, though crystal growth is still limited by the droplet size. These results reinforce the trend shown in the rheo-Raman experiments where FIC occurs more strongly in the iPP in the blends than in the iPP alone.
Figure 9.
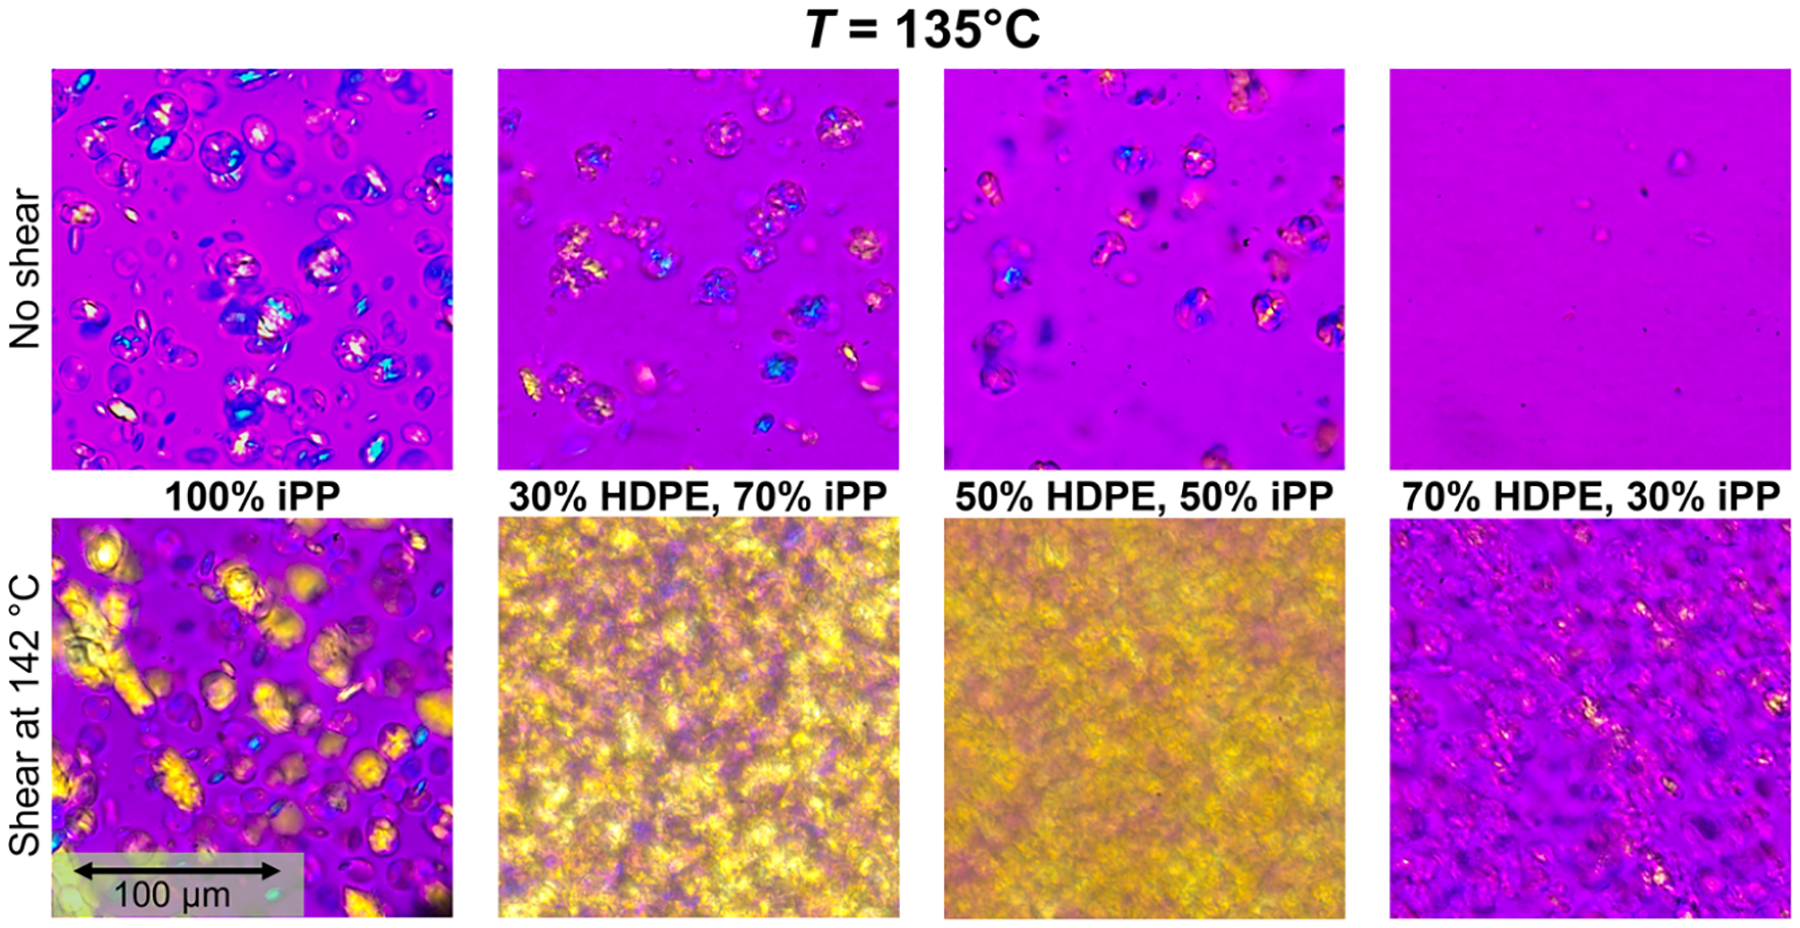
Polarized optical microscopy images comparing HDPE–iPP blends at 135 °C without (top) and with a shear pulse at 142 °C for 6 s at (bottom).
SEM.
To gain insight on the domain size and morphology of the blends and any changes occurring due to the shear pulse, SEM was performed on cryo-fractured sample disks after rheo-Raman experiments as discussed previously in the Scanning Electron Microscopy subsection. Figure 10 shows representative SEM images of the three blends after both quiescent (top row) and shear pulse experiments (bottom row). Without shear, the 30% HDPE, 70% iPP sample shows the expected droplet morphology with droplet diameters ranging from ≈ 0.7 to 10 μm with an average and standard deviation of 2.7 ± 0.96 μm for the short axis and 3.8 ± 1.6 μm for the long axis. Histograms showing measured droplet diameters with and without shear are included in the Supporting Information. The surface has fractured primarily along the immiscible blend phase boundary with darker “holes” present where a droplet was removed to the other fracture surface. The 50% HDPE blend shows a more cocontinuous structure with larger domain pull-out and some fracture within a domain. The 70% HDPE sample again shows the expected droplet morphology with droplet diameters ranging from ≈ 1 to 10 μm, however, there are also a significant number of elongated droplets extending to over 50 μm in length. These are likely formed as a result of the “preshearing” step where the samples are sheared at 0.1 s−1 for 5 min at 200 °C. The droplets are elongated during this step and likely did not have enough time to relax back to steady state after cessation of shear prior to crystallization. This effect has been previously shown in other immiscible blends.92,93 Overall, the average and standard deviation for the droplet diameters in the 70% HDPE blend are 2.9 ± 1.1 μm for the short axis and 11 ± 9.7 μm for the long axis. Additionally, the surface of the 70% HDPE blend appears to have some ductile fracture where the matrix has stretched out. This is likely due to plasticization of the HDPE domains in liquid nitrogen.94,95
Figure 10.
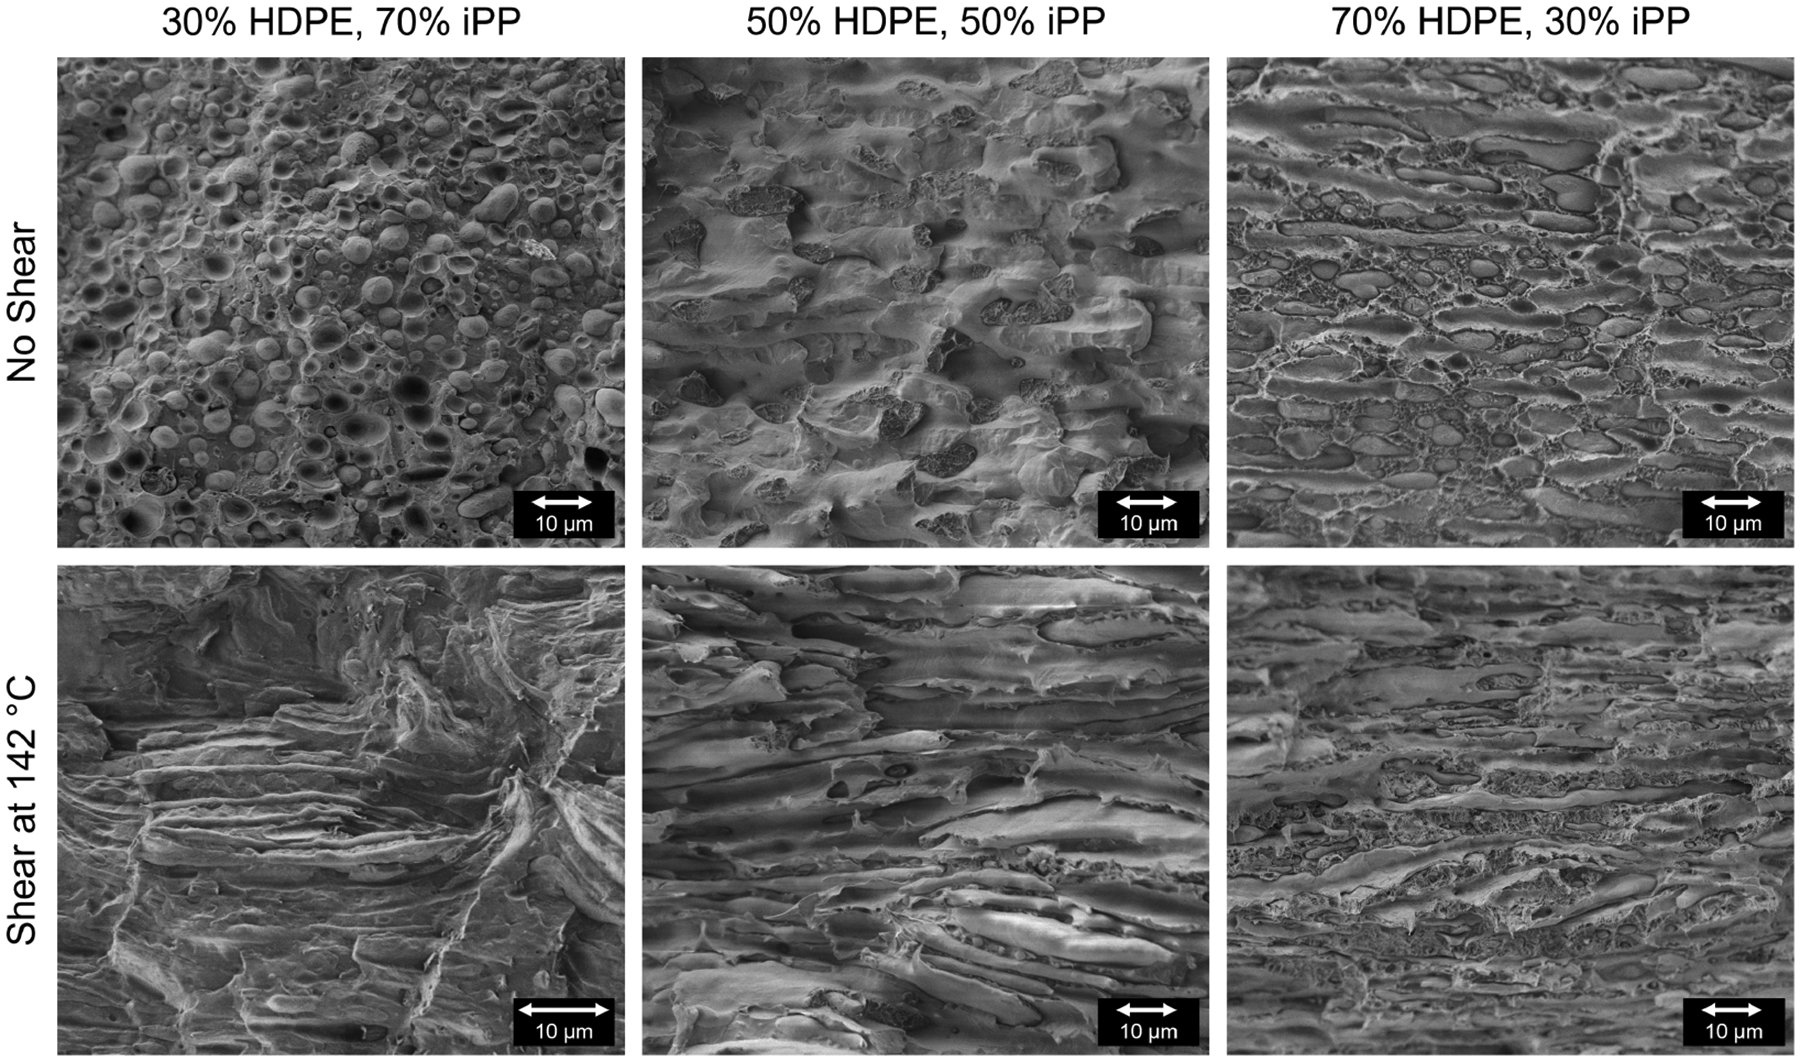
Representative SEM images of the cryo-fractured HDPE–iPP blends. The top row shows the morphologies of the blends after a cooling quiescent experiment. The bottom row shows analogous blends after a shear-pulse experiment.
After the shear pulse experiment, the HDPE droplets in the 30% HDPE blend have elongated significantly and aligned in the direction of shear (parallel to the fracture surface which is horizontal in the image). The droplets have formed strings, some of which extend to over 45 μm in length. Additionally, some of the strings show neck formation in evidence of capillary breakup. The averages and standard deviations for the string sizes are 1.0 ± 0.42 μm for the short axis diameter and 10 ± 9.5 μm for the long axis, or string length. The long axis is likely an underestimation of the droplet elongation due to breakage of the strings during cryo-fracturing. The 50% HDPE blend now shows a cocontinuous morphology that is also aligned in the direction of shear. The different domains can be distinguished by their “roughness”, i.e., the HDPE domain appears to be less smooth than the iPP domain due to the plasticization of HDPE in the liquid nitrogen. For the 70% HDPE blend, the iPP droplets are highly elongated in the direction of flow, forming strings of over 75 μm. The averages and standard deviations for the string sizes are 2.1 ± 0.68 μm for the short axis diameter and 26 ± 19 μm for the long axis, or string length. The deformation of the droplet domains for both HDPE and iPP as the dispersed phase is expected as both viscosity ratios are close to 1. The iPP droplets undergo more deformation than the HDPE droplets due to the higher viscosity of the HDPE. Additionally, the iPP droplet deformation and alignment in the shear direction corroborates the optical microscopy images of the 70% HDPE blend showing droplets with chain alignment in the flow direction.
DISCUSSION
To summarize our results, we examine the changes in crystallization temperature across composition space for the cases with and without shear. Figure 11 shows the rheology- and Raman-derived crystallization temperatures (Tc) for both the HDPE (red) and iPP (blue) phases with (closed symbols) and without shear (open symbols). From the rheology, Tc is defined here as the inflection point temperature in the modulus, i.e. at the minimum in the derivative of the modulus versus temperature. For the Raman-derived results, Tc is defined as the temperature where the crystallinity is roughly half of its value at the end of the pure component primary crystallization, that is Xc,HDPE ≈ 0.25 and Xc,iPP ≈ 0.22.
Figure 11.
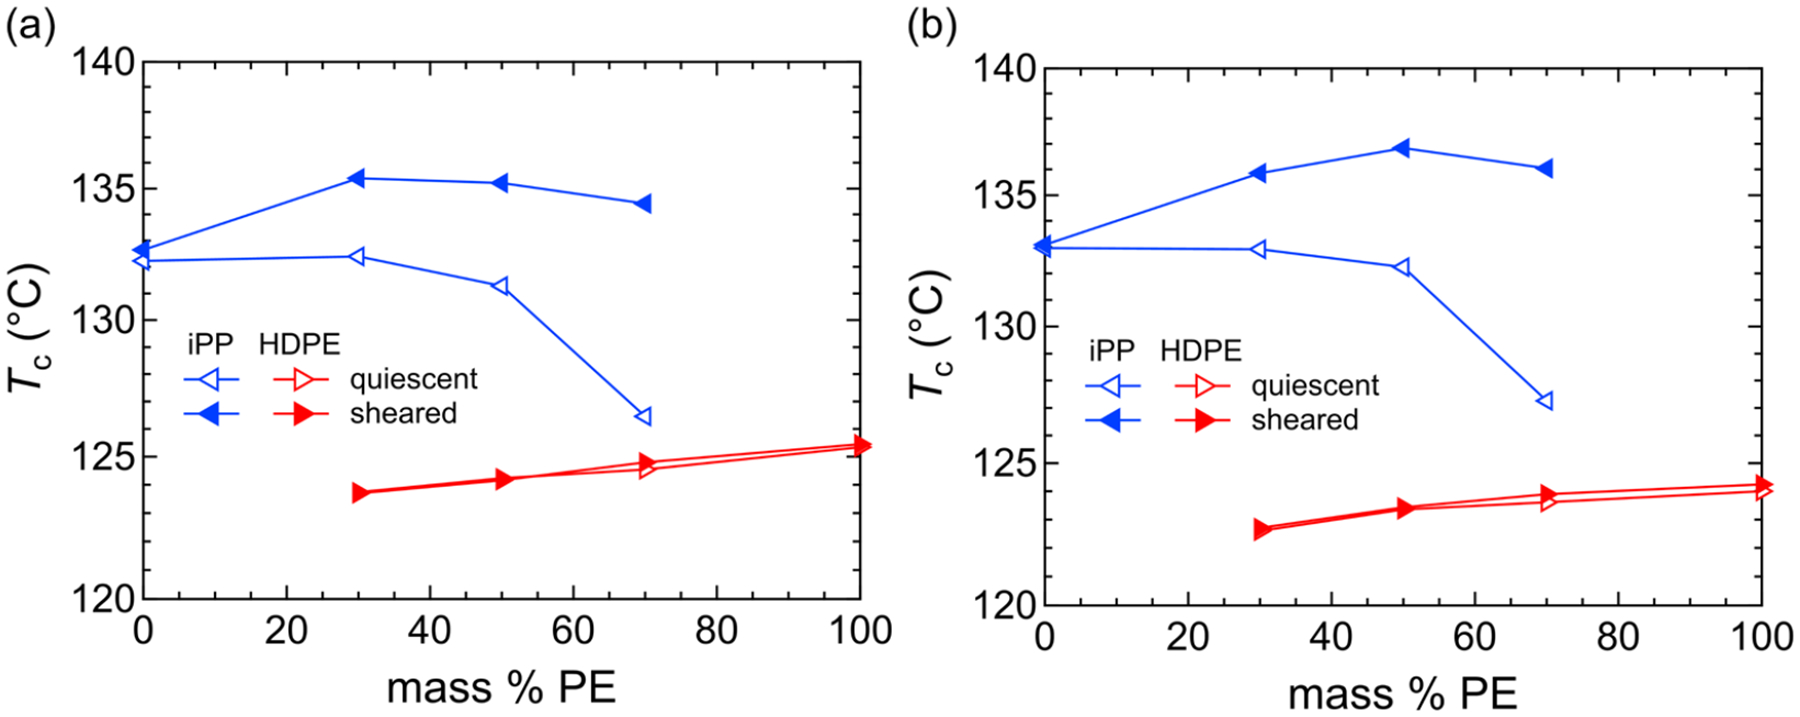
Crystallization temperatures as a function of mass % PE for iPP (blue) and PE (red) with and without a shear pulse at 140 °C, determined by (a) the inflection points in the modulus and (b) the halfway point of the Raman crystallinity. Open symbols indicate quiescent experiments, and closed symbols indicate shear pulse experiments.
In the case of quiescent crystallization where the majority component is iPP, there is a slight decrease in the iPP crystallization temperature as more HDPE is added. However, there is a sharp drop in the crystallization temperature for the case where iPP is in the minority (droplet state). For HDPE, there is only minimal change in the crystallization temperature as the iPP content is increased.
To understand the sharp decrease in iPP crystallization but not HDPE crystallization when in the droplet phase, we examine the nucleation densities of both polymers in Figure 12. The temperature ramp rate is the same as that used for the above experiments, however no shear steps are applied. We show one representative image at an appropriate temperature during the crystallization for both the 100% iPP (left) and 100% HDPE (right) samples. For the iPP, the sample thickness is 100 μm and for the HDPE, the thickness is 16 μm (the retardation plate is removed in this image for purposes of visual clarity). We ensure that the focal depth exceeds the sample thickness so that all nuclei can be counted. By determining the number of nuclei in each image and using the sample thickness times the image area for volume, we estimate the nucleation density for each polymer to be D ≈ 2.7 × 10⁻⁵ μm−3 for iPP and D ≈ 1.0 × 10⁻² μm−3 for HDPE. From the SEM images, we estimate the droplet number density to be ≈6 × 10⁻⁴ μm−3, assuming an average droplet diameter of 10 μm. This means that on average, there are more iPP droplets than active nuclei and that most droplets will not have nuclei that are active at 135 °C, which is shown in the lack of spherulites for the 70% HDPE blend without shear in Figure 9. A lower temperature is needed to activate other nucleating impurities and induce crystallization in other droplets, a phenomenon called fractionated crystallization.40 Fractionated crystallization can occur if the number of domains is of the same order of magnitude as the number of active nuclei in the bulk polymer, as in this case. Previous reports of fractionated crystallization in immiscible semicrystalline blends typically exhibit a larger drop in the crystallization than shown here (between ≈10 and 30 °C).40 Most reports used DSC curves at a cooling rate of 10 °C, however, which could explain this discrepancy since a faster cooling rate results in a lower effective crystallization temperature.96 For HDPE, there are many more active nuclei than the number of droplets, so fractionated crystallization does not occur.
Figure 12.
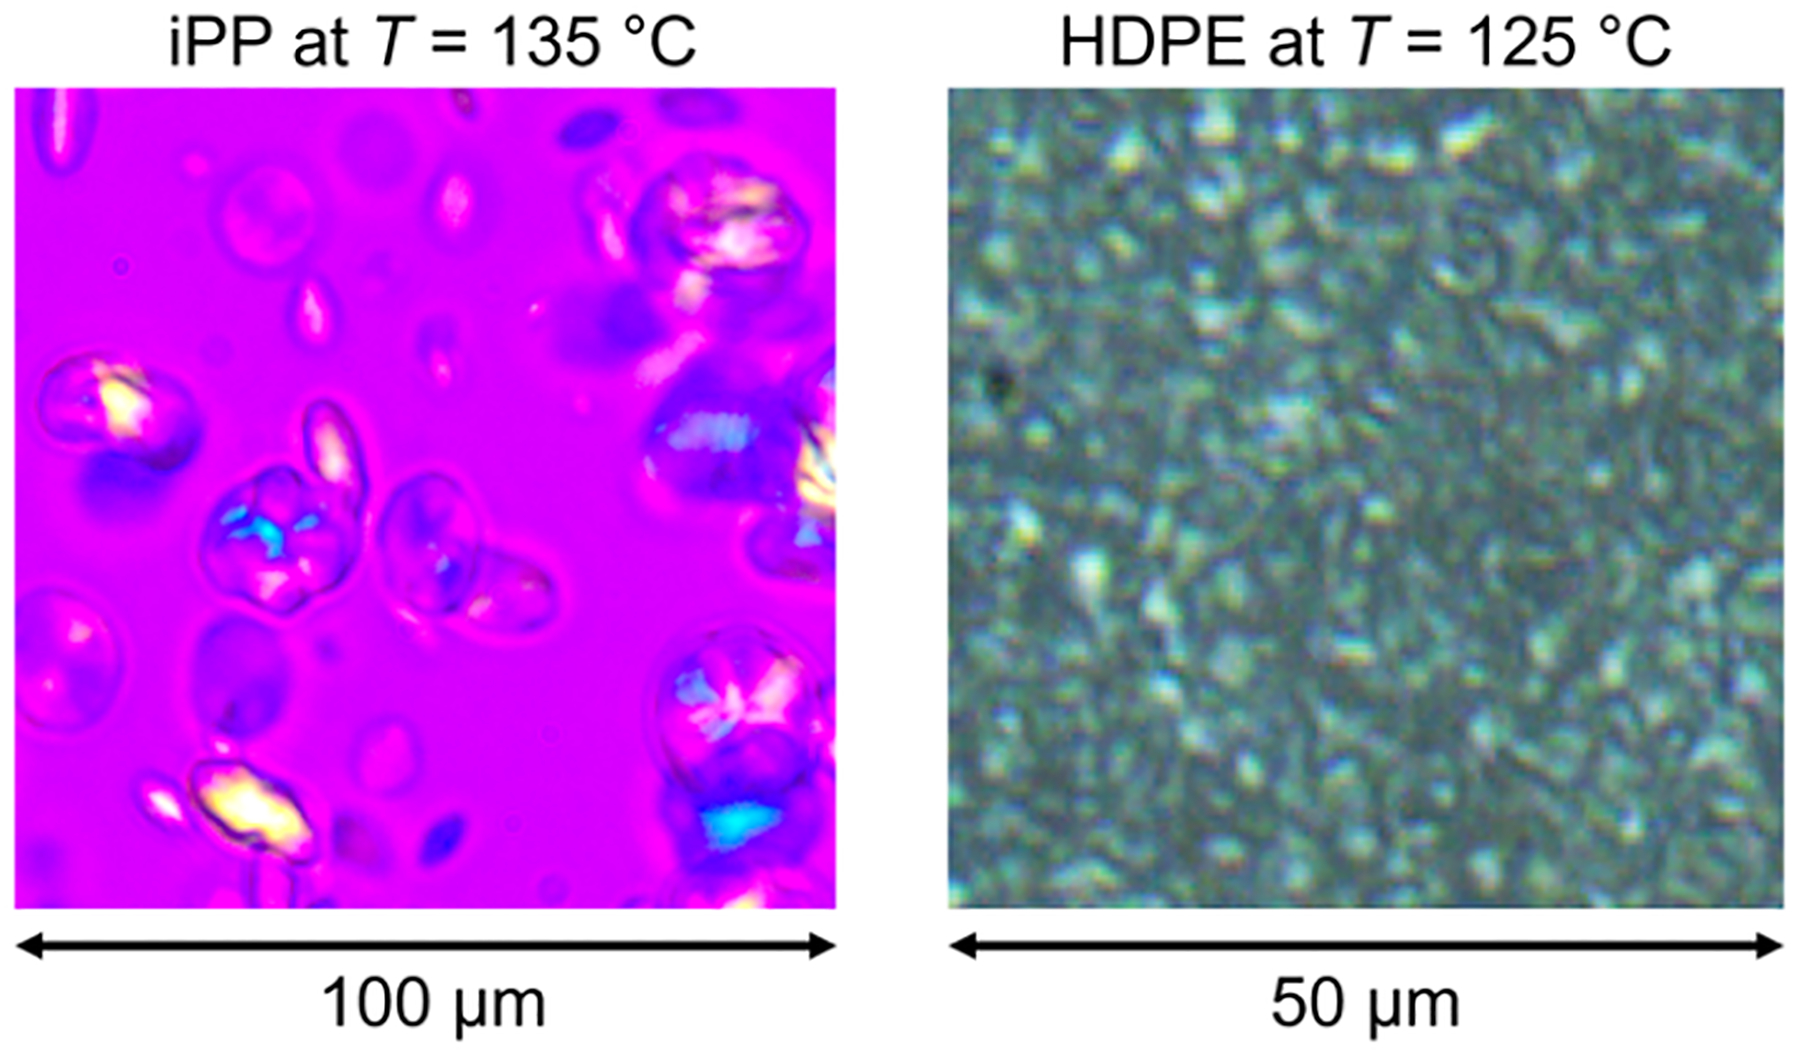
Polarized optical microscopy images of iPP (left) and HDPE (right) showing the crystal nucleation density for each polymer.
In the case of a shear pulse, we first consider 100% iPP where, as described above, the amount of FIC observed is relatively modest. The reason relates to our protocol: here, we perform a continuous temperature ramp, where the number of thermally activated nuclei and the crystal growth rate are increasing as the temperature decreases. On the other hand, much of the literature uses isothermal crystallization experiments,34,49–53,97 where both the number of nuclei and the growth rate are constant, and any enhancement in crystallization is determined by the number of shear-induced nuclei. As shown by Zinet et al.,98 during a slow cooling ramp, the effect of shear is much less than the effect of temperature on the crystallization of iPP. Additionally, van Erp et al.99 have shown that a shear pulse might only minimally shift the crystallization of iPP to higher temperature, even with high shear rates where FIC is expected. To show the difference between FIC under isothermal conditions and the temperature ramp considered here, we have performed an isothermal crystallization experiment for the iPP used in this study. The samples were melted at 200 °C and sheared at 0.1 s−1 for 5 min, cooled at 5 °C/min to 160 °C, cooled at 1 °C/min to 142 °C, and then isothermally crystallized at 140 °C. For the sheared sample, a 10 s−1 shear pulse was applied at 142 °C for 6 s. As shown in Figure S13, FIC does occur when the shear pulse is applied, evident by the increase in modulus occurring at shorter times for the sheared sample. Using the inflection point in the modulus as a function of time, the sheared sample crystallized 180 s faster than the nonsheared sample.
Figure 11 shows that when iPP is in the blend state, the effect of shear becomes much stronger. FIC occurs in all three blends, whether iPP is matrix, droplet, or cocontinuous, and far exceeds that observed in the pure iPP. What is notable is that even for the case of the 70% HDPE, where iPP are in droplets and we previously observed a suppression of crystallization due to fractionated crystallization, we still observe (roughly) the same iPP crystallization temperature as the iPP matrix and iPP cocontinuous compositions. In other words, the suppression of crystallization induced by the fact that many droplets no longer contain active nucleating agents (at a given temperature) is completely undone by the shear. The shear is capable of aligning chains sufficiently to induce nucleation. We rationalize these result by considering the microflows in the sample. Whereas the pure iPP sample is expected to undergo simple shear flow, the flow fields in the blends are more complex. There are two possible routes to consider the phenomena from the perspective of microflow fields. Once the sample is in a blend, the imposed shear rate is the global average, but local variations can be strong. First, one can consider the effect of viscosity ratio. In the limit as the droplet capillary number goes to zero, the flow rate within the droplet also goes to zero. However, as described above, the capillary numbers in this case can be quite large, and the SEM indicates that much of the sample exists in highly elongated domains. Under such conditions, the flow rate in the elongated domains is expected to scale to a first approximation, as the inverse of the viscosity ratio.84 Based on the viscosity ratio arguments describe earlier, at the global shear rate imposed, the shear rate in the iPP will be approximately 1.6 times that of the HDPE for the three blend samples. Thus, FIC in such blends is expected across the range of compositions relative to the iPP.
A second possible route to consider the enhancement in FIC in the blends relative to pure iPP concerns the differences in FIC between simple shear and extensional shear flows. It is known that extensional flows are far more effective at inducing crystallization than simple shear.67,100 As local flows can be considered as juxtapositions of simple and extensional flows, it follows that when there is a blend, the more complex local flow fields mean that extensional flows are necessarily present. Conceivably, these local extensional flows fields, which are present in the blends but not the pure iPP, are strong enough to induce crystallization beyond that found in the pure iPP. On the other hand, it has been reported that for equal amounts of work, the enhancement in nucleation density is approximately equal between shear and extensional flow,101 and so this remains an open question.
In contrast to our results, Janchai and Yamaguchi68 found that a HDPE–iPP blend did not exhibit FIC at the same composition and shear rate. Instead, higher shear rates were required for FIC to occur, and there was no enhancement in FIC in the blend relative to pure iPP. One explanation for this discrepancy is the differences in thermal and shear protocols between the two systems. Janchai and Yamaguchi used a faster cooling rate of 30 °C/min and applied constant shear while cooling from 190 to 160 °C. When the cooling rate was decreased to 5 °C/min, FIC was observed in the HDPE–iPP blend, signifying the importance of flow and thermal history in the crystallization behavior of polyolefin blends.
CONCLUSION
We have investigated the effect of shear on the crystallization kinetics and morphology of HDPE–iPP blends through a combination of techniques sensitive to mechanical properties, crystallinity, and structure. We find that in the quiescent case, the addition of HDPE slightly inhibits the crystallization of the iPP majority phase. When iPP is the dispersed phase, however, a significant decrease in the crystallization temperature occurs, which we attribute to fractionated crystallization due to the small number of active nuclei determined from optical microscopy. However, under shear, we find an unexpected composition dependence to the iPP crystallization. FIC in iPP increases with decreasing domain size, with droplets of iPP exhibiting the strongest effect, which we attribute to increased microflow fields in and around the iPP phase blended with the higher viscosity HDPE. The HDPE phase exhibited minimal FIC, which we attribute to the difference in shear temperature and HDPE melting temperature.
Overall, this work demonstrates the complex interrelationships that exist between blend composition, processing, and the resulting morphology and subsequent crystallization. This is an important consideration in mechanical recycling of polyolefins which are typically blends. This work examined the effect of a single shear rate and shear temperature on the crystallization kinetics in various blend compositions. Future work is needed to explore this phase space further and understand the effects on mechanical properties. For example, the effects of different viscosity ratios, different shear rates, times, and temperatures, as well as the addition of compatibilizers that change the blend morphology are of particular interest.
Supplementary Material
ACKNOWLEDGMENTS
The authors thank Chase Thompson for performing sizeexclusion chromatography measurements and Braskem for supplying samples of HD7000C HDPE and Barefoot 6021 iPP for our use. Certain commercial equipment, instruments, software, and materials are identified in this paper in order to adequately specify the experimental procedure. Such identification does not imply recommendation or endorsement by the National Institute of Standards and Technology, nor does it imply that the materials or equipment identified are necessarily the best available for the purpose. Official contribution of the National Institute of Standards and Technology; not subject to copyright in the United States.
Footnotes
Supporting Information
The Supporting Information is available free of charge at https://pubs.acs.org/doi/10.1021/acs.macromol.4c01952.
Representative SEC traces and Mark–Houwink plots, detailed results from HT-SEC data analyses, plot showing temperature and shear protocol used for experiments, schematic showing the cryo-fracture procedure performed on blend samples after rheo-Raman experiments, horizontal shift factors from time–temperature superposition with Arrhenius fits, melt rheology data for the polymers prior to compounding, DSC melting curves, additional optical microscopy images of the blends with and without shear, histograms of droplet/string sizes from SEM image analysis, and rheology data from isothermal crystallization experiments of iPP (PDF)
Complete contact information is available at: https://pubs.acs.org/10.1021/acs.macromol.4c01952
The authors declare no competing financial interest.
Contributor Information
McKenzie L. Coughlin, Materials Science and Engineering Division, National Institute of Standards and Technology, Gaithersburg, Maryland 20899, United States
Derek E. Huang, Materials Science and Engineering Division, National Institute of Standards and Technology, Gaithersburg, Maryland 20899, United States
Caitlyn M. Edgar, Materials Science and Engineering Division, National Institute of Standards and Technology, Gaithersburg, Maryland 20899, United States
Anthony P. Kotula, Materials Science and Engineering Division, National Institute of Standards and Technology, Gaithersburg, Maryland 20899, United States
Kalman B. Migler, Materials Science and Engineering Division, National Institute of Standards and Technology, Gaithersburg, Maryland 20899, United States
Data Availability Statement
The primary data underlying this study are openly available in the NIST Public Data Repository at 10.18434/mds2-3152.
REFERENCES
- (1).Geyer R; Jambeck JR; Law KL Production, Use, and Fate of All Plastics Ever Made. Sci. Adv 2017, 3, No. e1700782. [DOI] [PMC free article] [PubMed] [Google Scholar]
- (2).PlasticsEurope. Plastics - the Facts 2019, 2019.
- (3).Yin S; Tuladhar R; Shi F; Shanks RA; Combe M; Collister T Mechanical Reprocessing of Polyolefin Waste: A Review. Polym. Eng. Sci 2015, 55, 2899–2909. [Google Scholar]
- (4).Karaagac E; Jones MP; Koch T; Archodoulaki V-M Polypropylene Contamination in Post-Consumer Polyolefin Waste: Characterisation, Consequences and Compatibilisation. Polymers 2021, 13, 2618. [DOI] [PMC free article] [PubMed] [Google Scholar]
- (5).Luijsterburg B; Goossens H Assessment of Plastic Packaging Waste: Material Origin, Methods, Properties. Resour. Conserv. Recycl 2014, 85, 88–97. [Google Scholar]
- (6).Aumnate C; Rudolph N; Sarmadi M Recycling of Polypropylene/Polyethylene Blends: Effect of Chain Structure on the Crystallization Behaviors. Polymers 2019, 11, 1456. [DOI] [PMC free article] [PubMed] [Google Scholar]
- (7).Eagan JM; Xu J; Di Girolamo R; Thurber CM; Macosko CW; LaPointe AM; Bates FS; Coates GW Combining Polyethylene and Polypropylene: Enhanced Performance with PE/iPP Multiblock Polymers. Science 2017, 355, 814–816. [DOI] [PubMed] [Google Scholar]
- (8).Salih SE; Hamood AF; Abd Alsalam AH Comparison of the Characteristics of LDPE: PP and HDPE: PP Polymer Blends. Mod. Appl. Sci 2013, 7, 33–42. [Google Scholar]
- (9).Mastalygina EE; Popov AA; Kolesnikova NN; Karpova SG Morphology, Thermal Behaviour and Dynamic Properties of the Blends Based on Isotactic Polypropylene and Low-Density Polyethylene. Int. J. Plast. Technol 2015, 19, 68–83. [Google Scholar]
- (10).Huang DE; Kotula AP; Snyder CR; Migler KB Crystallization Kinetics in an Immiscible Polyolefin Blend. Macromolecules 2022, 55, 10921–10932. [DOI] [PMC free article] [PubMed] [Google Scholar]
- (11).Teh JW; Rudin A; Keung JC A Review of Polyethylene-Polypropylene Blends and Their Compatibilization. Adv. Polym. Technol 1994, 13, 1–23. [Google Scholar]
- (12).Bertin S; Robin J-J Study and Characterization of Virgin and Recycled LDPE/PP Blends. Eur. Polym. J 2002, 38, 2255–2264. [Google Scholar]
- (13).Groeninckx G; Harrats C; Vanneste M; Everaert V Crystallization, Micro- and Nano-Structure, and Melting Behavior of Polymer Blends. In Polymer Blends Handbook; Utracki LA, Wilkie CA, Eds.; Springer: Dordrecht, 2014; pp 291–446. [Google Scholar]
- (14).Tselios C; Bikiaris D; Maslis V; Panayiotou C In Situ Compatibilization of Polypropylene-Polyethylene Blends: A Thermo-mechanical and Spectroscopic Study. Polymer 1998, 39, 6807–6817. [Google Scholar]
- (15).Xu J; Eagan JM; Kim S-S; Pan S; Lee B; Klimovica K; Jin K; Lin T-W; Howard MJ; Ellison CJ; LaPointe AM; Coates GW; Bates FS Compatibilization of Isotactic Polypropylene (iPP) and High-Density Polyethylene (HDPE) with iPP-PE Multiblock Copolymers. Macromolecules 2018, 51, 8585–8596. [Google Scholar]
- (16).López-Barrón CR; Tsou AH Strain Hardening of Polyethylene/Polypropylene Blends via Interfacial Reinforcement with Poly(Ethylene-cb-Propylene) Comb Block Copolymers. Macromolecules 2017, 50, 2986–2995. [Google Scholar]
- (17).Ma H; Li T; Pan B; Li J; Jiang S; Peng X; Jing L Tensile Behaviour of Isotactic Polypropylene with Different Crystallinities and Service Temperatures. Polym. Test 2022, 116, 107756. [Google Scholar]
- (18).Shen L; Gorbea GD; Danielson E; Cui S; Ellison CJ; Bates FS Threading-the-Needle: Compatibilization of HDPE/iPP Blends with Butadiene-Derived Polyolefin Block Copolymers. Proc. Natl. Acad. Sci. U. S. A 2023, 120, No. e2301352120. [DOI] [PMC free article] [PubMed] [Google Scholar]
- (19).Darweesh MH; Stoll B; El-Taweel SH Compatibilization of Polypropylene/High-density Polyethylene Blends Using Poly-(Propylene-co-ethylene). J. Appl. Polym. Sci 2023, 140, No. e53687. [Google Scholar]
- (20).Klimovica K; Pan S; Lin T-W; Peng X; Ellison CJ; LaPointe AM; Bates FS; Coates GW Compatibilization of iPP/HDPE Blends with PE-g-iPP Graft Copolymers. ACS Macro Lett. 2020, 9, 1161–1166. [DOI] [PubMed] [Google Scholar]
- (21).Mehrabi-Mazidi M; Sharifi H Post-Consumer Recycled High Density Polyethylene/Polypropylene Blend with Improved Overall Performance through Modification by Impact Polypropylene Copolymer: Morphology, Properties and Fracture Resistance. Polym. Int 2021, 70, 1701–1716. [Google Scholar]
- (22).Graziano A; Titton Dias OA; Sena Maia B; Li J Enhancing the Mechanical, Morphological, and Rheological Behavior of Polyethylene/Polypropylene Blends with Maleic Anhydride-grafted Polyethylene. Polym. Eng. Sci 2021, 61, 2487–2495. [Google Scholar]
- (23).Wolff P; Dickert A; Kretschmer WP; Kempe R iPP/PE Multiblock Copolymers for Plastic Blend Recycling Synthesized by Coordinative Chain Transfer Polymerization. Macromolecules 2022, 55, 6435–6442. [Google Scholar]
- (24).Jordan AM; Kim K; Soetrisno D; Hannah J; Bates FS; Jaffer SA; Lhost O; Macosko CW Role of Crystallization on Polyolefin Interfaces: An Improved Outlook for Polyolefin Blends. Macromolecules 2018, 51, 2506–2516. [Google Scholar]
- (25).Zhou Y-G; Su B; Wu H-H Effect of Cold-Drawn Fibers on the Self-Reinforcement of PP/LDPE Composites. J. Mater. Eng. Perform 2017, 26, 4072–4082. [Google Scholar]
- (26).Qu J; Huang Z; Yang Z; Zhang G; Yin X; Feng Y; He H; Jin G; Wu T; He G; Cao X Industrial-Scale Polypropylene-Polyethylene Physical Alloying Toward Recycling. Engineering 2022, 9, 95–100. [Google Scholar]
- (27).Rosales C; Aranburu N; Otaegi I; Pettarin V; Bernal C; ller AJ; Guerrica-Echevarría G Improving the Mechanical Performance of LDPE/PP Blends through Microfibrillation. ACS Appl. Polym. Mater 2022, 4, 3369–3379. [Google Scholar]
- (28).Fujii Y; Nishikawa R; Phulkerd P; Yamaguchi M Modifying the Rheological Properties of Polypropylene under Elongational Flow by Adding Polyethylene. J. Rheol 2019, 63, 11–18. [Google Scholar]
- (29).Cabrera G; Touil I; Masghouni E; Maazouz A; Lamnawar K Multi-Micro/Nanolayer Films Based on Polyolefins: New Approaches from Eco-Design to Recycling. Polymers 2021, 13, 413. [DOI] [PMC free article] [PubMed] [Google Scholar]
- (30).Jose S; Aprem AS; Francis B; Chandy MC; Werner P; Alstaedt V; Thomas S Phase Morphology, Crystallisation Behaviour and Mechanical Properties of Isotactic Polypropylene/High Density Polyethylene Blends. Eur. Polym. J 2004, 40, 2105–2115. [Google Scholar]
- (31).Rosales C; Bernal C; Pettarin V Effect of Blend Composition and Related Morphology on the Quasi-Static Fracture Performance of LLDPE/PP Blends. Polym. Test 2020, 90, 106598. [Google Scholar]
- (32).Migler KB String Formation in Sheared Polymer Blends: Coalescence, Breakup, and Finite Size Effects. Phys. Rev. Lett 2001, 86, 1023–1026. [DOI] [PubMed] [Google Scholar]
- (33).Monks AW; White HM; Bassett DC On Shish-Kebab Morphologies in Crystalline Polymers. Polymer 1996, 37, 5933–5936. [Google Scholar]
- (34).Derakhshandeh M; Doufas AK; Hatzikiriakos SG Quiescent and Shear-Induced Crystallization of Polyprophylenes. Rheol. Acta 2014, 53, 519–535. [Google Scholar]
- (35).Mi D; Xia C; Jin M; Wang F; Shen K; Zhang J Quantification of the Effect of Shish-Kebab Structure on the Mechanical Properties of Polypropylene Samples by Controlling Shear Layer Thickness. Macromolecules 2016, 49, 4571–4578. [Google Scholar]
- (36).Pötschke P; Paul DR Formation of Co-Continuous Structures in Melt-Mixed Immiscible Polymer Blends. J. Macromol. Sci. - Polym. Rev 2003, 43, 87–141. [Google Scholar]
- (37).You W; Yu W Control of the Dispersed-to-Continuous Transition in Polymer Blends by Viscoelastic Asymmetry. Polymer 2018, 134, 254–262. [Google Scholar]
- (38).Mariam Atiqah AAS; Salmah H; Firuz Z; Lan DNU Effect of Different Blend Ratios and Compatibilizer on Tensile Properties of Recycled Poly(Propylene)/Recycled High Density Polyethylene Blends. Macromol. Symp 2015, 353, 70–76. [Google Scholar]
- (39).Cormia RL; Price FP; Turnbull D Kinetics of Crystal Nucleation in Polyethylene. J. Chem. Phys 1962, 37, 1333–1340. [Google Scholar]
- (40).Sangroniz L; Wang B; Su Y; Liu G; Cavallo D; Wang D; Müller AJ Fractionated Crystallization in Semicrystalline Polymers. Prog. Polym. Sci 2021, 115, 101376. [Google Scholar]
- (41).Morales RA; Arnal ML; Müller AJ The Evaluation of the State of Dispersion in Immiscible Blends Where the Minor Phase Exhibits Fractionated Crystallization. Polym. Bull 1995, 35, 379–386. [Google Scholar]
- (42).Martuscelli E; Pracella M; Avella M; Greco R; Ragosta G Properties of Polyethylene-Polypropylene Blends: Crystallization Behavior. Makromol. Chem 1980, 181, 957–967. [Google Scholar]
- (43).Dong L; Olley RH; Bassett DC; Thomson JJ On Morphology and the Competition between Crystallization and Phase Separation in Polypropylene-Polyethylene Blends. J. Mater. Sci 1998, 33, 4043–4048. [Google Scholar]
- (44).Bartczak Z; Galeski A; Pracella M Spherulite Nucleation in Blends of Isotactic Polypropylene with High-Density Polyethylene. Polymer 1986, 27, 537–543. [Google Scholar]
- (45).Carmeli E; Fenni SE; Caputo MR; Muller AJ; Tranchida D; Cavallo D Surface Nucleation of Dispersed Polyethylene Droplets in Immiscible Blends Revealed by Polypropylene Matrix Self-Nucleation. Macromolecules 2021, 54, 9100–9112. [Google Scholar]
- (46).Li J; Shanks RA; Olley RH; Greenway GR Miscibility and Isothermal Crystallisation of Polypropylene in Polyethylene Melts. Polymer 2001, 42, 7685–7694. [Google Scholar]
- (47).Tien N-D; Prud’homme RE Crystallization Behavior of Semicrystalline Immiscible Polymer Blends. In Crystallization in Multiphase Polymer Systems; Thomas S, P MA; Gowd EB; Kalarikkal N, Eds.; Elsevier: 2018; pp 181–212. [Google Scholar]
- (48).Di Lorenzo ML; Rhoades AM; Androsch R Polymer Crystallization. In Thermal Analysis of Polymeric Materials; Wiley: 2022; Vol. 1, pp 263–302. [Google Scholar]
- (49).Hamad FG; Colby RH; Milner ST Transition in Crystal Morphology for Flow-Induced Crystallization of Isotactic Polypropylene. Macromolecules 2016, 49, 5561–5575. [Google Scholar]
- (50).Kumaraswamy G; Kornfield JA; Yeh F; Hsiao BS Shear-Enhanced Crystallization in Isotactic Polypropylene. 3. Evidence for a Kinetic Pathway to Nucleation. Macromolecules 2002, 35, 1762–1769. [Google Scholar]
- (51).Kumaraswamy G; Verma RK; Kornfield JA; Yeh F; Hsiao BS Shear-Enhanced Crystallization in Isotactic Polypropylene. In-Situ Synchrotron SAXS and WAXD. Macromolecules 2004, 37, 9005–9017. [Google Scholar]
- (52).Hamad FG; Colby RH; Milner ST Onset of Flow-Induced Crystallization Kinetics of Highly Isotactic Polypropylene. Macromolecules 2015, 48, 3725–3738. [Google Scholar]
- (53).Nobile MR; Bove L; Somma E; Kruszelnicka I; Sterzynski T Rheological and Structure Investigation of Shear-Induced Crystallization of Isotactic Polypropylene. Polym. Eng. Sci 2005, 45, 153–162. [Google Scholar]
- (54).Seo J; Takahashi H; Nazari B; Rhoades AM; Schaake RP; Colby RH Isothermal Flow-Induced Crystallization of Polyamide 66 Melts. Macromolecules 2018, 51, 4269–4279. [Google Scholar]
- (55).Kearns KL; Scherzer J; Chyasnavichyus M; Monaenkova D; Moore J; Sammler RL; Fielitz T; Nicholson DA; Andreev M; Rutledge GC Measuring Flow-Induced Crystallization Kinetics of Polyethylene after Processing. Macromolecules 2021, 54, 2101–2112. [Google Scholar]
- (56).Nicholson DA; Andreev M; Kearns KL; Chyasnavichyus M; Monaenkova D; Moore J; Den Doelder J; Rutledge GC Experiments and Modeling of Flow-Enhanced Nucleation in LLDPE. J. Phys. Chem. B 2022, 126, 6529–6535. [DOI] [PubMed] [Google Scholar]
- (57).Mackley MR; Keller A Flow Induced Polymer Chain Extension and Its Relation to Fibrous Crystallization. Philos. Trans. R. Soc. London. Ser. A, Math. Phys. Sci 1975, 278, 29–66. [Google Scholar]
- (58).Jeon HS; Nakatani AI; Hobbie EK; Han CC Phase Inversion of Polybutadiene/Polyisoprene Blends under Quiescent and Shear Conditions. Langmuir 2001, 17, 3087–3095. [Google Scholar]
- (59).Zou F; Dong X; Lin D; Liu W; Wang D; Han CC Morphological and Rheological Responses to the Transient and Steady Shear Flow for a Phase-Separated Polybutadiene/Polyisoprene Blend. Polymer 2012, 53, 4818–4826. [Google Scholar]
- (60).Wang Y; Meng K; Hong S; Xie X; Zhang C; Han CC Shear-Induced Crystallization in a Blend of Isotactic Polypropylene and High Density Polyethylene. Polymer 2009, 50, 636–644. [Google Scholar]
- (61).Wang Y; Na B; Fu Q; Men Y Shear Induced Shish-Kebab Structure in PP and Its Blends with LLDPE. Polymer 2004, 45, 207–215. [Google Scholar]
- (62).Meng K; Dong X; Zhang X; Zhang C; Han CC Shear-Induced Crystallization in a Blend of Isotactic Poly(Propylene) and Poly(Ethylene-co-Octene). Macromol. Rapid Commun 2006, 27, 1677–1683. [Google Scholar]
- (63).Su R; Wang K; Zhao P; Zhang Q; Du R; Fu Q; Li L; Li L Shear-Induced Epitaxial Crystallization in Injection-Molded Bars of High-Density Polyethylene/Isotactic Polypropylene Blends. Polymer 2007, 48, 4529–4536. [Google Scholar]
- (64).Dikovsky D; Marom G; Avila-Orta CA; Somani RH; Hsiao BS Shear-Induced Crystallization in Isotactic Polypropylene Containing Ultra-High Molecular Weight Polyethylene Oriented Precursor Domains. Polymer 2005, 46, 3096–3104. [Google Scholar]
- (65).Na B; Wang Y; Zhang Q; Fu Q Shish and Its Relaxation Dependence of Re-Crystallization of Isotactic Polypropylene from an Oriented Melt in the Blends with High-Density Polyethylene. Polymer 2004, 45, 6245–6260. [Google Scholar]
- (66).Yu F; Zhang H; Zheng H; Yu W; Zhou C Experimental Study of Flow-Induced Crystallization in the Blends of Isotactic Polypropylene and Poly(Ethylene-co-Octene). Eur. Polym. J 2008, 44, 79–86. [Google Scholar]
- (67).Yu F; Zhang Z; Yu W; Zhou C; Zhang H Modeling of Flow-Induced Crystallization in Blends of Isotactic Polypropylene and Poly(Ethylene-co-Octene). Polym. Int 2012, 61, 1389–1393. [Google Scholar]
- (68).Janchai K; Yamaguchi M Shear-Induced Crystallization of Polypropylene/Low-Density Polyethylene Blend. J. Rheol 2024, 68, 59–69. [Google Scholar]
- (69).Carrot C; Guillet J; Boutahar K Rheological Behavior of a Semi-Crystalline Polymer during Isothermal Crystallization. Rheol. Acta 1993, 32, 566–574. [Google Scholar]
- (70).Pogodina NV; Winter HH Polypropylene Crystallization as a Physical Gelation Process. Macromolecules 1998, 31, 8164–8172. [Google Scholar]
- (71).Kotula AP; Migler KB Percolation Implications in the Rheology of Polymer Crystallization. Polym. Cryst 2021, 4, No. e10162. [DOI] [PMC free article] [PubMed] [Google Scholar]
- (72).Sohma J Mechanochemistry of Polymers. Prog. Polym. Sci 1989, 14, 451–596. [Google Scholar]
- (73).Aydonat S; Hergesell AH; Seitzinger CL; Lennarz R; Chang G; Sievers C; Meisner J; Vollmer I; Göstl R Leveraging Mechanochemistry for Sustainable Polymer Degradation. Polym. J 2024, 56, 249–268. [Google Scholar]
- (74).Orski SV; Kassekert LA; Farrell WS; Kenlaw GA; Hillmyer MA; Beers KL Design and Characterization of Model Linear Low-Density Polyethylenes (LLDPEs) by Multidetector Size Exclusion Chromatography. Macromolecules 2020, 53, 2344–2353. [Google Scholar]
- (75).Kotula AP; Meyer MW; De Vito F; Plog J; Hight Walker AR; Migler KB The Rheo-Raman Microscope: Simultaneous Chemical, Conformational, Mechanical, and Microstructural Measures of Soft Materials. Rev. Sci. Instrum 2016, 87, 105105. [DOI] [PubMed] [Google Scholar]
- (76).Woo EM; Lee M Crystallization in Arylate Polyesters to Periodically Ringed Assembly. Polym. Cryst 2018, 1, No. e10018. [Google Scholar]
- (77).Jaumot J; Gargallo R; de Juan A; Tauler R A Graphical User-Friendly Interface for MCR-ALS: A New Tool for Multivariate Curve Resolution in MATLAB. Chemom. Intell. Lab. Syst 2005, 76, 101–110. [Google Scholar]
- (78).Jaumot J; de Juan A; Tauler R MCR-ALS GUI 2.0: New Features and Applications. Chemom. Intell. Lab. Syst 2015, 140, 1–12. [Google Scholar]
- (79).Strobl GR; Hagedorn W Raman Spectroscopic Method for Determining the Crystallinity of Polyethylene. J. Polym. Sci. Polym. Phys. Ed 1978, 16, 1181–1193. [Google Scholar]
- (80).Nielsen AS; Batchelder DN; Pyrz R Estimation of Crystallinity of Isotactic Polypropylene Using Raman Spectroscopy. Polymer 2002, 43, 2671–2676. [Google Scholar]
- (81).Martin J; Bourson P; Dahoun A; Hiver JM The β-Spherulite Morphology of Isotactic Polypropylene Investigated by Raman Spectroscopy. Appl. Spectrosc 2009, 63, 1377–1381. [DOI] [PubMed] [Google Scholar]
- (82).Chalmers JM; Edwards HGM; Lees JS; Long DA; Mackenzie MW; Willis HA Raman Spectra of Polymorphs of Isotactic Polypropylene. J. Raman Spectrosc 1991, 22, 613–618. [Google Scholar]
- (83).Wu S Formation of Dispersed Phase in Incompatible Polymer Blends: Interfacial and Rheological Effects. Polym. Eng. Sci 1987, 27, 335–343. [Google Scholar]
- (84).Delaby I; Ernst B; Germain Y; Muller R Droplet Deformation in Polymer Blends during Uniaxial Elongational Flow: Influence of Viscosity Ratio for Large Capillary Numbers. J. Rheol 1994, 38, 1705–1720. [Google Scholar]
- (85).Cox WP; Merz EH Rheology of Polymer Melts: A Correlation of Dynamic and Steady Flow Viscosities. J. Polym. Sci 1958, 28, 619–622. [Google Scholar]
- (86).Souza AMC; Demarquette NR Influence of Coalescence and Interfacial Tension on the Morphology of PP/HDPE Compatibilized Blends. Polymer 2002, 43, 3959–3967. [Google Scholar]
- (87).Cui K; Ma Z; Tian N; Su F; Liu D; Li L Multiscale and Multistep Ordering of Flow-Induced Nucleation of Polymers. Chem. Rev 2018, 118, 1840–1886. [DOI] [PubMed] [Google Scholar]
- (88).Wang Z; Ma Z; Li L Flow-Induced Crystallization of Polymers: Molecular and Thermodynamic Considerations. Macromolecules 2016, 49, 1505–1517. [Google Scholar]
- (89).Dealy JM; Read DJ; Larson RG Structure and Rheology of Molten Polymers, 2nd ed.; Hanser: Munich, 2018. [Google Scholar]
- (90).Likhtman AE; McLeish TCB Quantitative Theory for Linear Dynamics of Linear Entangled Polymers. Macromolecules 2002, 35, 6332–6343. [Google Scholar]
- (91).Roy D; Audus DJ; Migler KB Rheology of Crystallizing Polymers: The Role of Spherulitic Superstructures, Gap Height, and Nucleation Densities. J. Rheol 2019, 63, 851–862. [DOI] [PMC free article] [PubMed] [Google Scholar]
- (92).Han CC; Yao Y; Zhang R; Hobbie EK Effect of Shear Flow on Multi-Component Polymer Mixtures. Polymer 2006, 47, 3271–3286. [Google Scholar]
- (93).Kielhorn L; Colby RH; Han CC Relaxation Behavior of Polymer Blends after the Cessation of Shear. Macromolecules 2000, 33, 2486–2496. [Google Scholar]
- (94).Brown N A Theory for Environmental Craze Yielding of Polymers at Low Temperatures. J. Polym. Sci. Polym. Phys. Ed 1973, 11, 2099–2111. [Google Scholar]
- (95).Kamei E; Brown N Crazing in Polyethylene. J. Polym. Sci. Polym. Phys. Ed 1984, 22, 543–559. [Google Scholar]
- (96).Piorkowska E; Rutledge GC Handbook of Polymer Crystallization; Wiley: 2013. [Google Scholar]
- (97).Hamad FG; Colby RH; Milner ST Lifetime of Flow-Induced Precursors in Isotactic Polypropylene. Macromolecules 2015, 48, 7286–7299. [Google Scholar]
- (98).Zinet M; El Otmani R; Boutaous M; Chantrenne P Numerical Modeling of Nonisothermal Polymer Crystallization Kinetics: Flow and Thermal Effects. Polym. Eng. Sci 2010, 50, 2044–2059. [Google Scholar]
- (99).van Erp TB; Balzano L; Spoelstra AB; Govaert LE; Peters GWM Quantification of Non-Isothermal, Multi-Phase Crystallization of Isotactic Polypropylene: The Influence of Shear and Pressure. Polymer 2012, 53, 5896–5908. [Google Scholar]
- (100).Derakhshandeh M; Hatzikiriakos SG Flow-Induced Crystallization of High-Density Polyethylene: The Effects of Shear and Uniaxial Extension. Rheol. Acta 2012, 51, 315–327. [Google Scholar]
- (101).Janeschitz-Kriegl H; Ratajski E; Stadlbauer M Flow as an Effective Promotor of Nucleation in Polymer Melts: A Quantitative Evaluation. Rheol. Acta 2003, 42, 355–364. [Google Scholar]
Associated Data
This section collects any data citations, data availability statements, or supplementary materials included in this article.
Supplementary Materials
Data Availability Statement
The primary data underlying this study are openly available in the NIST Public Data Repository at 10.18434/mds2-3152.