Abstract
Obtaining the mesostructure of concrete from X-ray computed tomography (CT) requires segmentation of the data into distinct phases, a process complicated by the limited contrast between aggregates and mortar matrix. This paper explores the possibility to add baryte or hematite into the concrete mixture to enhance the contrast between cement paste and aggregates in CT, thus allowing for a semi-automatic segmentation. Raw and segmented CT images of plain and modified concrete mixtures are obtained and compared to assess the validity of the proposed approach. Characterization tests are also performed in order to ensure that the concrete characteristics are not appreciably affected by the presence of the enhancers.
Keywords: Concrete mesostructure, Computed tomography, Segmentation, Numerical modeling
1. Introduction
Concrete is a complex heterogeneous material composed, at the mesoscale, of a cementitious matrix, aggregates and pores. It is nowadays widely accepted that a deeper understanding of its mechanical performance can be gained by modeling its mesostructure explicitly [1–3]. The latter can be obtained mainly through artificial generation [4–7] or 3D imaging techniques, such as X-ray computed tomography (CT) [1, 8–12]. While the former is usually computationally expensive or oversimplified, the latter has become an attractive option in the past few years.
The CT imaging technique involves the collection of a certain number of X-ray projections, displaying the attenuation of the scanned sample as grayscale values (GSV). These images need to be further post-processed in order to be quantitatively analyzed and/or converted into data suitable to be used, e.g., in numerical codes (namely, for the generation of meshes). Three different stages can be identified: (i) 3D volume reconstruction from the 2D projections, (ii) segmentation into the desired number of phases and (iii) detection of the interfaces between the phases followed by volumetric mesh generation [1]. Herein, we restrict ourselves to the study of the first two stages, while the final mesh generation for the numerical analysis is outside the scope of this paper.
The reconstruction step is performed by applying algorithms like the Feldkamp-Davis-Kress (FDK) algorithm [13] or, less commonly, iterative reconstruction [14] to the set of projections so as to obtain a volumetric 3D grayscale image (raw image). In this phase, it is necessary to compensate for possible artifacts, especially those due to beam hardening (BH) [1, 15–17]. The latter occurs when a polychromatic X-ray beam (i.e., composed of photons with a certain spectrum of energies) increases its mean energy (namely, it hardens) while passing through a material because the low-energy photons are absorbed at a higher rate compared to the high-energy ones. This ultimately leads to a change of the beam energy with the thickness, which, in turn, affects non-linearly the attenuation (i.e., the capacity of the material to absorb energy from the X-ray beam) creating a fictitious gradient in the attenuation images, i.e. the GSV vary even for a homogeneous material [15]. In particular, the core of a scanned sample, which is radiated with higher mean energies, appears darker than the outer part, so it might be hard to distinguish between air voids and solid material. This specific condition is termed a cupping artifact (from the cup shape that the GSV profile of a homogeneous material assumes) and can be partially compensated by assuming a nonlinear relation between logarithmic intensity decrease and thickness [16]. BH is also responsible for streaking and shadowing artifacts that take place in heterogeneous materials when particles of very absorptive material are present. These locally harden the X-ray beam so that both narrow bright stripes (streaking) as well as dark areas (shadowing) might appear in the neighboring material. Since these two artifacts are localized effects due to the internal organization of the material, they cannot be easily corrected and they should be avoided as much as possible by excluding clusters of very absorptive material and by using narrow and high energy spectra, e.g. by use of thin (usually metallic) filters to cut-off the lowest energies and pre-harden the X-ray beam [1].
The segmentation step can be performed either manually or (semi-) automatically [18, 19]. In the first case, regions of material are selected and labeled as being part of a certain phase by the operator, making this approach time-consuming and viable only for simple geometries and limited sample dimensions (e.g., for 2D imaging) [1, 18]. For 3D volumes or complex geometries (such as for cementitious composites) an automatic or semi-automatic (where the operator interaction is mainly related to the input of parameters for the segmentation algorithm) procedure is needed [1, 9, 18, 20–23]. To this end different methods are available and can be subdivided into three main families: (i) thresholding, (ii) gradient-based methods and (iii) pattern detection algorithms [1]. In thresholding, the various phases are identified by assigning to each of them a certain range of GSV [24, 25]. This approach, which is the simplest and most versatile, requires phases with significantly different attenuation coefficients and the absence of artificial gradients in the GSV (e.g. BH artifacts). Gradient-based methods [18, 26] rely on the assumption that regions with high GSV gradients correspond to the boundaries between the phases, which can be then filled (e.g. using local maximum markers and a flooding algorithm) to find their volumes. These methods require that all regions belonging to a single phase are enclosed in the identified boundaries and, again, the absence of artificial gradients [24, 25]. Pattern detection identifies clusters of material matching certain geometrical features (e.g., spheres or ellipsoids). Although less influenced by the image noise than the other two methods, the applicability of pattern detection algorithms is limited by the need for the particle geometries to be known a-priori [1].
The segmentation of cementitious composites is not trivial because of the limited contrast between cementitious matrix and aggregates following their very similar composition and density. This means that the identification of GSV ranges or gradients for thresholding or gradient-based methods is not straightforward and usually leads to segmentation errors that need to be manually corrected by the operator, thus involving a time-consuming procedure. Moreover, the arbitrary and complex geometry of the aggregates precludes the adoption of pattern-detection algorithms [1]. While semi-automatic thresholding and gradient-based methods can successfully identify pores in cementitious materials [9, 27–29], the segmentation of the cement paste and the aggregates still requires, to date, a massive operator intervention and remains an open issue.
Another aspect to take into consideration when segmenting CT scan images of cementitious composites are the dimensions of the aggregates, which span a few orders of magnitude (e.g., from 50 μm up to 35 mm to 40 mm for concrete). Depending on the dimensions of the specimen and the desired following analyses, a threshold length above which the heterogeneities are explicitly identified and segmented should be defined. This avoids an overly detailed segmented volume, which can lead to an excessive computational effort during the numerical analyses [1, 9].
In the present paper, we explore the possibility to modify the concrete mixture by adding highly X-ray absorptive minerals to enhance the contrast between the cementitious matrix and the aggregates, allowing for an easier and semi-automatic segmentation. In particular, baryte powder and hematite gravel are adopted as contrast enhancers. The raw as well as segmented images of both normal (i.e., plain concrete) and modified concrete mixtures are compared to demonstrate the validity of the approach. Also, mechanical and calorimetric tests are performed in order to ensure that the mechanical properties and hydration processes of the concrete are not significantly affected by the presence of the enhancer.
The paper is structured as follows: in section 2 the investigated concrete mixtures are illustrated along with the performed tests and the obtained results. In section 3 grayscale images (slices) from the CT scans for the various mixtures are presented after the description of the CT imaging and the 3D reconstruction methods employed. In section 4 the image post-processing, the segmentation strategy and the obtained results are illustrated for each tested mixture. A discussion of the results and the conclusions are found in sections 5 and 6, respectively.
2. Materials characterization
In this section the mix design and the preparation of the specimens is illustrated, along with the performed characterization tests.
2.1. Mix design
The mix design of the reference concrete aims at reproducing a standard concrete that can be found in real applications. It is made with ordinary Portland cement without any additives and quartzite aggregates with density . The composition, in terms of water-to-cement ratio , type of cement and content , maximum aggregate size and total aggregate content , is given in Tab. 1.
Tab. 1:
Composition of the adopted concrete.
| w/c [−] | Cement | [mm] | Aggregates | |
|---|---|---|---|---|
| type [−] | content - [kg/m3] | content - [kg/m3] | ||
|
| ||||
| 0.50 | CEM I 42.5 N | 370 | 8 | 1700 |
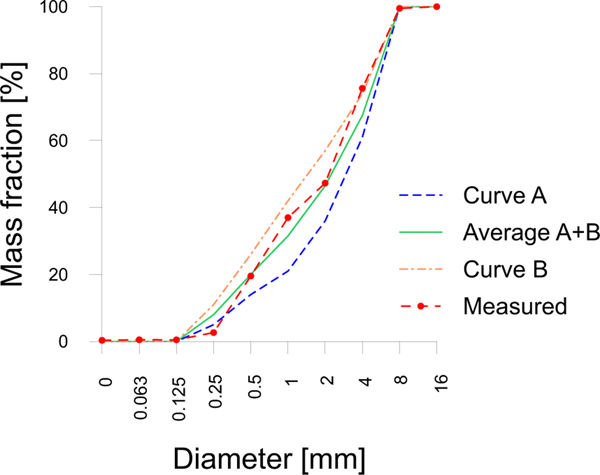
As it will be better clarified in sect. 3, the maximum aggregate diameter is limited to 8 mm to allow casting specimens with dimensions ensuring a good resolution during the CT imaging. Also, the granulometric curve of the aggregates is chosen so as to comply with the European standards [30] (Fig. 1).
Fig. 1:
Adopted granulometric curve of the aggregates and comparison with the two reference curves and suggested in [30].
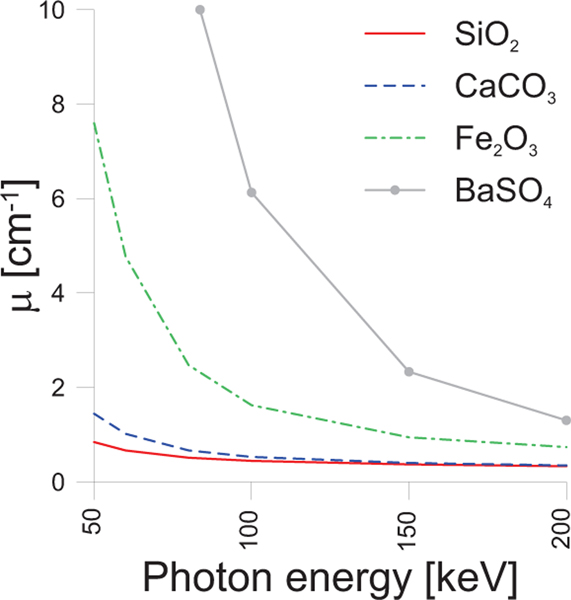
One standard and five modified mixtures are studied. Of the latter, one has the aggregates in the diameter range of 2 mm to 8 mm replaced by an equivalent volume of crushed hematite gravel, while the remaining four are cast substituting part of the finest aggregate fraction, i.e. the fraction with size ≤ 250 μm, with an equivalent volume of baryte. In particular, 0.5–1.0–2.0–2.6 % of the total aggregate content is substituted with an equivalent volume of baryte powder. The highest amount of baryte used (i.e., 2.6 %) corresponds to the complete substitution of the aggregate fraction with diameter ≤ 250 μm. Hematite (mineral form of iron(III) oxide, , density ) and baryte (mineral form of barium sulfate, , density ) are chosen because of their higher X-ray attenuation coefficients with respect to the main components of the cementitious matrix and aggregates (calcium carbonate with density and silicon dioxide with density ), as shown in Fig. 2 [31]. The main difference between baryte and hematite is that the former is mostly chemically inert, while the latter is known to interfere with the hardening process of concrete [32–35]. Another difference is that baryte is usually found as a powder, conversely hematite is normally provided as gravel because it is a harder mineral. The mix design of the investigated mixtures is reported in Tabs. 2 and 3, respectively, for the hematite and the baryte-modified concretes. Tab. 3 reports also the composition of the control concrete used as the reference.
Fig. 2:
Attenuation coefficients [31] of the major components of concrete ( and ), hematite and baryte .
Tab. 2:
Mix design of the concrete modified with hematite.
| Ratio by mass | |||||||
|---|---|---|---|---|---|---|---|
| Sample | Cement | Water | Aggregates [mm] 0–2 | Hematite | |||
|
| |||||||
| Hematite | 1 | : | 0.50 | : | 1.88 | : | 5.65 |
Tab. 3:
Mix design of the reference concrete and of the concretes modified with baryte.
| Sample | Ratio by mass | ||||||||
|---|---|---|---|---|---|---|---|---|---|
| Cement | Water | Aggregates [mm] | Baryte | ||||||
| ≤ 0.25 | 0.25–8 | ||||||||
|
| |||||||||
| 0.0 % (control) | 1 | : | 0.50 | : | 0.12 | : | 4.46 | : | 0.00 |
| 0.5 % | 1 | : | 0.50 | : | 0.10 | : | 4.46 | : | 0.04 |
| 1.0 % | 1 | : | 0.50 | : | 0.07 | : | 4.46 | : | 0.08 |
| 2.0 % | 1 | : | 0.50 | : | 0.03 | : | 4.46 | : | 0.16 |
| 2.6 % | 1 | : | 0.50 | : | 0.00 | : | 4.46 | : | 0.20 |
2.2. Specimen casting and curing
For each concrete mixture, two small cylinders with diameter and length are cast to be used for the 3D imaging. For the control and baryte-modified mixtures, a cube with a total volume of 7.5 L and two cylinders with and are obtained to perform semi-adiabatic calorimetry and ultrasonic tests, respectively. For the same mixtures, an additional four cylinders with dimensions and are cast to perform compression tests. All the molds containing the mixtures are compacted using a vibrating table before being sealed and stored under laboratory conditions for 24 h. The specimens are then demolded and stored in water saturated with calcium hydroxide (). One of the two 40 mm × 160 mm cylinders is removed from the bath after 14 days, dried for 24 hours and then used to calibrate the parameters of the CT scanner, as further explained in sect. 3. The other specimens are removed after 28 days, dried for 24 hours and then the 80 mm × 160 mm cylinders are tested in compression (sect. 2.3.1), while the remaining small cylinders are used for the 3D imaging (sect. 3).
The characterization tests are performed only for the control and baryte modified mixtures because comparing the hematite concrete with a standard concrete would be meaningless for two main reasons. As already outlined in sect. 2.1, the iron oxide interacts with the cement hydration reactions, moreover the coarser aggregates are substituted with a stiffer material (i.e., the hematite). For both reasons, a different mechanical behavior is to be expected, as documented in [32–35].
2.3. Experimental characterization
This section illustrates the setups adopted to experimentally characterize the concrete mixtures along with the obtained results. In particular, compression, semi-adiabatic calorimetry and ultrasonic tests are performed.
2.3.1. Compression tests
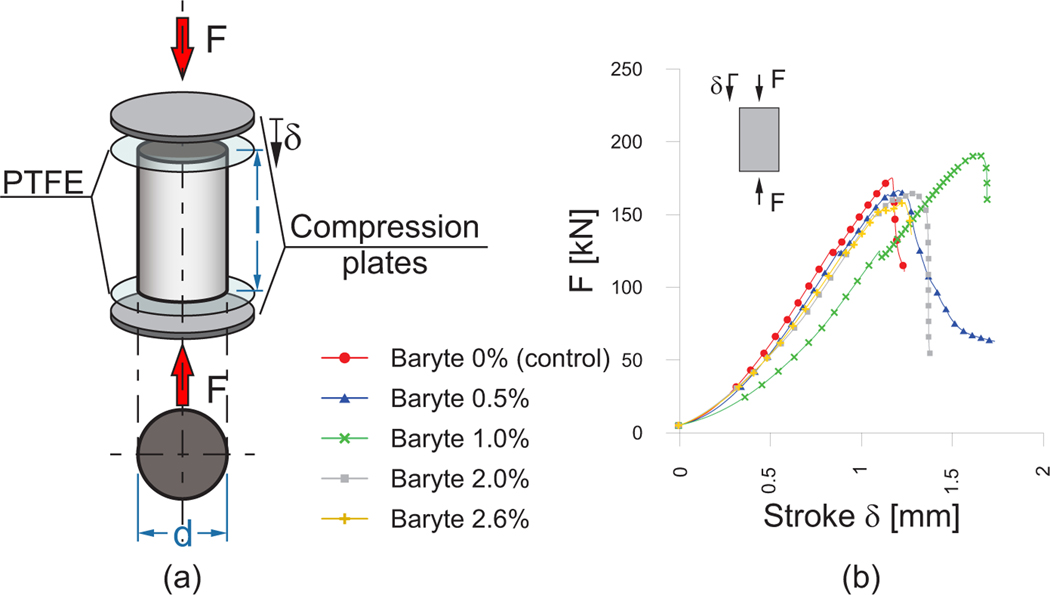
The compressive strength of the control and baryte-modified samples is determined by testing in compression the 80 mm × 160 mm cylinders. The scheme of the performed tests is presented in Fig. 3a. Two polytetrafluoroethylene (PTFE) sheets are placed between the upper and lower faces of the specimens and the machine plates to limit friction. The tests are performed in displacement control. The applied displacement rate is kept constant and equal to 0.6 mm/min up to 125 kN and then reduced to 0.025 mm/min until failure occurs. Fig. 3b shows examples of the load vs. stroke (i.e., actuator displacement) curves.
Fig. 3:
(a) Scheme of the compression tests. (b) Illustrative load-actuator displacement curves.
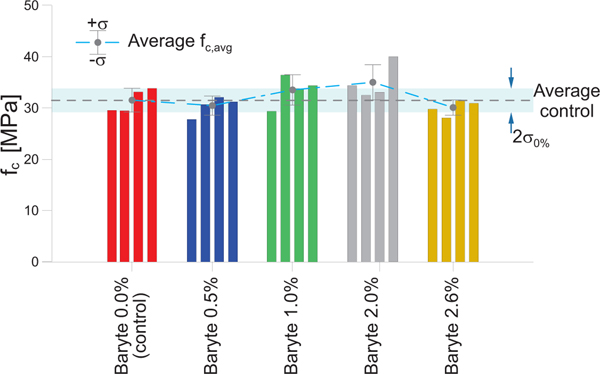
Tab. 4 and Fig. 4 report the results of the calculated compressive tests, including the maximum force attained and the compressive strength , along with the average compressive strength and the standard deviation for each baryte content. No relevant differences are observed among the various mixtures.
Tab. 4:
Result of the compression tests on the mixtures modified with baryte.
| % Baryte | [kN] | [MPa] | Average St. dev. | |
|---|---|---|---|---|
| [MPa] | [%] | |||
|
| ||||
| 0.0 % (control) | 150.1 | 29.6 | ||
| 150.1 | 29.5 | |||
| 171.2 | 33.1 | 31.5 | 7.32 | |
| 170.2 | 33.9 | |||
|
| ||||
| 0.5 % | 139.7 | 27.8 | ||
| 154.4 | 30.7 | |||
| 161.4 | 32.1 | 30.5 | 6.14 | |
| 157.0 | 31.2 | |||
|
| ||||
| 1.0 % | 147.0 | 29.4 | ||
| 183.6 | 36.4 | |||
| 175.5 | 33.8 | 33.5 | 8.86 | |
| 190.8 | 34.4 | |||
|
| ||||
| 2.0 % | 173.3 | 34.4 | ||
| 165.5 | 32.5 | |||
| 171.8 | 33.1 | 35.0 | 9.78 | |
| 206.1 | 40.0 | |||
|
| ||||
| 2.6 % | 149.8 | 29.8 | ||
| 141.3 | 28.1 | |||
| 158.2 | 31.5 | 30.1 | 4.96 | |
| 143.6 | 31.0 | |||
Fig. 4:
Compressive strength of concrete modified with baryte.
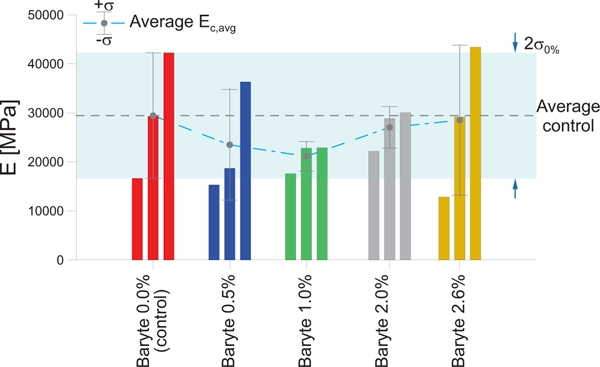
The Young’s modulus is also determined during the compression tests. The longitudinal deformation of three cylinders for each mixture type is monitored by using a digital image correlation (DIC) technique [36]. For this purpose, on part of the outer surface of the cylinders a speckle pattern is created. The DIC technique tracks the changes of the speckle pattern due to the deformation of the sample. The compressive stress vs. longitudinal strain curve is obtained by digitally overlying over the speckle pattern a virtual strain gauge with a length of 35 mm vertically at the center of the specimen height. The Young’s modulus is then obtained from the slope of a linear regression of the curve in the stress range between 5 MPa and 20 MPa. The results are presented and compared in Fig. 5. A large scatter is obtained for all sets of samples, which is due to the sensitivity to the quality of the speckle pattern along with the limitations in resolution of the DIC. In this case, spray paint is used on a curved outer surface, apparently leading to a non-optimal condition. However, no clear trend of variation can be seen with increasing baryte content.
Fig. 5:
Elastic modulus of concrete modified with baryte.
2.3.2. Semi-adiabatic calorimetry
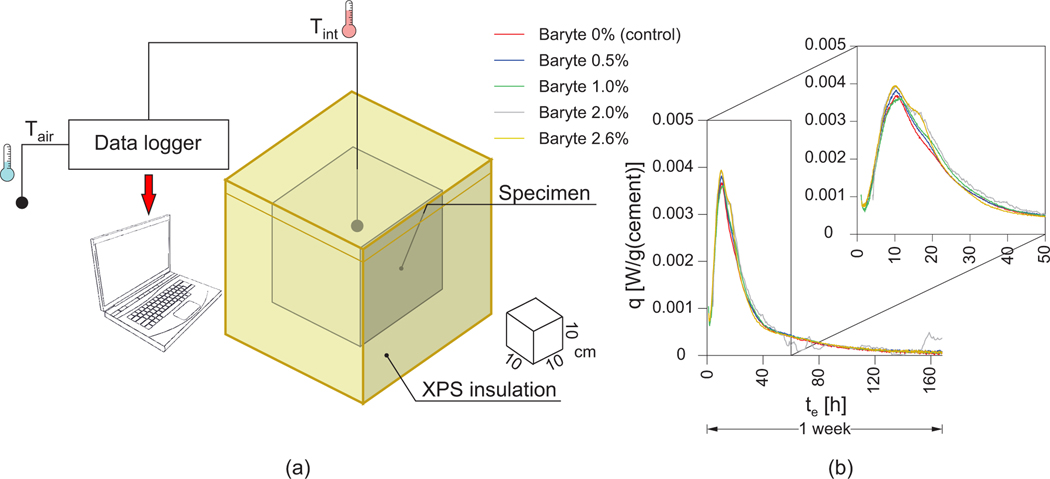
To investigate the hydration process of the control and modified mixtures a series of semi-adiabatic calorimetry tests is performed. A customized setup is developed [37] following the suggestions of EN 196–9 [38] and is sketched in Fig. 6a. A specimen with a total volume of 7.5 L is cast into a cubic mold, which is then placed into a thermally insulated cell made of extruded polystyrene hard foam (XPS). The thickness of the cell walls is 100 mm in order to keep the heat loss to a minimum [39]. During the casting, a temperature transducer is embedded at the center of the specimen to measure the change in time of the temperature of the concrete , while another sensor keeps track of the external environmental temperature (Fig. 6a).
Fig. 6:
Semi-adiabatic calorimetric tests: (a) scheme of the setup and (b) obtained results.
Because of the presence of heat losses due to the semi-adiabatic conditions, the measured results are influenced by the air temperature and its evolution in time . As a result, represents a lower estimate compared to what is obtained in adiabatic conditions . This means that, the time needed in semi-adiabatic conditions to reach a certain temperature increase is higher than in the adiabatic case, namely with . Hence, to compensate for such a spurious effect and thus permitting a better estimate of the total heat released during the hydration process , the time axis should be rescaled to the effective time . This can be done following the procedure illustrated in Appendix A. The results for all the mixtures are presented in Fig. 6b and demonstrate that the hydration process is not significantly affected by the presence of the baryte.
2.3.3. Ultrasonic tests
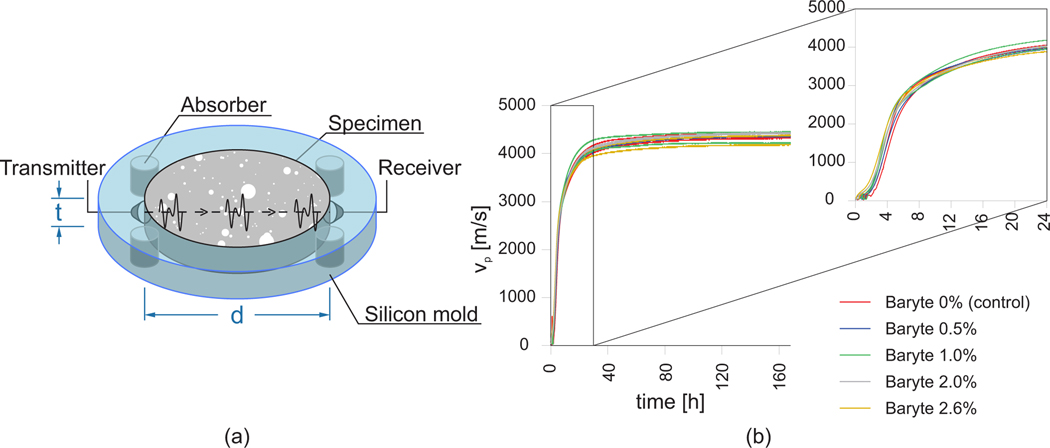
Ultrasonic measurements are also performed during the first period of hardening of the specimens. For each mixture, two specimens are obtained by pouring 140 ml of the fresh mixture into a disc-shaped silicon container with a diameter and a thickness , as illustrated in Fig. 7a. Each container is equipped with 4 vibration absorbers to reduce the background noise, an ultrasonic emitter with a resonance frequency of 30 kHz, and a receiver placed at two opposite points along the diameter. The system records every 60 s (i.e., with a frequency of 0.017 Hz) the ultrasonic pulse runtime and, hence, the ultrasonic pulse velocity The ultrasonic pulse velocity can be directly related to the major dynamic elastic properties of concrete, thus, it measures the advancement of the hardening process, i.e. of the hydration reactions. Note that the initial part of the curve, i.e. fot , does not provide quantitatively meaningful results because of attenuation and reflection phenomena taking place in the fresh viscous liquid-like concrete suspension [40–42]. However, it is evident that the curves are in very good agreement already from the very beginning.
Fig. 7:
Ultrasonic tests: (a) scheme of the setup and (b) obtained results.
Moreover, following the approach proposed in [43], it is possible to have a direct estimation of the dynamic elastic modulus of the concrete . Assuming a dynamic Poisson’s ratio for all the mixtures, and considering a direct transmission of the ultrasonic waves [43], one has
| (1) |
By averaging the calculated values of within the horizontal asymptotic branch of the curve (i.e., when most of the hydration process has been developed), an estimate of the final dynamic elastic modulus can be obtained. Here, it is assumed that the asymptote is reached after 48 h of hydration, a value in good agreement with the observed results (Fig. 7b) and also supported by the calorimetry curves (Fig. 6b).
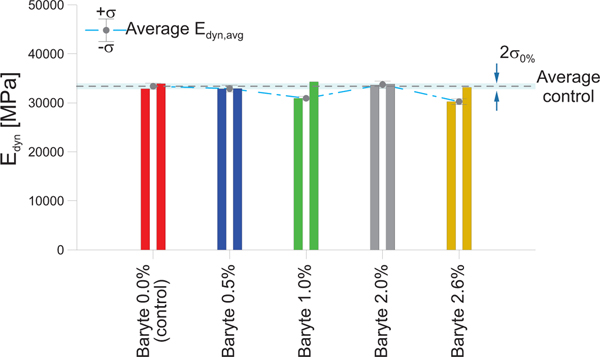
Fig. 7b compares the obtained vs. curves, while in Fig. 8 the values of for all the mixtures are shown. Both figures confirm the negligible influence of the baryte presence on the hardening process of the concrete.
Fig. 8:
Measured dynamic elastic moduli.
3. Experimental 3D imaging
The 40 mm × 160 mm cylinders of the control, the baryte-modified and the hematite concrete are placed into a CT scanner to obtain their 3D mesostructure. In particular, as already outlined in sect. 2.2, for each mixture the first cylinder (14 d of hydration) is used to calibrate the settings of the CT scanner (a General Electric 1) so as to maximize the contrast of all specimens with a single set of parameters. The obtained settings are summarized in Tab. 5 and adopted for all the images analyzed here, if not differently specified. Note that, although the adoption of a single set of parameters does not allow to optimize the contrast of a single sample, it permits an easier comparison of the results, especially in terms of GSV histograms. To analyze the influence of this choice on the segmentation procedure, in sect. 3.1 another CT image of the plain concrete mix is obtained by tailoring the CT scan settings for that specific sample.
Tab. 5:
Parameters used during the CT imaging.
| Voltage [kV] | Current [μA] | Number of images | Image average | Exposure [ms] | Voxel size [μm] | Filter |
|---|---|---|---|---|---|---|
|
| ||||||
| 190 | 190 | 720 | 12 | 500 | 41 | 0.1 mm |
3.1. CT attenuation images and 3D reconstruction
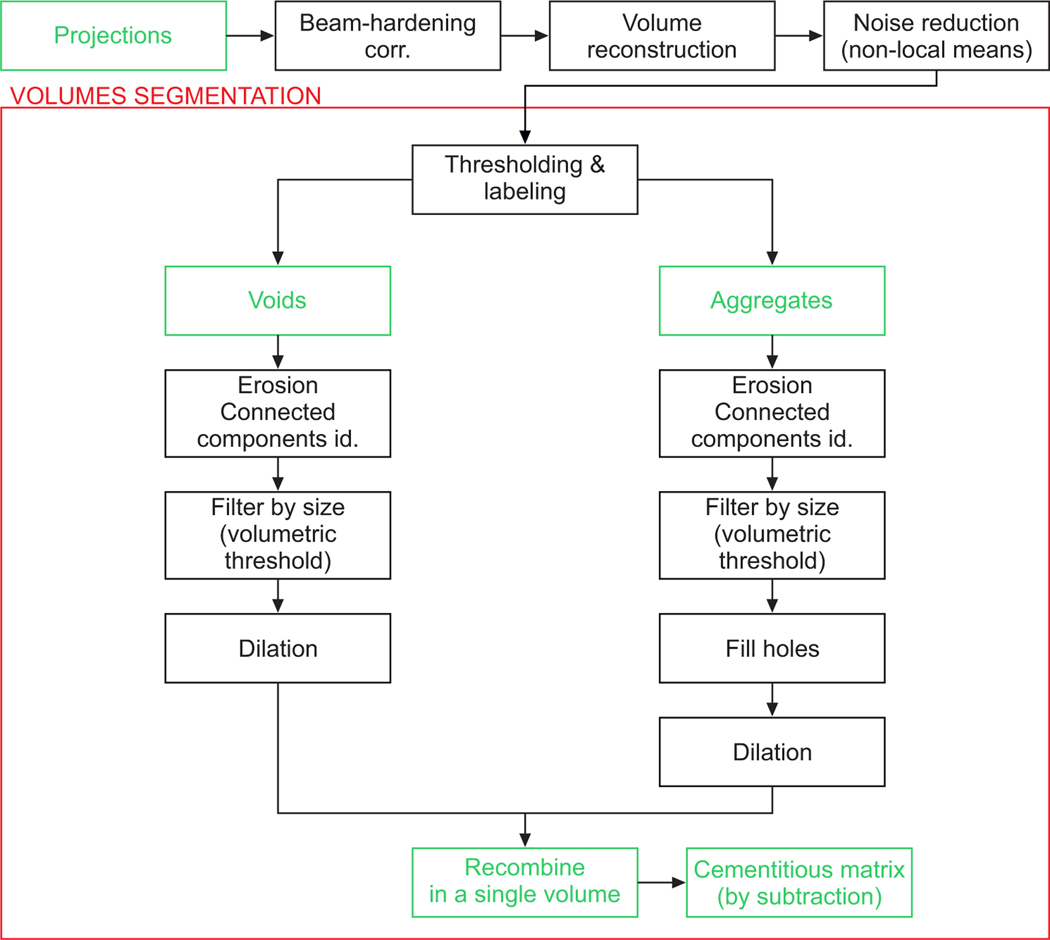
From the X-ray projections of a sample, the volumetric image is obtained by applying a 3D reconstruction algorithm (Fig. 12). Here, the software Octopus [44]2 is used since it allows for flexible BH correction.
Fig. 12:
Flowchart used for the post-processing and segmentation phases.
Fig. 9 shows unprocessed slices of the studied specimens. For the baryte-modified mixtures (Figs. 9b–e) an apparently brighter outer ring is present and increasingly evident as more baryte is added to the mixture. This is not due to BH but, rather, to a wall packing effect similar to the one responsible for the formation of the interfacial transition zone in concrete [45]. This leads to a lack of coarse aggregates replaced by baryte-rich cementitious matrix close to the inner surface of the mold used to cast the specimens. For the control concrete, the contrast is clearly insufficient to distinguish between bulk matrix and aggregates (Fig. 9a). However, adding baryte even in low concentration clearly improves the contrast, as observable already in Fig. 9b. Increasing the content of baryte leads to a continuous improvement of the contrast (Fig. 9b–e), so that for the specimen with 2.6 % of baryte, all aggregates within the size range of interest are easily identifiable (Fig. 9e).
Fig. 9:
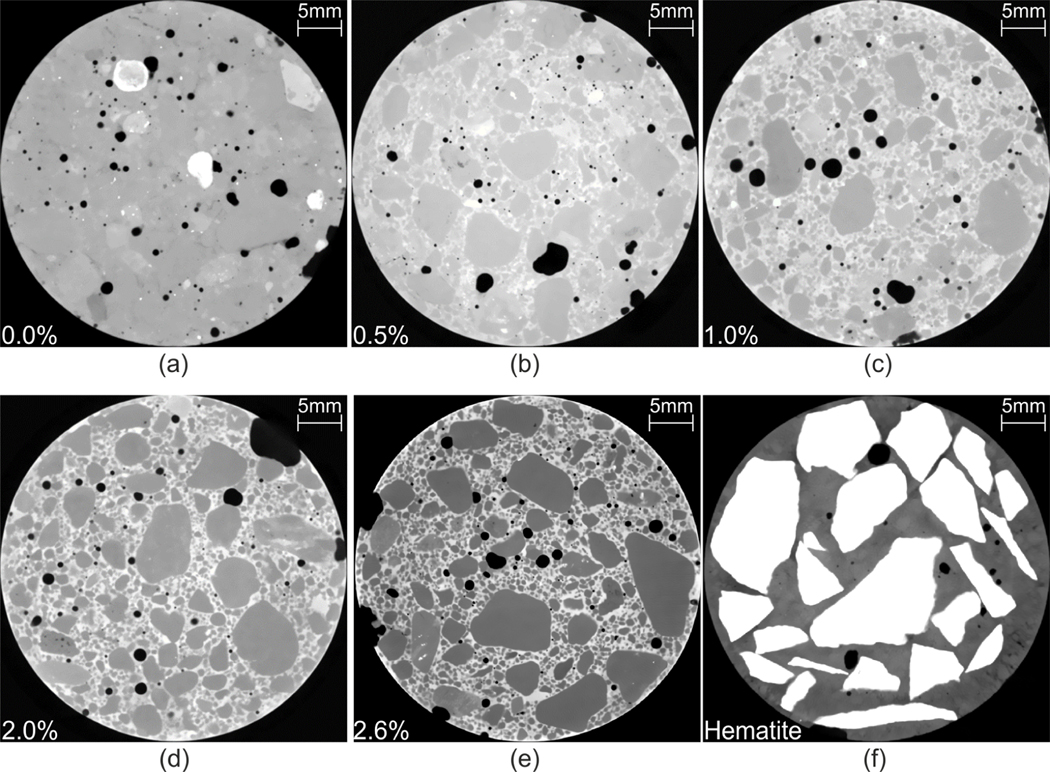
CT attenuation images of the specimens: control concrete (a), modified concrete with a baryte content of 0.5 % (b), 1.0 % (c), 2.0 % (d), 2.6 % (e) and hematite concrete (f).
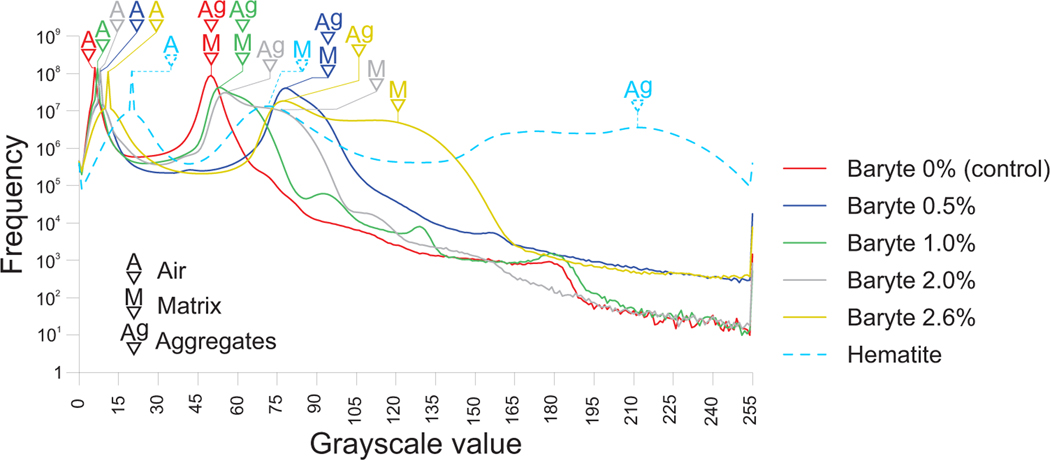
This qualitative observation can be quantitatively appreciated in Fig. 10, where the GSV histograms are reported. Here the X-ray attenuation values for each image are independently rescaled so as to be mapped in a GSV range between 0 (minimum attenuation) and 255 (maximum attenuation), for an 8 bit image depth such as in this case. Such procedure leads to minor differences in the location of the air peaks in Fig. 10. Ideally, these curves should have a number of peaks equal to the number of phases present (including the air surrounding the specimen). Sometimes, the peaks are not very sharp and look more like plateaus, hence, they are here termed pseudo-peaks. This happens when the composition of a phase is not homogeneous but varies, leading the GSV to vary in a well-defined range, but not overlapping with those related to the other phases. The curve related to the control mixture (red curve in Fig. 10) presents two separate peaks, the first one, ranging between 0 and 30 GSV, is related to the voids and the air that can thus be easily separated. The second, which ranges mainly between 30 and 75 GSV, collects the aggregates and the matrix without a clear separation between the two. Hence, even a manual segmentation is hardly feasible under such conditions. Conversely, for the modified mixture with a baryte content of 2.6 % (yellow curve in Fig. 10), the histogram is more spread along the GSV axis and can be easily separated into three distinct regions. The first one is related to air/voids (GSV between 0 and 50), the second to the aggregates (GSV between 50 and 95) and the third one to the bulk matrix (pseudo-peak for GSV mainly between 95 and 165). The latter is shifted towards higher GSV values due to the higher X-ray attenuation of baryte. The histograms with an intermediate baryte content present a transitional behavior. The mixtures with 0.5 % and 1.0 % of baryte (blue and green curves in Fig. 10) do not exhibit a clear separation between aggregates and bulk matrix, although a limited effect of the baryte is visible. On the other hand, a clear, although limited in extension, third pseudo-peak can be distinguished for the mixture with 2.0 % of baryte (gray curve in Fig. 10).
Fig. 10:
Graylevel histograms with indication of the (pseudo-) peaks related to the various phases.
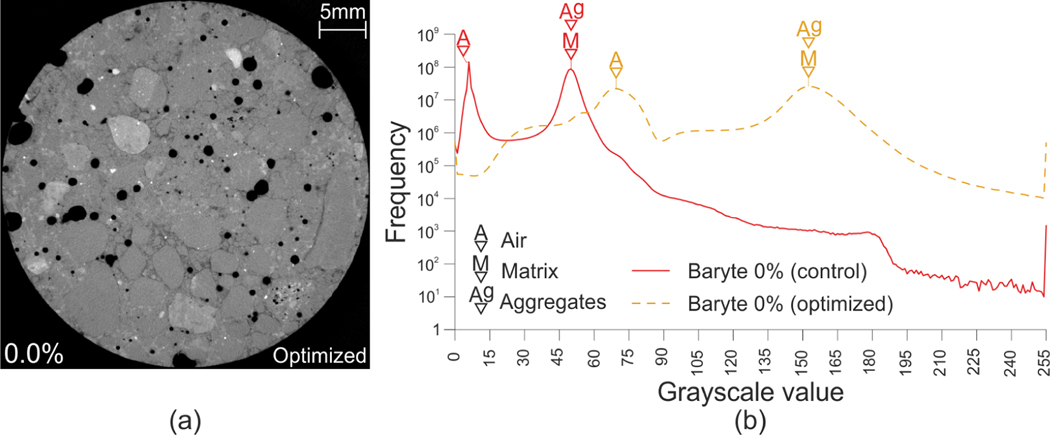
As already outlined in sect. 3, the adoption of a fixed set of parameters facilitates the comparison among the results but can lead to an underestimation of the contrast between the phases. To investigate whether it is possible to improve the image quality of the control concrete mix by tuning the CT scan setting, a further scan of the plain concrete mix is performed and the results are shown in Fig. 11. Here, a X-ray source voltage and current of respectively 130 kV and 270 μA and 1000 images are used. These parameters are obtained by optimizing the image quality so as to obtain the maximum contrast possible between aggregates and cement paste. Fig. 11a shows that the attenuation image obtained has a better contrast compared to Fig. 9a and now the biggest aggregates can be identified although not very clearly. Fig. 11b compares the GSV histograms of the optimized and control images. Although the optimized image shows a more detailed variation of the curve, it has, as for the control image, only two peaks with the first related to the air void and the second for both aggregates and cement paste. Hence, even after an optimization of the CT scan parameters it is not possible to successfully segment the image based only on the GSV.
Fig. 11:
Results obtained for the control mix optimizing the CT scan parameters for the analyzed sample (X-ray source voltage and current of 130 kV and 270 μA and 1000 images are used). (a) CT attenuation images and (b) GSV histogram compared to the one obtained with the settings in Tab. 5.
In the hematite concrete, the aggregates appear much brighter compared to the bulk matrix (Fig. 9f and dashed light blue curve in Fig. 10), as opposed to the baryte-modified concrete where they are darker. This is an expected effect since, in this case, the contrast enhancer is not added to the bulk matrix but, rather, is constituted by the aggregates themselves. As for the baryte-modified mixtures, the distinction between aggregates and bulk paste is easy, however, the introduction of the hematite leads to some inconveniences. Firstly, it requires the substitution of a large portion of the aggregates to be effective (namely, the entire fraction of aggregates with diameter above the explicit description threshold ), hence leading to different mechanical properties of the concrete. Secondly, the high X-ray attenuation of hematite can lead to artifacts in the CT scans.
4. Image post-processing and segmentation
To segment the 3D volumetric images into the desired number of phases the flowchart illustrated in Fig. 12 is followed. The segmentation procedure, based on the thresholding method and performed using the software Avizo [46]3, is kept as simple as possible and it is composed of well known algorithms that require only limited operator interventions (for more information about the algorithms see [18]). This choice is made in order to better emphasize the contrast-enhancing effect of the baryte. Moreover, the adopted method is not tailored to a specific geometry or material, it is very general and versatile. Of course, more advanced segmentation methods are available and would be more successful in isolating objects than the thresholding method used here, especially if a fine tuning of the CT scan parameters is performed as for Fig. 11a. However, the main factor enabling a satisfactory segmentation is the contrast between the phases, which is method-wise differently measured. The thresholding method is chosen to demonstrate that, through the addition of a contrast enhancer, it is possible to obtain good results even with the simplest segmentation algorithm.
Before segmenting the various material phases, a non-local means filter is applied to reduce the image noise (Fig. 12). Then, a standard thresholding method labels voids and aggregates. The thresholds are obtained starting form the saddle points between the peaks in the GSV histogram and then they are slightly adjusted comparing the preview of the segmented image with the original image. To isolate the single particles of both phases and remove irrelevant small features, an erosion algorithm is used. Once an identification number is assigned to each particle, they are filtered by volumetric size, and those smaller than the explicit description threshold are discarded (i.e., they are homogenized into the binding matrix phase). A threshold value is chosen here. For the aggregate phase only, a further flood-fill step is needed in order to remove non realistic holes inside a single particle due to the occurrence of clusters of low absorbing material. Following the erosion process, the particles appear at this point smaller and with nonsmooth edges. To compensate for these two distortions a dilation algorithm and a bilateral smoothing filter are finally applied. The single particles are then recombined in a volume equal to the original one. The segmentation of the cementitious matrix can be thus obtained by subtraction as the volume not occupied by voids or aggregates.
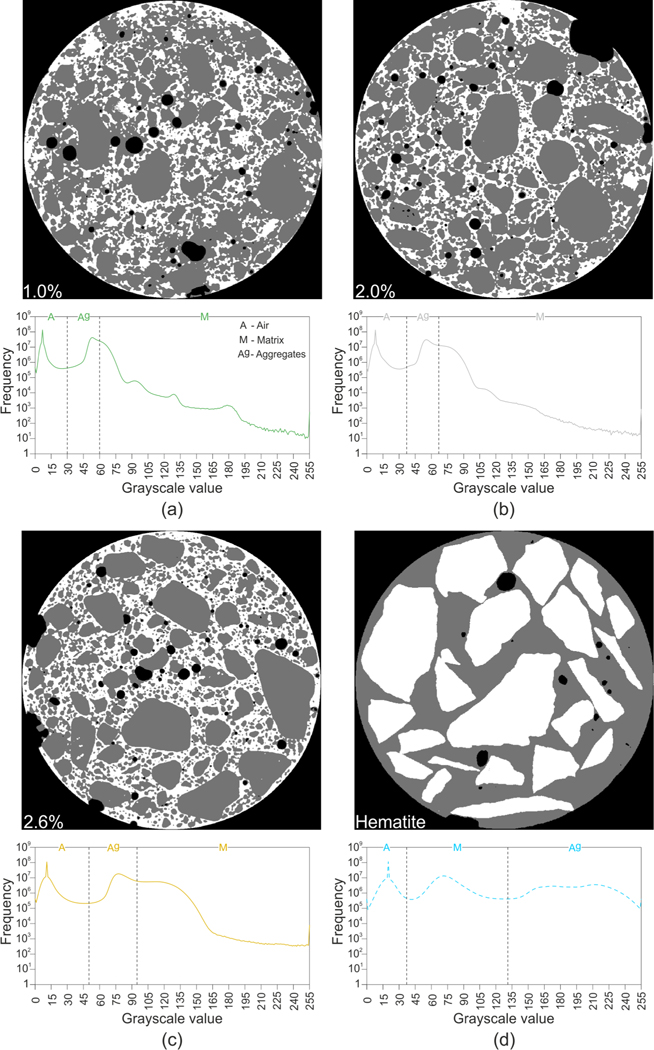
Fig. 13 shows the same image sections illustrated in Fig. 9 for the specimens with a baryte contents of 1.0–2.0–2.6 % after the thresholding process along with the GSV histograms with marked limit values used. In the specimen with 1.0 % of baryte, only the larger aggregates are correctly segmented, while there are large regions where the segmentation procedure failed in assigning the correct label (Fig. 13a). Adding 2.0 % of baryte, improves the results but, still, many errors are present (Fig. 13b), while with 2.6 % of baryte in the mixture excellent results in the segmentation are achieved (Fig. 13c). For the specimens with a baryte content lower than 1.0 %, the adopted segmentation procedure is unable to deliver meaningful results and, hence, they are not shown here. The achieved improvement of the contrast between aggregates and cement matrix is likely to facilitate the segmentation also with more sophisticated segmentation methods.
Fig. 13:
Results of the segmentation procedure: modified concrete with a baryte content of 1.0 % (a), 2.0 % (b), 2.6 % (c) and hematite concrete (d).
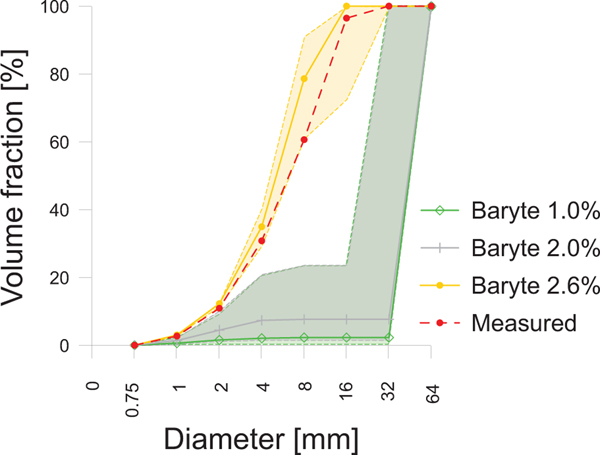
To quantitatively appreciate the improvements in the segmentation process, in Fig. 14 we compare with solid line curves the volumetric particle size distributions obtained experimentally (sect. 2.1) and reconstructed from the 3D images. For the latter, the same process and thresholds illustrated in Fig. 12 are used to identify the connected aggregates components, i.e. the single particles. However, in this case a lower threshold is used so as to include as many particles as possible. The equivalent diameter of each single particle is then obtained as the diameter of the sphere with same volume. To allow a proper comparison, the experimental curve is rescaled accounting only for the aggregates with size larger than 0.75 mm. Also, to study the influence of the thresholding process, the reconstructed particle size distributions are calculated also applying a perturbation in the upper threshold for the aggregates of ±3 GSV. The shaded area in Fig. 14 represents the area included in these two perturbed curves. The reconstructed particle size distribution curves for the mixtures with 1.0 % and 2.0 % of baryte are very different than the experimental one (Fig. 14) and they contain mostly large aggregates. Such a mismatch is due to the still low contrast between aggregates and cementitious matrix that leads to label part of the matrix as aggregates and vice-versa (Figs. 13a,b). This fact ultimately leads to an extensively connected net of aggregates that cannot be separated with an erosion-dilation process and, hence, to the identification of few large particles. The inaccuracy of the reconstructed particle size distribution remains significant even when the thresholds for the segmentation are changed, meaning that the highlighted drawbacks are independent on their choice. On the contrary, the volumetric particle size distribution for the mixture with 2.6 % of baryte better approximates the experimental one and it shows different particle sizes. In this case, when the thresholds for the segmentation are perturbed, the effect on the particle size distribution is limited and all the curves are similar to the experimental one.
Fig. 14:
Comparison between the volumetric particle size distribution curves experimentally measured (sect. 2.1) and reconstructed from the segmented 3D CT images.
Concerning the hematite concrete (Fig. 13d), the adopted segmentation procedure leads to good results, however, in some cases the presence of fictitious voids close to the interface between the aggregates and the bulk paste are present because of the BH shadowing effect. In such cases, better results can be obtained by correcting the shadowing effect locally and manually where needed [15].
5. Discussion
The obtained results show that the adoption of hematite minerals as aggregates, although effective in enhancing the contrast between the phases, presents some drawbacks. Firstly, it is very intrusive, since it requires the complete substitution of the coarser (i.e., with a size ) aggregates to be effective. Also, the hematite reacts with the cement hydration products and has very different mechanical properties compared to commonly employed aggregates, leading to a different material compared to standard concrete [32–35]. This material is termed heavy concrete and is used mostly in radiation shielding. Moreover, due to the very high X-ray attenuation of hematite, the presence of CT imaging artifacts, such as streaking and shadowing, is more prominent and leads to a decrease of the image quality.
In contrast, the more effective and less invasive way to enhance the X-ray contrast between the aggregates and the bulk paste in ordinary concrete is to substitute a limited part of the finer aggregate fraction with baryte powder. The diameter range of the fraction of aggregates to be substituted needs to be lower than the size threshold chosen in the numerical model and the amount of baryte utilized should be calibrated so as to determine the minimum amount that allows an easy and reliable segmentation. For the concrete mixture studied here, the optimum lies in the range 2.0 % to 2.6 %, a fairly limited amount so that the influence on the density is negligible. The characterization of the modified concretes and the comparison with a standard mixture highlights how the addition of such a limited amount of baryte does not appreciably influence the mechanical parameters of the concrete nor the hydration process. This aspect is very important when, e.g., mechanical tests are performed inside a CT scanner because it ensures that the processes (i.e., damage, cracking onset and propagation) taking place in the modified concrete are comparable to those of the standard concrete. In particular, the average values of the compressive strength (Fig. 4) and of the dynamic elastic modulus (Fig. 8) for the baryte-modified mixtures are similar to those of the standard concrete, with variations well within the standard deviation of the latter values. Comparing the average Young’s modulus, a similar or lower standard deviation is obtained for the baryte-modified concrete compared to the control mixture and, while no precise quantitative data can be obtained from the results, there is no evidence of a trend of variation by increasing the amount of baryte in the mixture. Furthermore, the values of the dynamic modulus (Fig. 8) are comparable to the ones obtained in the static case. In particular, the dynamic values are, as expected, slightly higher than the static ones [43, 47]. Concerning the development of the hydration process, both semi-adiabatic calorimetry (Fig. 6b) and the speed of sound vs. time curves are almost identical for all samples, confirming the chemically inert nature of baryte.
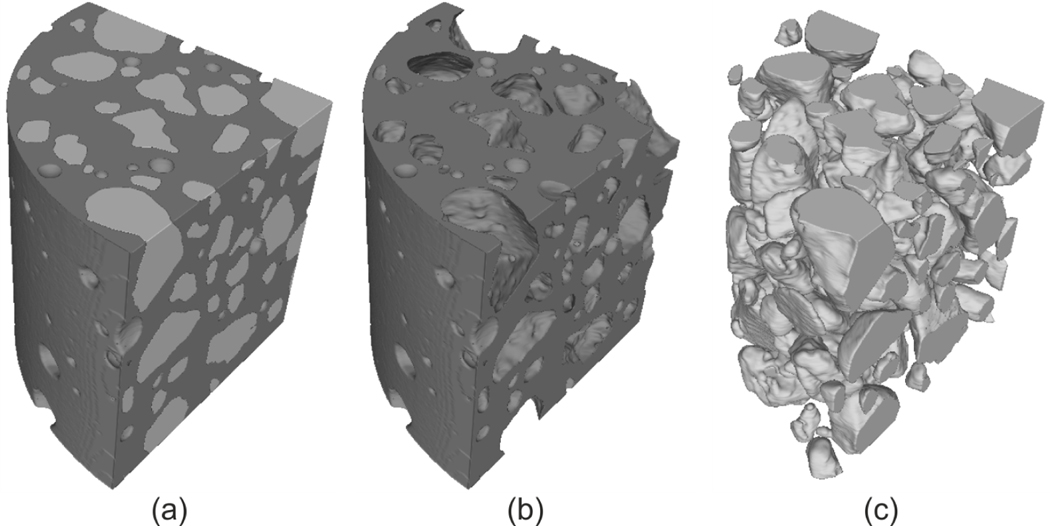
The proposed method can be used as a starting point to obtain finite element geometries of real concrete mesostructures. Starting from the segmented image, it is possible to detect the interfaces between the various phases by using, for example, a marching cubes approach. Then, a surface is obtained by triangulating the detected interfaces and a surface mesh similar to the one illustrated in Figure 15 for a portion of the 2.6 % baryte-modified specimen can be obtained. In this specific case, 3.1 million and 2.3 million nodes are needed respectively to mesh the external surfaces of the cementitious matrix and of the aggregates. After an optimization of the geometry, the volumes enclosed by the surfaces can be then filled with standard tetrahedral finite elements and the mesh can then be imported to numerical codes. Moreover, the proposed technique can be straightforwardly extended to scales other than the mesoscale, e.g. the microscale. Apart form the CT scan resolution, the only limiting criterion is that there should be a clear scale separation between the length scale of the enhancer particles and the smallest feature one wants to explicitly identify, as defined by the threshold dimension . This means that the dimension should be large enough compared to the enhancer particle dimensions so as not to visualize the latter singularly but, rather, to capture their homogenized effect on the matrix. These further steps and the related difficulties are, however, outside of the scope of the present paper.
Fig. 15:
Surfaces including the aggregate particles and the bulk matrix of the specimen with a baryte content of 2.6 %: (a) aggregates and matrix, (b) bulk matrix and (c) aggregate particles.
6. Conclusions
In the present paper, the possibility to substitute minerals in the concrete mixture to improve the X-ray contrast between aggregates and cementitious matrix is studied. Two approaches are investigated: the first is based on the complete substitution of the coarser aggregates (size between 2 mm and 8 mm here) with hematite gravel, while the second involves the substitution of a limited amount of fine aggregates (size ≤ 250 μm) with an equivalent volume of baryte powder. Here, four different baryte contents, namely 0.5–1.0–2.0–2.6 % of the total aggregate volume, are studied. Compression, semi-adiabatic calorimetric and ultrasonic tests of all the baryte-modified mixtures are performed and the results compared to those of a standard concrete. Also, computed tomography images are obtained and segmented using a simple and reliable thresholding procedure. After analyzing the results, the following conclusions can be drawn
the addition of baryte powder and the adoption of hematite gravel in the concrete mixture are both effective in enhancing the contrast between aggregates and cementitious matrix, thus delivering better input data for the subsequent segmentation phase;
substituting the whole volume of the aggregates with hematite gravel is very intrusive and drastically changes the concrete composition. Moreover, hematite produces more artifacts in X-ray tomography and, being composed of iron oxide, is likely to interfere with the hardening process of the concrete;
baryte powder is, conversely, very effective already in a limited amount. For the mixture used here, a volumetric substitution of 2.6 % of the total aggregate content is sufficient to largely facilitate the image segmentation;
baryte does not appreciably influence the mechanical parameters of the concrete nor the development of the hydration process.
Acknowledgements
This research was founded by the German DFG project Graduiertenkolleg 2075 (GRK-2075).
Appendix A. Calculation of the heat production during hydration
This can be done using a maturity function that accounts for the influence of the temperature on the hydration of the concrete. Here, the approach proposed in [39, 48] is adopted, which reads
| (A.1) |
where is the Arrhenius function for a reference datum temperature of 293 °K (20 °C), is the apparent activation energy related to the hydration reactions that here is assumed equal to 33.25 kJ/mol and is the universal gas constant.
In adiabatic conditions, the total heat of hydration at the time , i.e. the total heat released by the hydration reactions, can be calculated as [39]
| (A.2) |
where is the density of the concrete, is the tested volume, is the initial temperature of the specimen, and is the heat capacity of the concrete obtained accounting for the degree of hydration of the concrete as [49]
| (A.3) |
where , and are reported in Tab. 1 and is measured according to [50]. Further, a(t) is the degree of hydration whose calibration is presented later on in this section, , , and are respectively the specific heat capacities of cement, water, aggregates and bound water, as suggested in [49].
Assuming the absence of any other heat source except the hydration reactions, the total heat of hydration at the time in semi-adiabatic test is assumed to be composed of three terms [39]: (i) the heat released from the cell to the environment , (ii) the heat causing a temperature increase of the specimen and, (iii) the heat stored in the testing device . The latter contribution is here neglected because of the very low heat capacity of the XPS foam (about 1.5 J/(g K)). The total heat of hydration is then obtained as [38, 39]
| (A.4) |
Combining Eqs. A.2 and A.4, the rise in temperature in a semi-adiabatic test equivalent to the adiabatic case is
| (A.5) |
where and are respectively the temperature differences related to and .
Combining Eqs. A.2–A.5, the heat related to the temperature increase of the specimen can be calculated as [38, 39]
| (A.6) |
The heat loss to the environment can be calculated as
| (A.7) |
where is the global heat transfer coefficient of the cell obtained performing a cooling test of each fully hydrated specimen (i.e., ) [39]. Such a test consists of warming up the the cell and the specimen to the maximum temperature recorded during the hydration test . Then, the system is allowed to cool down while recording the inner and air temperature, and . Because the specimen is fully hydrated, the component in Eq. A.4 vanishes and, hence, the recorded decrease of the temperature of the specimen is only due to the heat losses as
| (A.8) |
The coeffcient is obtained by fitting Eq. A.8 to the measured data.
Once is known, the hydration degree can be defined as [48]
| (A.9) |
where is the theoretical maximum rise in temperature virtually reached during hydration [48]. This parameter is calibrated by fitting the obtained from Eq. A.5 to the model [48]
| (A.10) |
where , ; and are parameters to be fitted. Such a procedure is applied only to the initial hours of hydration, so as that can be assumed approximately constant and equal to zero.
Once the is obtained, the heat release rate in adiabatic conditions per unit mass of cement in the mixture is given by
| (A.11) |
Footnotes
Certain commercial products are identified in this paper to specify the materials used and the procedures employed. In no case does such identification imply endorsement or recommendation by NIST or the Technische Universität Braunschweig, nor does it indicate that the products are necessarily the best available for the purpose
Certain commercial products are identied in this paper to specify the materials used and the procedures employed. In no case does such identication imply endorsement or recommendation by NIST or the Technische Universität Braunschweig, nor does it indicate that the products are necessarily the best available for the purpose.
Certain commercial products are identified in this paper to specify the materials used and the procedures employed. In no case does such identification imply endorsement or recommendation by NIST or the Technische Universität Braunschweig, nor does it indicate that the products are necessarily the best available for the purpose
References
- [1].Carrara P, Wu T, Kruse R, Lorenzis LD, Towards multiscale modeling of the interaction between transport and fracture in concrete, RILEM Letters 1 (2016) 94–101. [Google Scholar]
- [2].Roelfstra PE, Sadouki H, Wittmann FH, Le beton numerique, Materials and Structures 18 (5) (1985) 327–335. [Google Scholar]
- [3].Wittmann FH, Sadouki H, Simulation and Analysis of Composite Structures, Materials Science and Engineering, 68 (1985) 239–248. [Google Scholar]
- [4].Wu T, Wriggers P, Multiscale diffusionthermalmechanical cohesive zone model for concrete, Computational Mechanics 55 (5) (2015) 999–1016. [Google Scholar]
- [5].Qian Z, Multiscale Modeling of Fracture Processes in Cementitious Materials, Ph.D. thesis, TU Delft (2012). [Google Scholar]
- [6].Titscher T, Unger JF, Application of molecular dynamics simulations for the generation of dense concrete mesoscale geometries, Computers and Structures 158 (2015) 274–284. [Google Scholar]
- [7].Unger JF, Eckardt S, Multiscale Modeling of Concrete: from Mesoscale to macroscale, Archives of computational methods in engineering: state of the art reviews 18 (3) (2011) 341–393. [Google Scholar]
- [8].Nguyen TT, Yvonnet J, Bornert M, Chateau C, Sab K, Romani R, Le Roy R, On the choice of parameters in the phase field method for simulating crack initiation with experimental validation, International Journal of Fracture 197 (2) (2016) 213–226. [Google Scholar]
- [9].Nguyen TT, Yvonnet J, Zhu QZ, Bornert M, Chateau C, A phase-field method for computational modeling of interfacial damage interacting with crack propagation in realistic microstructures obtained by microtomography, Computer Methods in Applied Mechanics and Engineering 312 (2016) 567–595. [Google Scholar]
- [10].Nguyen TT, Yvonnet J, Bornert M, Chateau C, Initiation and propagation of complex 3D networks of cracks in heterogeneous quasi-brittle materials: Direct comparison between in situ testing-microCT experiments and phase field simulations, Journal of the Mechanics and Physics of Solids 95 (2016) 320–350. [Google Scholar]
- [11].Huang Y, Yang Z, Ren W, Liu G, Zhang C, 3D meso-scale fracture modelling and validation of concrete based on in-situ X-ray Computed Tomography images using damage plasticity model, International Journal of Solids and Structures 67–68 (2015) 340–352. [Google Scholar]
- [12].Yang Z, Ren W, Sharma R, McDonald S, Mostafavi M, Vertyagina Y, Marrow TJ, In-situ X-ray computed tomography characterisation of 3D fracture evolution and image-based numerical homogenisation of concrete, Cement and Concrete Composites 75 (2017) 74–83. [Google Scholar]
- [13].Feldkamp LA, Davis LC, Kress JW, Practical cone-beam algorithm, J. Opt. Soc. Amer. A1 (6) (1984) 612–619. [Google Scholar]
- [14].Andersen A, Kak A, Simultaneous algebraic reconstruction technique (SART): A superior implementation of the ART algorithm, Ultrasonic Imaging 6 (1984) 81–94. [DOI] [PubMed] [Google Scholar]
- [15].Barrett JF, Keat N, Artifacts in CT: Recognition and Avoidance, RadioGraphics 24 (6) (2004) 1679–1691. [DOI] [PubMed] [Google Scholar]
- [16].Ketcham RA, Hanna RD, Beam hardening correction for X-ray computed tomography of heterogeneous natural materials, Computers & Geosciences 67 (2014) 49–61. [Google Scholar]
- [17].Herman GT, Correction for beam hardening in computed tomography., Physics in Medicine and Biology 24 (1) (1979) 81–106. [DOI] [PubMed] [Google Scholar]
- [18].Russ J, Neal B, The Image Processing Handbook, Seventh Edition, Vol. 29, CRC Press, 2015. [Google Scholar]
- [19].Fukuda D, Nara Y, Kobayashi Y, Maruyama M, Koketsu M, Hayashi D, Ogawa H, Kaneko K, Investigation of self-sealing in high-strength and ultra-low-permeability concrete in water using micro-focus X-ray CT, Cement and Concrete Research 42 (11) (2012) 1494–1500. [Google Scholar]
- [20].Poinard C, Piotrowska E, Malecot Y, Daudeville L, Landis EN, Compression triaxial behavior of concrete: The role of the mesostructure by analysis of X-ray tomographic images, European Journal of Environmental and Civil Engineering 16 (SUPPL. 1) (2012) 37–41. [Google Scholar]
- [21].Brown MS, McNitt-Gray MF, Mankovich NJ, Goldin JG, Hiller J, Wilson LS, Aberle DR, Method for segmenting chest CT image data using an anatomical model: preliminary results., IEEE transactions on medical imaging 16 (6) (1997) 828–839. [DOI] [PubMed] [Google Scholar]
- [22].Hu S, Hoffman EA, Reinhardt JM, Automatic lung segmentation for accurate quantitation of volumetric X-ray CT images, IEEE Transactions on Medical Imaging 20 (6) (2001) 490–498. [DOI] [PubMed] [Google Scholar]
- [23].Roux S, Hild F, Viot P, Bernard D, Three-dimensional image correlation from X-ray computed tomography of solid foam, Composites Part A: Applied Science and Manufacturing 39 (8) (2008) 1253–1265. arXiv:0712.2642. [Google Scholar]
- [24].Zelelew HM, Papagiannakis AT, A volumetrics thresholding algorithm for processing asphalt concrete X-ray CT images, International Journal of Pavement Engineering 12 (6) (2011) 543–551. [Google Scholar]
- [25].Razmjoo A, Application of image processing and finite element analysis in modeling chloride diffusion in concrete, PhD thesis in Civil Engineering, Clemson University. [Google Scholar]
- [26].Beucher S, Meyer F, The morphological approach to segmentation: The watershed transformation, CRC Press, 1993. [Google Scholar]
- [27].Hain M, Wriggers P, Numerical homogenization of hardened cement paste, Computational Mechanics 42 (2) (2008) 197–212. [Google Scholar]
- [28].Bouvard D, Chaix JM, Dendievel R, Fazekas A, Letang JM, Peix G, Quenard D, Characterization and simulation of microstructure and properties of EPS lightweight concrete, Cement and Concrete Research 37 (12) (2007) 1666–1673. [Google Scholar]
- [29].Wong RCK, Chau KT, Estimation of air void and aggregate spatial distributions in concrete under uniaxial compression using computer tomography scanning, Cement and Concrete Research 35 (8) (2005) 1566–1576. [Google Scholar]
- [30].Standards EN, EN 933–1:2012 - Tests for Geometrical Properties of Aggregates. Part 1: Determination of particle size distribution Sieving method (2012). [Google Scholar]
- [31].US National Institute of Standard and Technologies, XCOM: Photon Cross Sections Database, https://physics.nist.gov/PhysRefData/Xcom/html/xcom1.html Accessed: 2017-07-09.
- [32].Gencel O, Effect of elevated temperatures on mechanical properties of high-strength concrete containing varying proportions of hematite, Fire and Materials 36 (3) (2012) 217–230. [Google Scholar]
- [33].Fernández Olmo I, Chacon E, Irabien A, Influence of lead, zinc, iron (III) and chromium (III) oxides on the setting time and strength development of Portland cement, Cement and Concrete Research 31 (8) (2001) 1213–1219. [Google Scholar]
- [34].Lee HS, Lee JY, Yu MY, Influence of iron oxide pigments on the properties of concrete interlocking blocks, Cement and Concrete Research 33 (11) (2003) 1889–1896. [Google Scholar]
- [35].Kishar EA, Alasqalani MY, Sarraj YR, Ahmed DA, The Effect of Using Commercial Red and Black Iron Oxides as a Concrete Admixtures on its Physiochemical and Mechanical Properties, International Journal of Science and Research 4 (12) (2015) 1389–1393. [Google Scholar]
- [36].GOM Precise Industrial 3D Metrology, GOM Correlate, https://www.gom.com Accessed: 2017-07-09. [Google Scholar]
- [37].Hermerschmidt W, Nothnagel R, Budelmann H, Development of Semi- Adiabatic Calorimeter to Determine Heat of Hydration of Concrete, Internal report - Available online. [Google Scholar]
- [38].Standards EN, Methods of testing cement. Part 9: Heat of hydration - Semi-adiabatic method, European Standard. [Google Scholar]
- [39].RILEM Technical Committee 119-TCE, Adiabatic and semi-adiabatic calorimetry to determine the temperature increase in concrete due to hydration heat of cement, Materials and Structures 30 (October 1997) (1998) 451–464. [Google Scholar]
- [40].Trtnik G, Gams M, Recent advances of ultrasonic testing of cement based materials at early ages, Ultrasonics 54 (1) (2014) 66–75. [DOI] [PubMed] [Google Scholar]
- [41].Gibson A, Ciancio D, Embedded Early-Age Ultrasonic Testing for Concrete and Shotcrete, in: SMAR 2011 Proceedings, Dubai, 2011, pp. 2–9. [Google Scholar]
- [42].Mikulić D, Sekulić D, Štirmer N, Bjegovic D, Application of Ultrasonic Methods for Early Age Concrete Characterization, The 8th International Conference of the Slovenian Society for Non-destructive Testing “Application of Contemporary Non-destructive testing in Engineering” (2005) 99–108. [Google Scholar]
- [43].Panzera TH, Christoforo AL, de Paiva Cota F, Ribeiro Borges PH, Bowen CR, Ultrasonic Pulse Velocity Evaluation of Cementitious Materials, in: Advances in Composite Materials - Analysis of Natural and Man-Made Materials, Vol. 17, InTech, 2011, pp. 411–436. [Google Scholar]
- [44].XRE NV, Octopus Imaging Software, https://octopusimaging.eu Accessed: 2017-07-09. [Google Scholar]
- [45].Carrara P, De Lorenzis L, Consistent identification of the interfacial transition zone in simulated cement microstructures, Cement and Concrete Composites 80 (2017) 224–234. [Google Scholar]
- [46].FEI/Thermo Fisher Scientific, Avizo software, https://www.fei.com/software/amira-avizo Accessed: 2017-07-09. [Google Scholar]
- [47].Trtnik G, Turk G, Kavcic F, Bosiljkov VB, Possibilities of using the ultrasonic wave transmission method to estimate initial setting time of cement paste, Cement and Concrete Research 38 (11) (2008) 1336–1342. [Google Scholar]
- [48].Jonasson J, Modelling of temperature, moisture and stresses in young concrete (1994). [Google Scholar]
- [49].Waller V, De Larrard F, Roussel P, Modelling the temperature rise in massive HPC Structures., in: 4th International Symposium on Utilization of High-Strength/High-Performance Concrete RILEM, Paris, 1996. [Google Scholar]
- [50].EN Standards, EN 12350–6 Methods of testing cement. Part 6: Density, European Standard (2009) 14. [Google Scholar]


