

Abstract
PURPOSE
Current clinical risk stratification methods for localized prostate cancer are suboptimal, leading to over- and undertreatment. Recently, machine learning approaches using digital histopathology have shown superior prognostic ability in phase III trials. This study aims to develop a clinically usable risk grouping system using multimodal artificial intelligence (MMAI) models that outperform current National Comprehensive Cancer Network (NCCN) risk groups.
MATERIALS AND METHODS
The cohort comprised 9,787 patients with localized prostate cancer from eight NRG Oncology randomized phase III trials, treated with radiation therapy, androgen deprivation therapy, and/or chemotherapy. Locked MMAI models, which used digital histopathology images and clinical data, were applied to each patient. Expert consensus on cut points defined low-, intermediate-, and high-risk groups on the basis of 10-year distant metastasis rates of 3% and 10%, respectively. The MMAI's reclassification and prognostic performance were compared with the three-tier NCCN risk groups.
RESULTS
The median follow-up for censored patients was 7.9 years. According to NCCN risk categories, 30.4% of patients were low-risk, 25.5% intermediate-risk, and 44.1% high-risk. The MMAI risk classification identified 43.5% of patients as low-risk, 34.6% as intermediate-risk, and 21.8% as high-risk. MMAI reclassified 1,039 (42.0%) patients initially categorized by NCCN. Despite the MMAI low-risk group being larger than the NCCN low-risk group, the 10-year metastasis risks were comparable: 1.7% (95% CI, 0.2 to 3.2) for NCCN and 3.2% (95% CI, 1.7 to 4.7) for MMAI. The overall 10-year metastasis risk for NCCN high-risk patients was 16.6%, with MMAI further stratifying this group into low-, intermediate-, and high-risk, showing metastasis rates of 3.4%, 8.2%, and 26.3%, respectively.
CONCLUSION
The MMAI risk grouping system expands the population of men identified as having low metastatic risk and accurately pinpoints a high-risk subset with elevated metastasis rates. This approach aims to prevent both overtreatment and undertreatment in localized prostate cancer, facilitating shared decision making.
How does a digital histopathology-based AI prognostic tool compare with the NCCN risk groupings for localized prostate cancer? @prostatemd et al evaluated the biomarker performance.
INTRODUCTION
Various risk stratification systems, based on multiple oncologic end points, have evolved over the past two decades to prognosticate outcomes for men with localized prostate cancer.1 Others have refined and expanded the D'Amico system using additional parameters to stratify men into more risk groups. In addition to risk grouping, there are various models and commercially available molecular prognostic tests that can improve risk stratification, allowing for personalized risk estimates at the individual level.2-5 Although both grouped and individual risk estimates can help a patient understand the gravitas of their diagnosis, defining treatment thresholds on the basis of risk allows expert guideline consensus to recommend best practices for treatment decisions, conduct clinical trials, and communicate risk and treatment recommendations more simply to patients.
CONTEXT
Key Objective
This study aimed to develop a clinically usable risk grouping system for localized prostate cancer using multimodal artificial intelligence (MMAI) models that outperform current National Comprehensive Cancer Network (NCCN) risk groups by integrating digital histopathology images and clinical data.
Knowledge Generated
The MMAI risk classification system reclassified 42% of patients compared with NCCN risk groups, accurately identifying more patients as low-risk and fewer as high-risk. Despite the MMAI low-risk group being larger, the 10-year metastasis risks were comparable with NCCN risk groups, with MMAI also more effectively stratifying high-risk patients into subgroups with distinct metastasis rates.
Relevance
The MMAI risk grouping system can potentially reduce overtreatment and undertreatment in localized prostate cancer by providing a more precise prognostic tool, facilitating shared decision making in clinical practice based on personalized metastasis risk assessment.
Recently, a new personalized risk estimator was developed that more accurately predicts metastasis and prostate cancer–specific death than National Comprehensive Cancer Network (NCCN) risk groups.6 It was created by a deep learning multimodal artificial intelligence (MMAI) model from scanned digital histopathology slides and clinical parameters gathered from patients enrolled in five phase III NRG Oncology randomized trials.7 The current work aimed to extend this by defining clinically meaningful thresholds that might inform treatment intensification decisions and compare risk at these thresholds with those of the NCCN risk tiers. The NCCN risk groups were selected as comparators on the basis of both the ubiquitous use of this schema by clinicians in the United States and the availability of the variables used in the current study.
MATERIALS AND METHODS
Study Cohort
Following approval by NRG Oncology, an eight-trial cohort was constructed from large, randomized phase III trials to perform meta-analysis validation of digital histopathology clinical MMAI prognostic algorithms. These included 9,787 eligible patients with localized prostate cancer (NRG/Radiation Therapy Oncology Group [RTOG] 9202, 9408, 9413, 9902, 9910, 0126, 0415, and 0521), treated with first-line radiation therapy (RT), with or without 4-28 months of androgen deprivation therapy (ADT) and with or without chemotherapy.8-15 The study population consisted of patients eligible for the eight selected trials with MMAI algorithm scores and clinical outcomes available. For the five trials used in model development (NRG/RTOG 9202, 9408, 9413, 9910, and 0126), the patients included in this analysis were restricted to the 20% validation cohorts reported previously.7 For the analysis population, the NCCN six-tiered risk groupings were collapsed into the original three NCCN or D'Amico risk categories (very low/low, intermediate, and high/very high) on the basis of the availability of risk factor data and to support comparisons with MMAI risk groups.1 Institutional Review Board approval was obtained from NRG Oncology (IRB00000781), and informed consent was waived because this study was performed with anonymized data.
MMAI Algorithms
The MMAI algorithms were previously developed and locked using an 80% set of the digital histopathology image and baseline clinical data (age, prostate-specific antigen [PSA], Gleason Score, Gleason primary, and secondary patterns, and T-stage) of patients from the first five NRG/RTOG trials (9202, 9408, 9413, 9910, and 0126), one optimized for predicting distant metastasis (DM) and the other for prostate cancer–specific mortality (PCSM).7 Both algorithms have scores ranging from 0 to 1; the higher score indicates a greater risk of experiencing the event. Patients can be categorized into MMAI low-, intermediate- and high-risk groups by pre-established cut points (equal to 0.331 and 0.557 on prostate cancer prognostic algorithm version 1.1) on their DM MMAI scores (corresponding to 3% and 10% estimated 10-year DM rates) that were selected on the basis of expert physician input to define clinically relevant thresholds.
This study aimed to compare the risk stratification by MMAI algorithms with standard prognostic factors such as NCCN risk groups through a patient-level meta-analysis. The primary objective is to compare the reclassification between MMAI and NCCN and the strengths of the association of DM MMAI versus NCCN against the primary end point—DM. Similarly, analyses were performed for PCSM MMAI versus NCCN against the end points of PCSM and death with distant metastasis (DDM). This study followed the TRIPOD reporting guideline.16
End Points
All end points were measured from the date of random assignment to the date of the corresponding event(s), or patients were censored at their last known follow-up time. The primary end point was time to DM. The secondary end point was time to DDM, and exploratory end points included time to PCSM, time to biochemical failure by Phoenix's definition (BF), overall survival, and metastatic-free survival. DDM was defined by the date of random assignment to the date of death with a record of metastasis in the study and was included in model training and selected as a secondary end point for the study to represent a biologically driven mortality end point for the digital pathology biomarker. Additionally, the PCSM end point was evaluated, which was defined differently across trials (Data Supplement, Table S1).
Statistical Analysis
Reclassification analysis between categories was performed using either the Fisher exact test or the chi-square test. Estimated incidence curves were calculated, and subgroup comparisons of such curves were conducted using the cumulative incidence method with Gray's test or Kaplan-Meier with the log-rank test.17 Fine-Gray or Cox proportional hazards regressions were used to study the association between risk factors and the end point of interest.18,19 Discriminatory ability of NCCN versus MMAI was compared using a time-dependent area under the receiver operating characteristic curves (tdAUCs) over time, and for selected time points, comparative tests were performed using the method detailed in Blanche et al.20 To allow head-to-head comparisons, MMAI and NCCN tdAUC analyses were performed on patients with NCCN risk groups available only. All other analyses were complete case analysis.
The univariable DM MMAI score was analyzed for time to DM, whereas the PSCM MMAI score was analyzed for time to both DDM and PCSM. Exploratory analyses included analyzing MMAI algorithms against end points that the algorithms were not optimized to predict, and within clinical and treatment subgroups; due to their exploratory nature, no multiplicity adjustment was performed. Additional sensitivity analyses were conducted when randomization treatment or randomization year was accounted for in multivariable analyses. Death without an event was treated as a competing risk for DM, DDM, PCSM, and BF (eg, for PCSM, death not due to a prostate cancer–specific cause is not considered an event; ie, death due to other causes is treated as a competing event). All statistical tests were two-sided, performed in R, version 4.1.3 (R Foundation), and P values <.05 were deemed statistically significant.
RESULTS
Cohort Characteristics
The study cohort consisted of 2,486 evaluable patients (Fig 1), 17.0% Black, 80% White, and 3.4% other or unknown race (Table 1). Follow-up lengths varied by trials (overall median of 7.9 years, with medians ranging from 6.1 years [RTOG 0415] to 17.1 years [RTOG 9202]). ADT was combined with radiation in 57% of the patients (of these, 24% were randomly assigned to receive additional chemotherapy). On the basis of NCCN risk grouping, 30%, 25%, and 44% of patients were classified as low-, intermediate-, or high-risk, respectively, and the estimated 10-year metastasis rates (95% CI) were 2% (0 to 3), 6% (4 to 8) and 17% (14 to 19), respectively (Fig 2). The baseline characteristics of the study population are summarized in Table 1.
FIG 1.

CONSORT diagram. n, number of patients; RTOG, Radiation Therapy Oncology Group.
TABLE 1.
Cohort Characteristics of the Validation Set
| Population | Total N = 2,486a |
NRG/RTOG-9202 n = 238a |
NRG/RTOG-9408 n = 319a |
NRG/RTOG-9413 n = 169a |
NRG/RTOG-9902 n = 318a |
NRG/RTOG-9910 n = 194a |
NRG/RTOG-0126 n = 207a |
NRG/RTOG-0415 n = 696a |
NRG/RTOG-0521 n = 345a |
|---|---|---|---|---|---|---|---|---|---|
| Randomized treatments, No. (%) | |||||||||
| RT-only | 1,073 (43.2) | 0 (0.0) | 170 (53.3) | 0 (0.0) | 0 (0.0) | 0 (0.0) | 207 (100.0) | 696 (100.0) | 0 (0.0) |
| RT + ST/IT-ADT | 646 (26.0) | 134 (56.3) | 149 (46.7) | 169 (100.0) | 0 (0.0) | 194 (100.0) | 0 (0.0) | 0 (0.0) | 0 (0.0) |
| RT + LT-ADT | 434 (17.5) | 104 (43.7) | 0 (0.0) | 0 (0.0) | 161 (50.6) | 0 (0.0) | 0 (0.0) | 0 (0.0) | 169 (49.0) |
| RT + LT-ADT + Chemo | 333 (13.4) | 0 (0.0) | 0 (0.0) | 0 (0.0) | 157 (49.4) | 0 (0.0) | 0 (0.0) | 0 (0.0) | 176 (51.0) |
| Age at baseline, years | |||||||||
| Median (IQR) | 69 (63-73) | 70 (66-74) | 71 (66-75) | 70 (65-74) | 66 (60-71) | 70 (66-74) | 71 (64-74) | 68 (62-73) | 66 (59-72) |
| Race, No. (%) | |||||||||
| Black | 423 (17.0) | 29 (12.2) | 63 (19.7) | 50 (29.6) | 83 (26.1) | 33 (17.0) | 25 (12.1) | 107 (15.4) | 33 (9.6) |
| White | 1,977 (79.5) | 204 (85.7) | 246 (77.1) | 109 (64.5) | 222 (69.8) | 151 (77.8) | 177 (85.5) | 567 (81.5) | 301 (87.2) |
| Other | 70 (2.8) | 5 (2.1) | 10 (3.1) | 9 (5.3) | 12 (3.8) | 10 (5.2) | 2 (1.0) | 14 (2.0) | 8 (2.3) |
| Unknown | 16 (0.6) | 0 (0.0) | 0 (0.0) | 1 (0.6) | 1 (0.3) | 0 (0.0) | 3 (1.4) | 8 (1.1) | 3 (0.9) |
| PSA at baseline, ng/mL | |||||||||
| Median (IQR) | 8.7 (5.6-18.5) | 21.6 (10.9-41.4) | 8.1 (6.1-12.2) | 23.2 (12.3-34.1) | 23.0 (9.3-40.6) | 11.3 (6.8-15.6) | 7.5 (5.3-10.5) | 5.5 (4.4-7.1) | 16.4 (7.3-37.7) |
| PSA at baseline grouping, ng/mL, No. (%) | |||||||||
| <4 | 215 (8.6) | 5 (2.1) | 29 (9.1) | 1 (0.6) | 11 (3.5) | 9 (4.6) | 22 (10.6) | 120 (17.2) | 18 (5.2) |
| 4-10 | 1,185 (47.7) | 48 (20.2) | 169 (53.0) | 27 (16.0) | 73 (23.0) | 70 (36.1) | 118 (57.0) | 576 (82.8) | 104 (30.1) |
| 10-20 | 508 (20.4) | 59 (24.8) | 121 (37.9) | 44 (26.0) | 52 (16.4) | 93 (47.9) | 67 (32.4) | 0 (0.0) | 72 (20.9) |
| >20 | 578 (23.3) | 126 (52.9) | 0 (0.0) | 97 (57.4) | 182 (57.2) | 22 (11.3) | 0 (0.0) | 0 (0.0) | 151 (43.8) |
| Clinical T-stage, No. (%) | |||||||||
| T1-T2a | 1,530 (61.5) | 0 (0.0) | 265 (83.1) | 39 (23.1) | 121 (38.1) | 159 (82.0) | 176 (85.0) | 654 (94.0) | 116 (33.6) |
| T2b-c | 554 (22.3) | 108 (45.4) | 54 (16.9) | 70 (41.4) | 94 (29.6) | 22 (11.3) | 31 (15.0) | 42 (6.0) | 133 (38.6) |
| T3a | 170 (6.8) | 38 (16.0) | 0 (0.0) | 32 (18.9) | 48 (15.1) | 7 (3.6) | 0 (0.0) | 0 (0.0) | 45 (13.0) |
| T3b-T4 | 231 (9.3) | 92 (38.7) | 0 (0.0) | 28 (16.6) | 54 (17.0) | 6 (3.1) | 0 (0.0) | 0 (0.0) | 51 (14.8) |
| Tx | 1 (0.0) | 0 (0.0) | 0 (0.0) | 0 (0.0) | 1 (0.3) | 0 (0.0) | 0 (0.0) | 0 (0.0) | 0 (0.0) |
| Grade Group, No. (%) | |||||||||
| 1 | 1,101 (44.8) | 85 (39.2) | 180 (57.3) | 44 (26.0) | 0 (0.0) | 56 (28.9) | 41 (19.8) | 695 (100.0) | 0 (0.0) |
| 2 | 423 (17.2) | 44 (20.3) | 68 (21.7) | 48 (28.4) | 51 (16.0) | 65 (33.5) | 113 (54.6) | 0 (0.0) | 34 (9.9) |
| 2/3b | 6 (0.2) | 4 (1.8) | 0 (0.0) | 1 (0.6) | 0 (0.0) | 0 (0.0) | 0 (0.0) | 0 (0.0) | 1 (0.3) |
| 3 | 266 (10.8) | 27 (12.4) | 31 (9.9) | 28 (16.6) | 54 (17.0) | 51 (26.3) | 53 (25.6) | 0 (0.0) | 22 (6.4) |
| 4 | 316 (12.9) | 30 (13.8) | 24 (7.6) | 32 (18.9) | 109 (34.3) | 15 (7.7) | 0 (0.0) | 0 (0.0) | 106 (30.7) |
| 5 | 347 (14.1) | 27 (12.4) | 11 (3.5) | 16 (9.5) | 104 (32.7) | 7 (3.6) | 0 (0.0) | 0 (0.0) | 182 (52.8) |
| Missing | 27 | 21 | 5 | 0 | 0 | 0 | 0 | 1 | 0 |
| NCCN risk group, No. (%) | |||||||||
| Low | 752 (30.4) | 0 (0.0) | 98 (31.2) | 0 (0.0) | 0 (0.0) | 1 (0.5) | 0 (0.0) | 653 (94.2) | 0 (0.0) |
| Intermediate | 630 (25.5) | 38 (16.4) | 181 (57.6) | 25 (14.8) | 0 (0.0) | 138 (71.1) | 207 (100.0) | 40 (5.8) | 1 (0.3) |
| High | 1,090 (44.1) | 194 (83.6) | 35 (11.1) | 144 (85.2) | 318 (100.0) | 55 (28.4) | 0 (0.0) | 0 (0.0) | 344 (99.7) |
| Missing | 14 | 6 | 5 | 0 | 0 | 0 | 0 | 3 | 0 |
Abbreviations: ADT, androgen deprivation therapy; IT, intermediate-term; LT, long-term; N, number of patients; NCCN, National Comprehensive Cancer Network; ng/mL, nanogram per milliliter; PSA, prostate-specific antigen; RT, radiation therapy; RTOG, Radiation Therapy Oncology Group; ST, short-term.
No. (%). Note that some percentages may not add up to 100% due to rounding.
Gleason Score 7 with unknown primary and secondary patterns to classify Grade Group 2 or 3.
FIG 2.
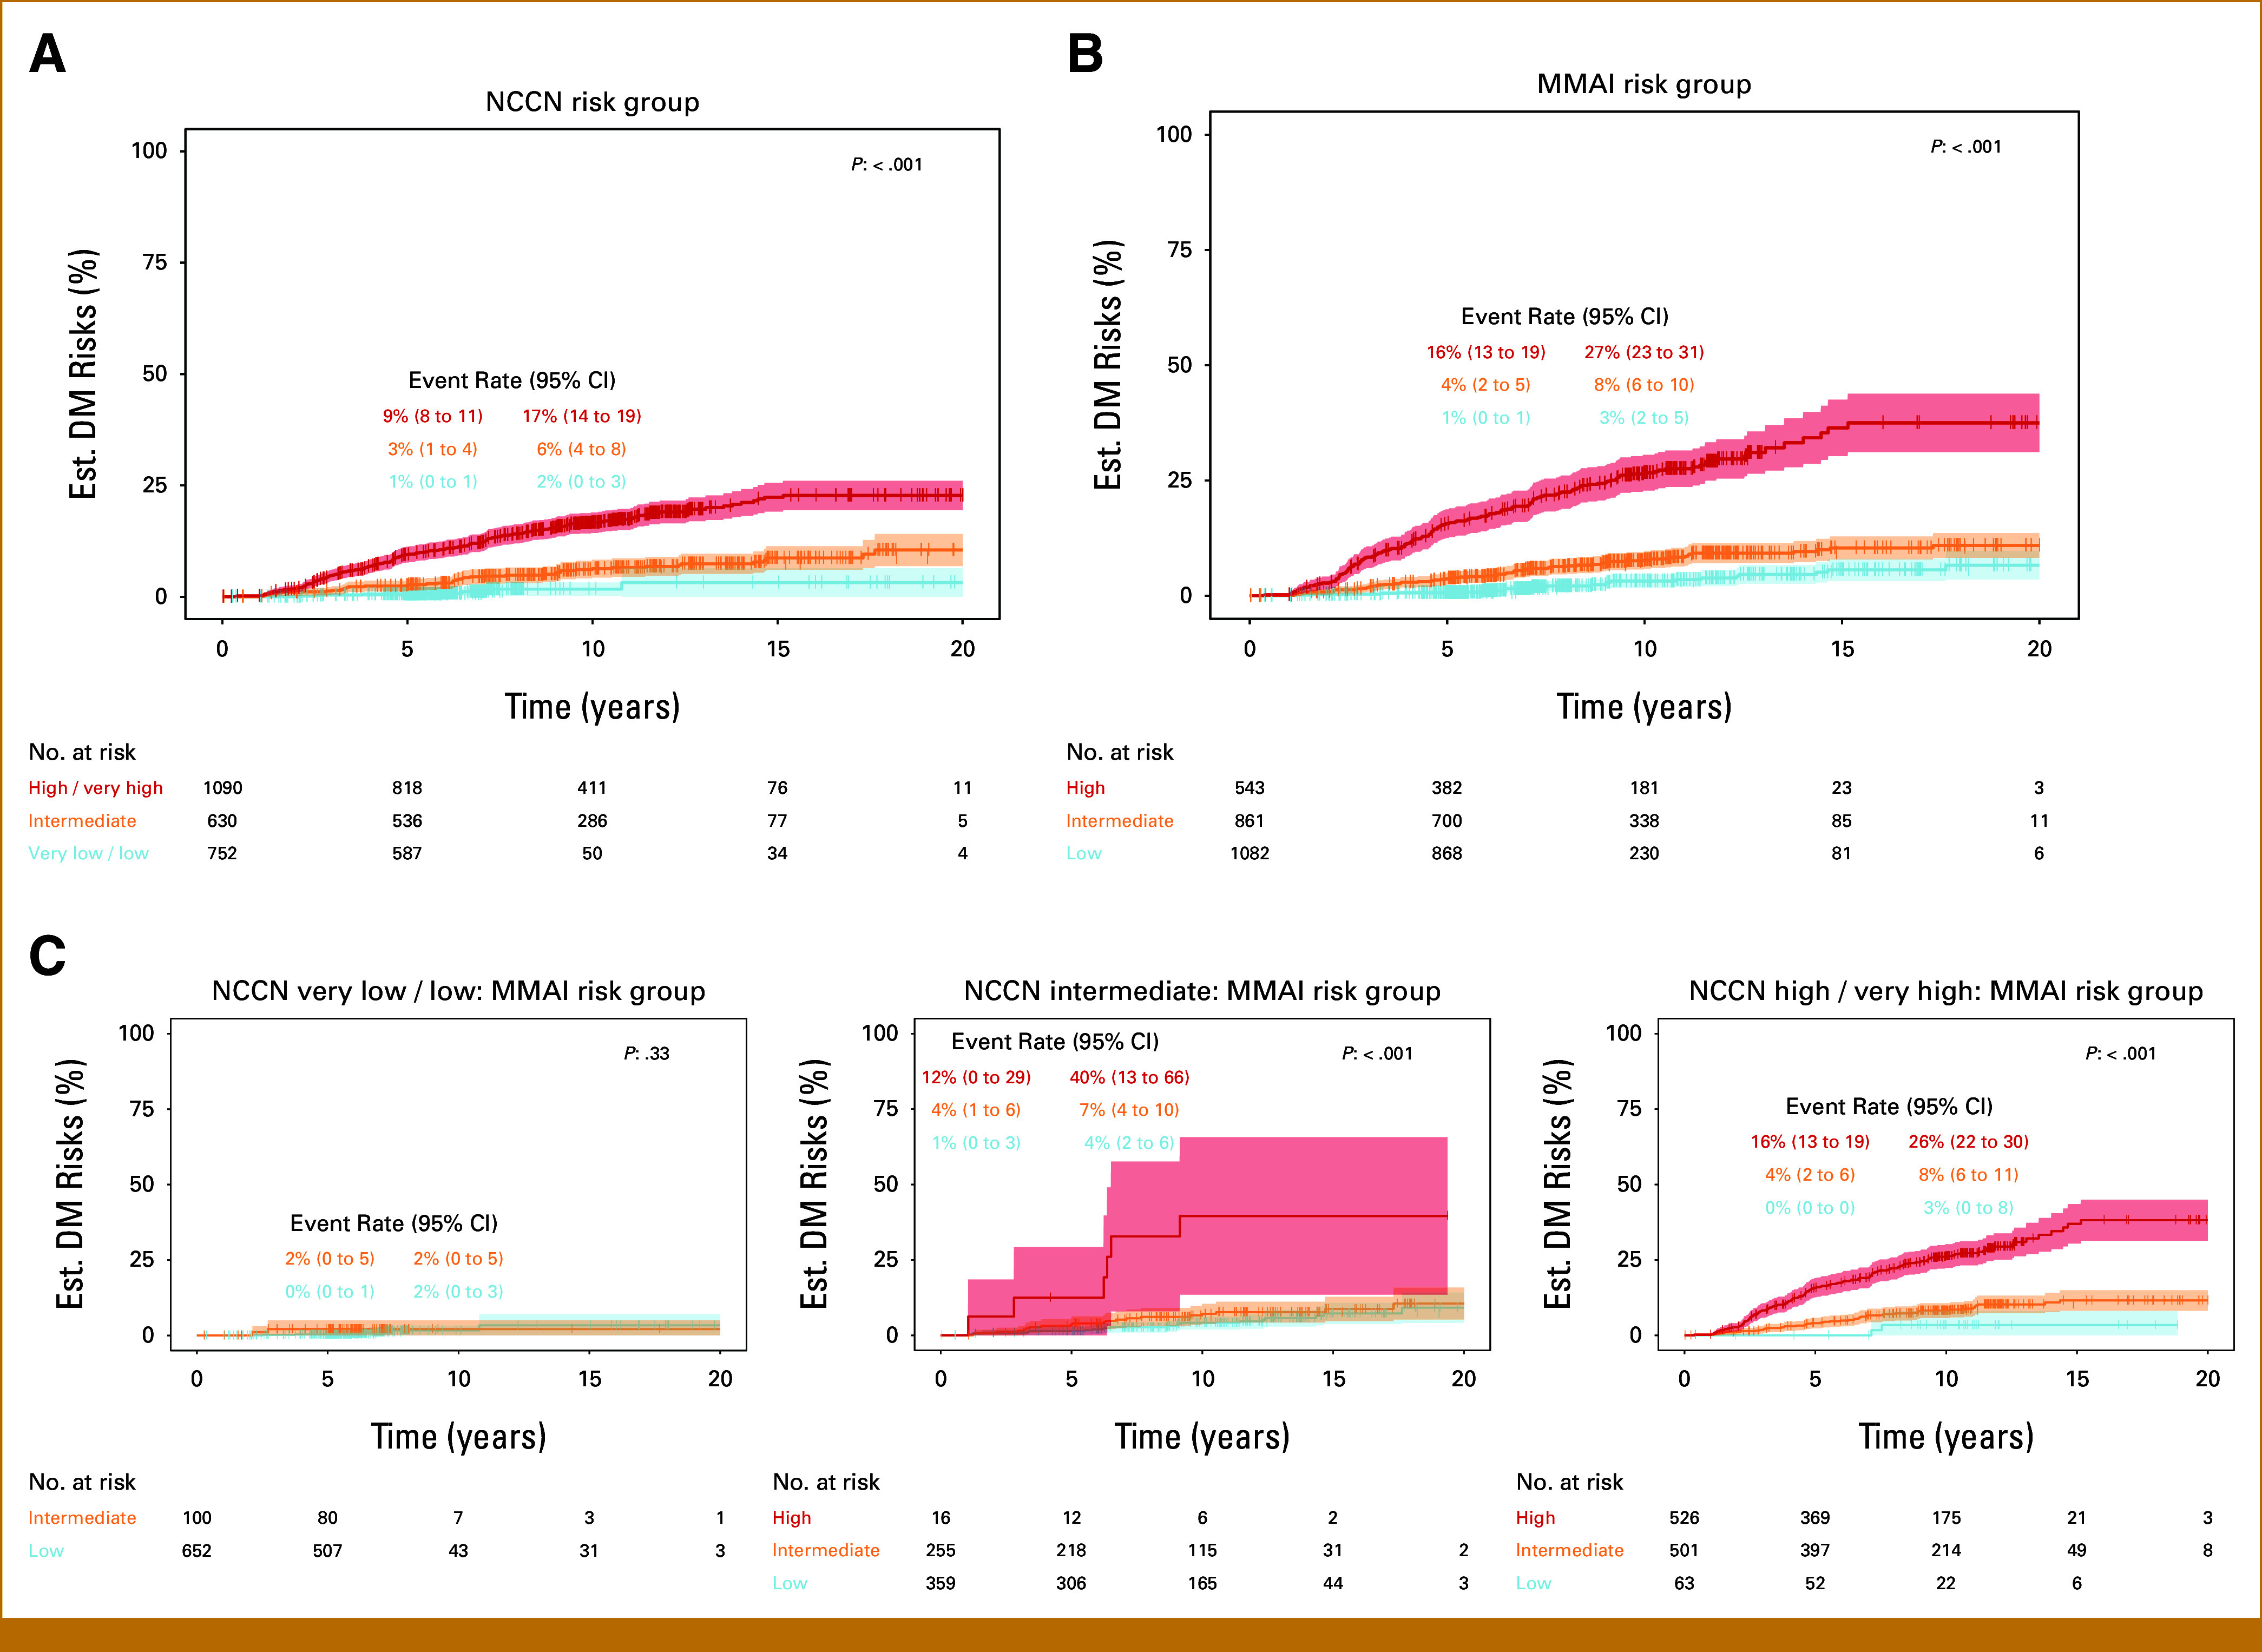
Cumulative incidence estimates of DM by (A) NCCN risk group, (B) MMAI risk group, and (C) NCCN and MMAI subgroups. Fourteen patients with missing NCCN were excluded from their corresponding analyses. DM, distant metastasis; MMAI, multimodal artificial intelligence; NCCN, National Comprehensive Cancer Network.
Risk Stratification by MMAI
Risk stratification by MMAI was first evaluated in the validation set as a continuous variable. The mean (standard deviation [SD]) of DM MMAI and PCSM MMAI scores of the study population were 0.39 (SD, 0.17) and 0.42 (SD, 0.14), respectively.
Categorically, the MMAI risk group classified 1,082 (44%) patients as MMAI low, 861 (35%) as MMAI intermediate, and 543 (22%) as MMAI high risk, with estimated 10-year metastasis rates (95% CI) of 3% (2 to 5), 8% (6 to 10), and 27% (23 to 31), respectively (Fig 2). NCCN and MMAI risk groups each demonstrated prognostic ability for DM. Similar risk-stratification results for DDM and PCSM can be found in the Data Supplement (Figs S1 and S2). Patients identified as MMAI intermediate- and high-risk groups had sHRs of metastasis of 2.69 (95% CI, 1.7 to 4.2, P < .001) and 10.4 (95% CI, 6.9 to 15.7, P < .001) compared with MMAI low-risk, respectively (Table 2). When treatment or year of random assignment was adjusted, MMAI remained statistically significantly associated with outcomes of interest (DM, DDM, PCSM, Data Supplement Tables S2 and S3).
TABLE 2.
Prognostic Performance of MMAI for Distant Metastasis and Prostate Cancer Mortality
| Endpoint | Variable | sHR (95% CI) | P |
|---|---|---|---|
| DM | MMAI scorea | 2.66 (2.31 to 3.07) | <.001 |
| MMAI risk group | |||
| MMAI intermediate v low | 2.69 (1.72 to 4.20) | <.001 | |
| MMAI high v low | 10.38 (6.88 to 15.67) | <.001 | |
| MMAI scorea | 2.68 (2.29 to 3.14) | <.001 | |
| DDM | MMAI risk group | ||
| MMAI intermediate v low | 2.99 (1.74 to 5.16) | <.001 | |
| MMAI high v low | 11.60 (6.96 to 19.33) | <.001 | |
| PCSM | MMAI scorea | 2.16 (1.87 to 2.50) | <.001 |
| MMAI risk group | |||
| MMAI intermediate v low | 1.69 (1.13 to 2.55) | .01 | |
| MMAI high v low | 5.73 (3.93 to 8.37) | <.001 |
NOTE. Continuously, DM MMAI scores were evaluated for the DM end point and PCSM MMAI scores were evaluated for the DDM and PCSM end points. Categorically, only the MMAI Risk Grouping was evaluated for all three end points. Thirty-six patients with missing PCSM were excluded from their corresponding analyses.
Abbreviations: DM, distant metastasis; DDM, death with distant metastasis; MMAI, multimodal artificial intelligence; PCSM, prostate cancer–specific mortality; SD, standard deviation; sHR, subdistribution hazard ratio.
MMAI is per 1 SD increase.
The DM MMAI was shown to be statistically significantly associated with DM events (subdistribution hazard ratio [sHR], 2.66 [95% CI, 2.31 to 3.07], P < .001), and the PCSM MMAI was also statistically significantly associated with DDM events (sHR, 2.68, [95% CI, 2.29 to 3.14], P < .001) and PCSM events (sHR 2.16 [95% CI, 1.87 to 2.50], P < .001; Table 2). The MMAI remained prognostic for DM within clinical and treatment subgroups (Fig 3). Likewise, both MMAI algorithms demonstrated a significant prognostic ability against end points for which the algorithms were not developed to optimize (eg, biochemical failure; Data Supplement, Table S4).
FIG 3.

Prognostic evaluation of MMAI within clinical and treatment subgroups for distant metastasis. One patient with Tx and 26 patients with missing Gleason score were excluded from their corresponding analyses. ADT, androgen deprivation therapy; IT, intermediate-term; LT, long-term; N, number of patients; ng/mL, nanogram per milliliter; RT, radiation therapy; sHR, subdistribution hazard ratio; ST, short-term.
The 5-year and 10-year metastasis tdAUCs of DM MMAI were 0.81 (95% CI, 0.77 to 0.85) and 0.73 (95% CI, 0.69 to 0.77), the 10-year DDM tdAUC of PCSM MMAI was 0.73 (95% CI, 0.69 to 0.78), and the 10-year PCSM tdAUC of PCSM MMAI was 0.71 (95% CI, 0.66 to 0.76); MMAI algorithms for DM, DDM, and PCSM had consistently higher tdAUC estimates compared with NCCN risk group over time (Data Supplement, Fig S3). At 10 years, tdAUCs were compared, and MMAI outperformed NCCN for DM (P < .001), DDM (P < .001), and PCSM (P < .001).
Reclassifications of Standard Clinical Risk Factors and MMAI
The overall 10-year metastasis risks were similar for men in either the NCCN or MMAI low-risk groups. However, 43.5% of the study population was classified as having MMAI low-risk disease, whereas only 30.4% were classified as NCCN low-risk.
The prevalence between NCCN risk groups and standard clinical risk factors (PSA, T-stage, Grade Group) versus MMAI risk groups is found in Figure 4. In Figure 4, 86.7% of NCCN low-, 57.0% intermediate-, and 5.8% high-risk patients were identified to be MMAI low. In contrast, 0% NCCN low-, 2.5% intermediate-, and 48.3% high-risk patients were identified to be MMAI high. Among NCCN high-risk patients, 46.0% were classified as MMAI intermediate.
FIG 4.

Reclassification between standard risk prognostic factors and MMAI risk group: (A) PSA grouping, (B) Grade Group, (C) T-stage, and (D) NCCN risk group. Twenty-seven patients missing Grade Group and 14 patients missing NCCN risk group were excluded from their corresponding analyses. MMAI, multimodal artificial intelligence; n, number of patients; NA, not applicable; NCCN, National Comprehensive Cancer Network; PSA, prostate-specific antigen.
Although the NCCN intermediate-risk population could not be strictly stratified into NCCN favorable and unfavorable intermediate-risk groups in this study due to a lack of percent positive core information, there were 285 patients who, by definition, had unfavorable intermediate feature(s) regardless of the missing data. Of these patients, 121 (42.5%) were classified as MMAI low.
Estimated metastasis risks by NCCN/MMAI subgroups are shown in Figure 2. Similar findings were observed for the analysis of DDM and PCSM events on the basis of MMAI risk groups across NCCN risk groupings for the MMAI PCSM model (Data Supplement, Figs S1 and S2).
DISCUSSION
We have demonstrated that the MMAI risk classifier can personalize an individual's risk of metastasis with simpler communication on the basis of clinically actionable risk thresholds. Specifically, the risk of metastasis at 10 years for the MMAI low group (3%, 95% CI, 2 to 5) does not differ from the risk of metastasis or upper bound of the 95% confidence interval in the NCCN-classified low-risk population (2%, 95% CI, 0 to 3) despite being approximately 40% larger in size. The MMAI risk groups also reveal a marked heterogeneity of metastasis risk for men with NCCN intermediate- or high-risk prostate cancer (3%-40%). Practically, this raises the question as to whether many men with an MMAI low score who might otherwise be recommended guideline-concordant combined-modality therapies are candidates for less-toxic single-modality therapies as an alternative. Similarly, it also identifies a group of men with an MMAI high score with a much higher risk of metastasis than implied by NCCN risk grouping alone who may consider treatment intensification.
Cancer staging or risk stratification systems serve several purposes. They can be used to communicate prognoses to patients, serve as comparator groups when evaluating new interventions to care standards, and act as thresholds for treatment intensification decisions. The MMAI risk classifier is a more precise and accurate prognosticator of metastasis than NCCN risk groups.7 This novel classifier represents a personalized score developed by a deep-learning artificial intelligence system on the basis of information from digital histopathology and some routinely accessible clinical parameters. One of the advantages of this classifier is that it was derived and developed entirely from prospectively gathered tissue and outcomes from numerous multi-institutional prospective randomized trials. These NRG/RTOG studies have evaluated the risk of metastasis in men with localized prostate cancer across the spectrum of NCCN risk groups.
The treatment guidelines produced by the NCCN are the most widely used by practitioners worldwide.21 The NCCN recommends that men with low-risk prostate cancer undergo active surveillance. Other guidelines from professional societies are also used by practitioners to guide treatment decisions.22-24 All these guidelines use the exact definition of low-risk prostate cancer originally proposed by D'Amico in 19981 and prefer conservative management for low-risk disease. By applying the MMAI low-risk threshold to the entire study population, there are nearly 50% more persons who should consider omitting the addition of ADT to radiation than by applying NCCN criteria alone. Among the 70% of patients in this study with NCCN intermediate- or high-risk disease, 54% of men would be classified in a low-risk group using MMAI. This indicates that the current NCCN guideline risk threshold for adding ADT to radiation therapy results in overtreatment for some men who are unlikely to see a benefit.
In the last decade, various contemporary risk classifiers that use combinations of clinical, pathologic, molecular, and radiographic information have emerged that can provide increasingly precise prognoses.25-28 Although precision medicine holds the promise of right-sizing treatment for each person, it also challenges systematic approaches to oncology treatments on the basis of staging cohorts. Clinical trials and treatment guidelines are usually designed around specific staging systems that cluster patients by clinical criteria into a limited number of categories. In contrast, newer risk prognosticators, such as the MMAI score7 or molecular tests, provide more precise and individualized risk estimates. Clustering precision medicine–derived risk estimates at actionable thresholds already defined by alternative staging systems used in contemporary treatment guidelines is an easy-to-communicate method to standardize personalized risk estimates against standard-of-care practices based on population cohorts. Importantly, the MMAI uses routinely collected H&E tissue slides and clinical data, and does not require the consumption of biological samples. Of note, the initial publication of the MMAI model conducted an ablation study to provide further specific detail on the incremental prognostic value of adding the digital histology components to the traditional clinical variables.7
When polled, the majority of both genitourinary oncology experts would choose not to add ADT to radiation therapy for localized prostate cancer if the absolute risk reduction for metastasis at 10 years was <2.5.29 This translates to a number needed to treat (NNT) ≤40 persons before most would agree to add ADT to RT. Meta-analysis of prospectively randomized trials has shown that the hazard ratio for adding ADT to RT to prevent metastasis is 0.59.30 Since 98% of the NCCN high-risk population in this study received ADT, this implies that the 3% risk of metastasis at 10 years observed in this subgroup with an MMAI low-risk score would have had a probability of metastasis of approximately 5% had they all been treated with radiation therapy alone. As such, the absolute risk reduction would equate to 2% or an NNT of 50 persons in the MMAI low/NCCN high-risk subgroup. By providing both a personalized risk estimator and classification system, patients and their physicians can have informed discussions about how treatment intensification fits into their care goals.
A limitation of this study is that we could not evaluate the performance of the MMAI risk classifier in men with NCCN favorable versus unfavorable intermediate-risk since the percentage of positive biopsy core information was not collected prospectively for any of the included NRG/RTOG studies. Another limitation is that only the patients receiving dose-escalated radiation therapy had NCCN intermediate-risk disease from NRG/RTOG 0126. Hence, we could not assess its contribution to risk across the spectrum of NCCN risk groups. Nevertheless, the absolute excess risk difference for metastasis at 8 years from NRG/RTOG 0126 in men receiving 79.2 Gy versus 70.2 Gy was only a 2% reduction.11 Treatment effects of ADT use and duration, as well as chemotherapy use, were not accounted for, and thus caution should be used in determining what the absolute risks would be with a specific treatment approach.
In conclusion, leveraging eight phase III randomized trials, we demonstrated that when compared with NCCN risk groups, the three-tiered MMAI risk grouping system improves prognostication and has the potential to minimize over- and undertreatment. The MMAI risk grouping system identifies a greater proportion of men with localized prostate cancer with a very low risk of long-term metastasis compared with NCCN risk groups. Additionally, the MMAI high-risk group has a very high rate of metastasis, exceeding 25% at 10 years. This novel system can aid in simple interpretation and communication of MMAI results to patients, for guidelines, and for the conduct of clinical trials.
ACKNOWLEDGMENT
We thank NRG staff Sheralee Miller, Leslie Longoria, and Suzanne Baldwin for their administrative support of the project submission to CTEP-CCSC and submission of this manuscript.
SUPPORT
Supported by grants U10CA180868 (NRG Oncology Operations), U10CA180822 (NRG Oncology SDMC), UG1CA189867 (NCORP), U24CA196067 (NRG Specimen Bank) from the National Cancer Institute (NCI). This work was also funded by Artera, Inc.
DATA SHARING STATEMENT
The data published in this article will be publicly available 6 months from publication, through requests made to NRG Oncology at APC@nrgoncology.org.
AUTHOR CONTRIBUTIONS
Conception and design: Jonathan David Tward, Huei-Chung Huang, Osama Mohamad, Jeffry P. Simko, Jingbin Zhang, Timothy N. Showalter, Edward M. Schaeffer, Daniel E. Spratt, Felix Y. Feng, Phuoc T. Tran
Administrative support: Timothy N. Showalter, Phuoc T. Tran
Provision of study materials or patients: Osama Mohamad, Jeffry P. Simko, Jedidiah M. Monson, Felix Y. Feng, Phuoc T. Tran
Collection and assembly of data: Jonathan David Tward, Huei-Chung Huang, Andre Esteva, Osama Mohamad, Jeffry P. Simko, Sandy DeVries, Jedidiah M. Monson, Jean-Paul Bahary, Howard M. Sandler, Felix Y. Feng
Data analysis and interpretation: Jonathan David Tward, Huei-Chung Huang, Douwe van der Wal, Jingbin Zhang, Songwan Joun, Timothy N. Showalter, Edward M. Schaeffer, Todd M. Morgan, James A. Wallace, Jean-Paul Bahary, Daniel E. Spratt, Joseph P. Rodgers, Felix Y. Feng, Phuoc T. Tran
Manuscript writing: All authors
Final approval of manuscript: All authors
Accountable for all aspects of the work: All authors
AUTHORS' DISCLOSURES OF POTENTIAL CONFLICTS OF INTEREST
The following represents disclosure information provided by authors of this manuscript. All relationships are considered compensated unless otherwise noted. Relationships are self-held unless noted. I = Immediate Family Member, Inst = My Institution. Relationships may not relate to the subject matter of this manuscript. For more information about ASCO's conflict of interest policy, please refer to www.asco.org/rwc or ascopubs.org/po/author-center.
Open Payments is a public database containing information reported by companies about payments made to US-licensed physicians (Open Payments).
Jonathan David Tward
Honoraria: Bayer
Consulting or Advisory Role: Myriad Genetics, Blue Earth Diagnostics, Janssen Scientific Affairs, Merck, Bayer, Boston Scientific, Myovant Sciences, Lantheus Medical Imaging
Research Funding: Bayer (Inst), Myriad Genetics (Inst)
Expert Testimony: Expert Consulting Services
Travel, Accommodations, Expenses: Myriad Genetics, Bayer
Huei-Chung Huang
Employment: Artera Inc, Los Altos, CA
Stock and Other Ownership Interests: Artera Inc, Los Altos, CA
Andre Esteva
Employment: Artera
Leadership: Artera
Stock and Other Ownership Interests: Artera
Patents, Royalties, Other Intellectual Property: Artera's founding IP—multi-modal AI technology for cancer therapy personalization, using digital pathology
Travel, Accommodations, Expenses: Artera
Osama Mohamad
Employment: MD Anderson Cancer Center
Douwe van der Wal
Employment: Artera AI
Stock and Other Ownership Interests: Artera AI
Travel, Accommodations, Expenses: Artera AI
Jeffry P. Simko
Stock and Other Ownership Interests: Protean Biodiagnostics, Alpenglow Biosciences, Triopsy Medical Inc
Consulting or Advisory Role: Uro-1
Research Funding: Intuitive Surgical (Inst)
Sandy DeVries
Employment: University of California, San Francisco
Jingbin Zhang
Employment: Artera
Songwan Joun
Employment: Artera Inc, Los Altos, CA
Stock and Other Ownership Interests: Artera Inc, Los Altos, CA
Timothy N. Showalter
Employment: Artera
Leadership: Artera
Edward M. Schaeffer
Consulting or Advisory Role: Pfizer, ProGenics, Astellas Pharma
Todd M. Morgan
Consulting or Advisory Role: Stratify Genomics, Tempus, Foundation Medicine
Research Funding: MDxHealth (Inst)
James A. Wallace
Speakers' Bureau: Jazz Pharmaceuticals
Jean-Paul Bahary
Honoraria: SERVIER
Howard M. Sandler
Consulting or Advisory Role: Janssen
Other Relationship: Caribou Publishing
Daniel E. Spratt
Consulting or Advisory Role: Janssen Oncology, AstraZeneca, Boston Scientific, Bayer, Blue Earth Diagnostics, Pfizer, Astellas Scientific and Medical Affairs Inc
Research Funding: Janssen (Inst)
Uncompensated Relationships: NCCN
Open Payments Link: https://openpaymentsdata.cms.gov/physician/869226
Felix Y. Feng
Stock and Other Ownership Interests: Artera, SerImmune, Bluestar Genomics
Consulting or Advisory Role: Janssen Biotech, Astellas Pharma, SerImmune, Foundation Medicine, Exact Sciences, Bristol Myers Squibb, Varian Medical Systems, Novartis, Roivant, Bayer, BlueStar Genomics, Myovant Sciences, Tempus, Artera, POINT Biopharma
Research Funding: Zenith Epigenetics
Phuoc T. Tran
Honoraria: Reflexion Medical
Consulting or Advisory Role: Astellas Pharma, Regeneron, GenomeDx, Reflexion Medical, Dendreon, Noxopharm, Janssen, Myovant Sciences, AstraZeneca, Bayer Health, Lantheus Medical Imaging
Research Funding: Astellas Pharma (Inst), Reflexion Medical (Inst), Bayer Health (Inst)
Patents, Royalties, Other Intellectual Property: Compounds and Methods of Use in Ablative Radiotherapy. Patent filed 3/9/2012. PCT/US2012/028475. PCT/WO/2012/122471
Travel, Accommodations, Expenses: Reflexion Medical
No other potential conflicts of interest were reported.
REFERENCES
- 1.D'Amico AV, Whittington R, Malkowicz SB, et al. : Biochemical outcome after radical prostatectomy, external beam radiation therapy, or interstitial radiation therapy for clinically localized prostate cancer. JAMA 280:969-974, 1998 [DOI] [PubMed] [Google Scholar]
- 2.Klein EA, Haddad Z, Yousefi K, et al. : Decipher genomic classifier measured on prostate biopsy predicts metastasis risk. Urology 90:148-152, 2016 [DOI] [PubMed] [Google Scholar]
- 3.Tward JD, Schlomm T, Bardot S, et al. : Personalizing localized prostate cancer: Validation of a combined clinical cell-cycle risk (CCR) score threshold for prognosticating benefit from multimodality therapy. Clin Genitourin Cancer 19:296-304 e3, 2021 [DOI] [PubMed] [Google Scholar]
- 4.Dess RT, Suresh K, Zelefsky MJ, et al. : Development and validation of a clinical prognostic stage group system for nonmetastatic prostate cancer using disease-specific mortality results from the International staging Collaboration for cancer of the prostate. JAMA Oncol 6:1912-1920, 2020 [DOI] [PMC free article] [PubMed] [Google Scholar]
- 5.Cooperberg MR, Pasta DJ, Elkin EP, et al. : The University of California, San Francisco cancer of the prostate risk assessment score: A straightforward and reliable preoperative predictor of disease recurrence after radical prostatectomy. J Urol 173:1938-1942, 2005 [DOI] [PMC free article] [PubMed] [Google Scholar]
- 6.Network NCC (ed): NCCN Clinical Practice Guidelines in Oncology—Prostate Cancer, version 1.2023, September 2022. 2023 [Google Scholar]
- 7.Esteva A, Feng J, van der Wal D, et al. : Prostate cancer therapy personalization via multimodal deep learning on randomized phase III clinical trials. NPJ Digital Med 5:71, 2022 [DOI] [PMC free article] [PubMed] [Google Scholar]
- 8.Lawton CAF, Lin X, Hanks GE, et al. : Duration of androgen deprivation in locally advanced prostate cancer: Long-term update of NRG oncology RTOG 9202. Int J Radiat Oncol Biol Phys 98:296-303, 2017 [DOI] [PMC free article] [PubMed] [Google Scholar]
- 9.Jones CU, Pugh SL, Sandler HM, et al. : Adding short-term androgen deprivation therapy to radiation therapy in men with localized prostate cancer: Long-term update of the NRG/RTOG 9408 randomized clinical trial. Int J Radiat Oncol Biol Phys 112:294-303, 2022 [DOI] [PMC free article] [PubMed] [Google Scholar]
- 10.Roach M, Moughan J, Lawton CAF, et al. : Sequence of hormonal therapy and radiotherapy field size in unfavourable, localised prostate cancer (NRG/RTOG 9413): Long-term results of a randomised, phase 3 trial. Lancet Oncol 19:1504-1515, 2018 [DOI] [PMC free article] [PubMed] [Google Scholar]
- 11.Rosenthal SA, Hunt D, Sartor AO, et al. : A phase 3 trial of 2 Years of androgen suppression and radiation therapy with or without adjuvant chemotherapy for high-risk prostate cancer: Final results of radiation therapy oncology group phase 3 randomized trial NRG oncology RTOG 9902. Int J Radiat Oncol Biol Phys 93:294-302, 2015 [DOI] [PMC free article] [PubMed] [Google Scholar]
- 12.Pisansky TM, Hunt D, Gomella LG, et al. : Duration of androgen suppression before radiotherapy for localized prostate cancer: Radiation therapy oncology group randomized clinical trial 9910. J Clin Oncol 33:332-339, 2015 [DOI] [PMC free article] [PubMed] [Google Scholar]
- 13.Lee WR, Dignam JJ, Amin MB, et al. : Randomized phase III noninferiority study comparing two radiotherapy fractionation schedules in patients with low-risk prostate cancer. J Clin Oncol 34:2325-2332, 2016 [DOI] [PMC free article] [PubMed] [Google Scholar]
- 14.Rosenthal SA, Hu C, Sartor O, et al. : Effect of chemotherapy with docetaxel with androgen suppression and radiotherapy for localized high-risk prostate cancer: The randomized phase III NRG oncology RTOG 0521 trial. J Clin Oncol 37:1159-1168, 2019 [DOI] [PMC free article] [PubMed] [Google Scholar]
- 15.Michalski JM, Moughan J, Purdy J, et al. : Effect of standard vs dose-escalated radiation therapy for patients with intermediate-risk prostate cancer: The NRG oncology RTOG 0126 randomized clinical trial. JAMA Oncol 4:e180039, 2018 [DOI] [PMC free article] [PubMed] [Google Scholar]
- 16.Collins GS, Reitsma JB, Altman DG, et al. : Transparent reporting of a multivariable prediction model for individual prognosis or diagnosis (TRIPOD): The TRIPOD statement. BMJ 350:g7594, 2015 [DOI] [PubMed] [Google Scholar]
- 17.Kaplan EL, Meier P: Nonparametric estimation from incomplete observations. J Am Stat Assoc 53:457-481, 1958 [Google Scholar]
- 18.Fine JP, Gray RJ: A proportional hazards model for the subdistribution of a competing risk. J Am Stat Assoc 94:496-509, 1999 [Google Scholar]
- 19.Cox DR: Regression models and life-tables. J R Stat Soc Ser B Stat Methodol 34:187-202, 1972 [Google Scholar]
- 20.Blanche P, Dartigues JF, Jacqmin-Gadda H: Estimating and comparing time-dependent areas under receiver operating characteristic curves for censored event times with competing risks. Stat Med 32:5381-5397, 2013 [DOI] [PubMed] [Google Scholar]
- 21.Carlson R, Donnelly C, Winckworth-Prejsnar K, et al. : National Comprehensive Cancer Network: Global utilization of clinical oncology guidelines. JCO Glob Oncol 10.1200/jgo.18.82000 [Google Scholar]
- 22.Mottet NBJ, Briers E, Bolla M, et al. : members of the EAU – ESTRO – ESUR –SIOG Prostate Cancer Guidelines Panel. EAU – ESTRO – ESUR – SIOG Guidelines on Prostate Cancer. Edn presented at the EAU Annual Congress Amsterdam 2020. 978-94-92671-07-3. Publisher: EAU Guidelines Office. Place published: Arnhem, The Netherlands: EAU – ESTRO – ESUR – SIOG Guidelines on Prostate Cancer presented at the EAU Annual Congress Amsterdam 2020. 978-94-92671-07-3. Arnhem, the Netherlands, EAU Guidelines Office, 2020 [Google Scholar]
- 23.Bekelman JE, Rumble RB, Chen RC, et al. : Clinically localized prostate cancer: ASCO Clinical Practice Guideline endorsement of an American Urological Association/American Society for Radiation Oncology/Society of Urologic Oncology guideline. J Clin Oncol 36:3251-3258, 2018 [DOI] [PubMed] [Google Scholar]
- 24.Parker C, Castro E, Fizazi K, et al. : Prostate cancer: ESMO clinical practice guidelines for diagnosis, treatment and follow-up. Ann Oncol 31:1119-1134, 2020 [DOI] [PubMed] [Google Scholar]
- 25.Tward J, Lenz L, Flake DD II, et al. : The clinical cell-cycle risk (CCR) score is associated with metastasis after radiation therapy and provides guidance on when to forgo combined androgen deprivation therapy with dose-escalated radiation. Int J Radiat Oncol Biol Phys 113:66-76, 2022 [DOI] [PubMed] [Google Scholar]
- 26.Nguyen PL, Haddad Z, Ross AE, et al. : Ability of a genomic classifier to predict metastasis and prostate cancer-specific mortality after radiation or surgery based on needle biopsy specimens. Eur Urol 72:845-852, 2017 [DOI] [PubMed] [Google Scholar]
- 27.Nguyen PL, Martin NE, Choeurng V, et al. : Utilization of biopsy-based genomic classifier to predict distant metastasis after definitive radiation and short-course ADT for intermediate and high-risk prostate cancer. Prostate Cancer Prostatic Dis 20:186-192, 2017 [DOI] [PMC free article] [PubMed] [Google Scholar]
- 28.Van Den Eeden SK, Lu R, Zhang N, et al. : A biopsy-based 17-gene genomic prostate score as a predictor of metastases and prostate cancer death in surgically treated men with clinically localized disease. Eur Urol 73:129-138, 2018 [DOI] [PubMed] [Google Scholar]
- 29.Spratt DE, Tward JD: Absolute versus relative benefit of androgen deprivation therapy for prostate cancer: Moving beyond the hazard ratio to personalize therapy. Int J Radiat Oncol Biol Phys 108:899-902, 2020 [DOI] [PubMed] [Google Scholar]
- 30.Kishan AU, Sun Y, Hartman H, et al. : Androgen deprivation therapy use and duration with definitive radiotherapy for localised prostate cancer: An individual patient data meta-analysis. Lancet Oncol 23:304-316, 2022 [DOI] [PubMed] [Google Scholar]
Associated Data
This section collects any data citations, data availability statements, or supplementary materials included in this article.
Data Availability Statement
The data published in this article will be publicly available 6 months from publication, through requests made to NRG Oncology at APC@nrgoncology.org.