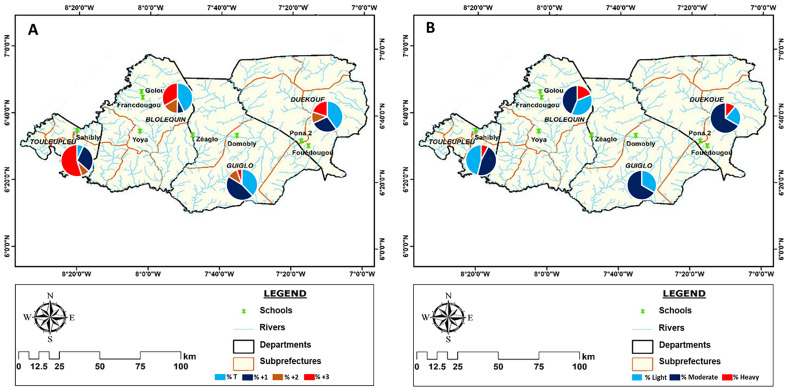
Figure 6.
Distribution of infection intensities per department of positive schoolchildren with baseline layers obtained from: https://www.diva-gis.org/. A: intensities distribution according to the POC-CCA test, B: Intensities distribution according to Kato-Katz test.

