Abstract
The neural crest is vertebrate-specific stem cell population that helped drive the origin and evolution of the vertebrate clade. A distinguishing feature of these stem cells is their multi-germ layer potential, which has drawn developmental and evolutionary parallels to another stem cell population—pluripotent embryonic stem cells (animal pole cells or ESCs) of the vertebrate blastula. Here, we investigate the evolutionary origins of neural crest potential by comparing neural crest and pluripotency gene regulatory networks (GRNs) of jawed vertebrates (Xenopus) with the expression of these factors in a jawless vertebrate (lamprey). We reveal an ancient evolutionary origin of shared regulatory factors in these GRNs that dates back to the last common ancestor of extant vertebrates. Focusing on the key pluripotency factor pou5, we show that the lamprey genome encodes a pou5 ortholog that is expressed in animal pole cells but is absent from neural crest. Gain-of-function experiments show that both lamprey and Xenopus pou5 enhance neural crest formation, suggesting that pou5 was either lost from the neural crest of jawless vertebrates or acquired along the jawed vertebrate stem. Finally, we provide evidence that supports pou5 acquiring novel neural crest-enhancing activity after evolving from an ancestral pou3-like clade. In sum this work provides evidence for conservation in lamprey of the blastula pluripotency network identified in jawed vertebrates, conservation across vertebrates of a related network in the neural crest and the functional evolution of pou5. We propose that the core pluripotency-neural crest GRN was assembled in stem vertebrates and that the multi-germ layer potential of the neural crest evolved by deploying this regulatory program.
Embryogenesis can be generalized as a progressive restriction of developmental potential, beginning with a totipotent egg. In vertebrates, a key population of cells defies this principle—the neural crest. Neural crest cells arise in the ectoderm at the neural plate border, yet they display a multi-germ layer potential greater than that of their ostensibly ectodermal progenitors1–3. These stem cells are central to the vertebrate body plan as they contribute diverse cell types, tissues, and structures that were essential to the origin and diversification of vertebrates, including cartilage, bone, and smooth muscle of the craniofacial skeleton, sensory neurons and glia of the peripheral nervous system, colorful patterns of pigmentation in skin, feathers, and scales, and primordia of the teeth and heart3–5.
Insights into the origins of neural crest potential came from the realization that these stem cells share GRN components with pluripotent stem cells of the vertebrate blastula1,3,6,7. Indeed, in Xenopus neural crest regulatory genes such as snai1, zic1, id3, tfap2a, and foxd3 are co-expressed with the core pluripotency genes sox2, pou5, myc, and ventx/nanog8,9 in blastula (“animal pole”) stem cells, and are required for maintenance of pluripotency1. These shared features10,11 led us to hypothesize that the neural crest evolved by deploying molecular characteristics of those earlier cells. Under this model, deployment of the blastula-stage pluripotency GRN enables neural crest cells to escape early lineage restriction and contribute a diverse array of cell types to the vertebrate body plan. In mouse embryos it was also found that core pluripotency factors are required for neural crest cell potential12 and it was suggested that pluripotency factors such as pou5 become re-activated in neural crest progenitors, thereby reprogramming these cells to have expanded cellular potential12. However, more recent work in chick and mouse embryos reported that core pluripotency factors pou5, nanog, and klf4 share broad ectodermal expression from the epiblast through gastrulation and neurulation before becoming restricted to the neural crest, similar to Xenopus13.
These studies all point to the developmental potential of the neural crest in jawed vertebrates being linked to the deployment of pluripotency GRN components and suggest that a dual pluripotency-neural crest GRN may be evolutionarily conserved across vertebrates. However, the relationship between pluripotency and neural crest GRN components has never been examined in the other major clade of vertebrates—the jawless cyclostomes (lampreys, hagfish). Accordingly, here we compare the expression of these factors in a jawed vertebrate, the frog, Xenopus laevis to that of a jawless vertebrate, the sea lamprey, Petromyzon marinus (Fig. 1a, b).
Fig. 1.
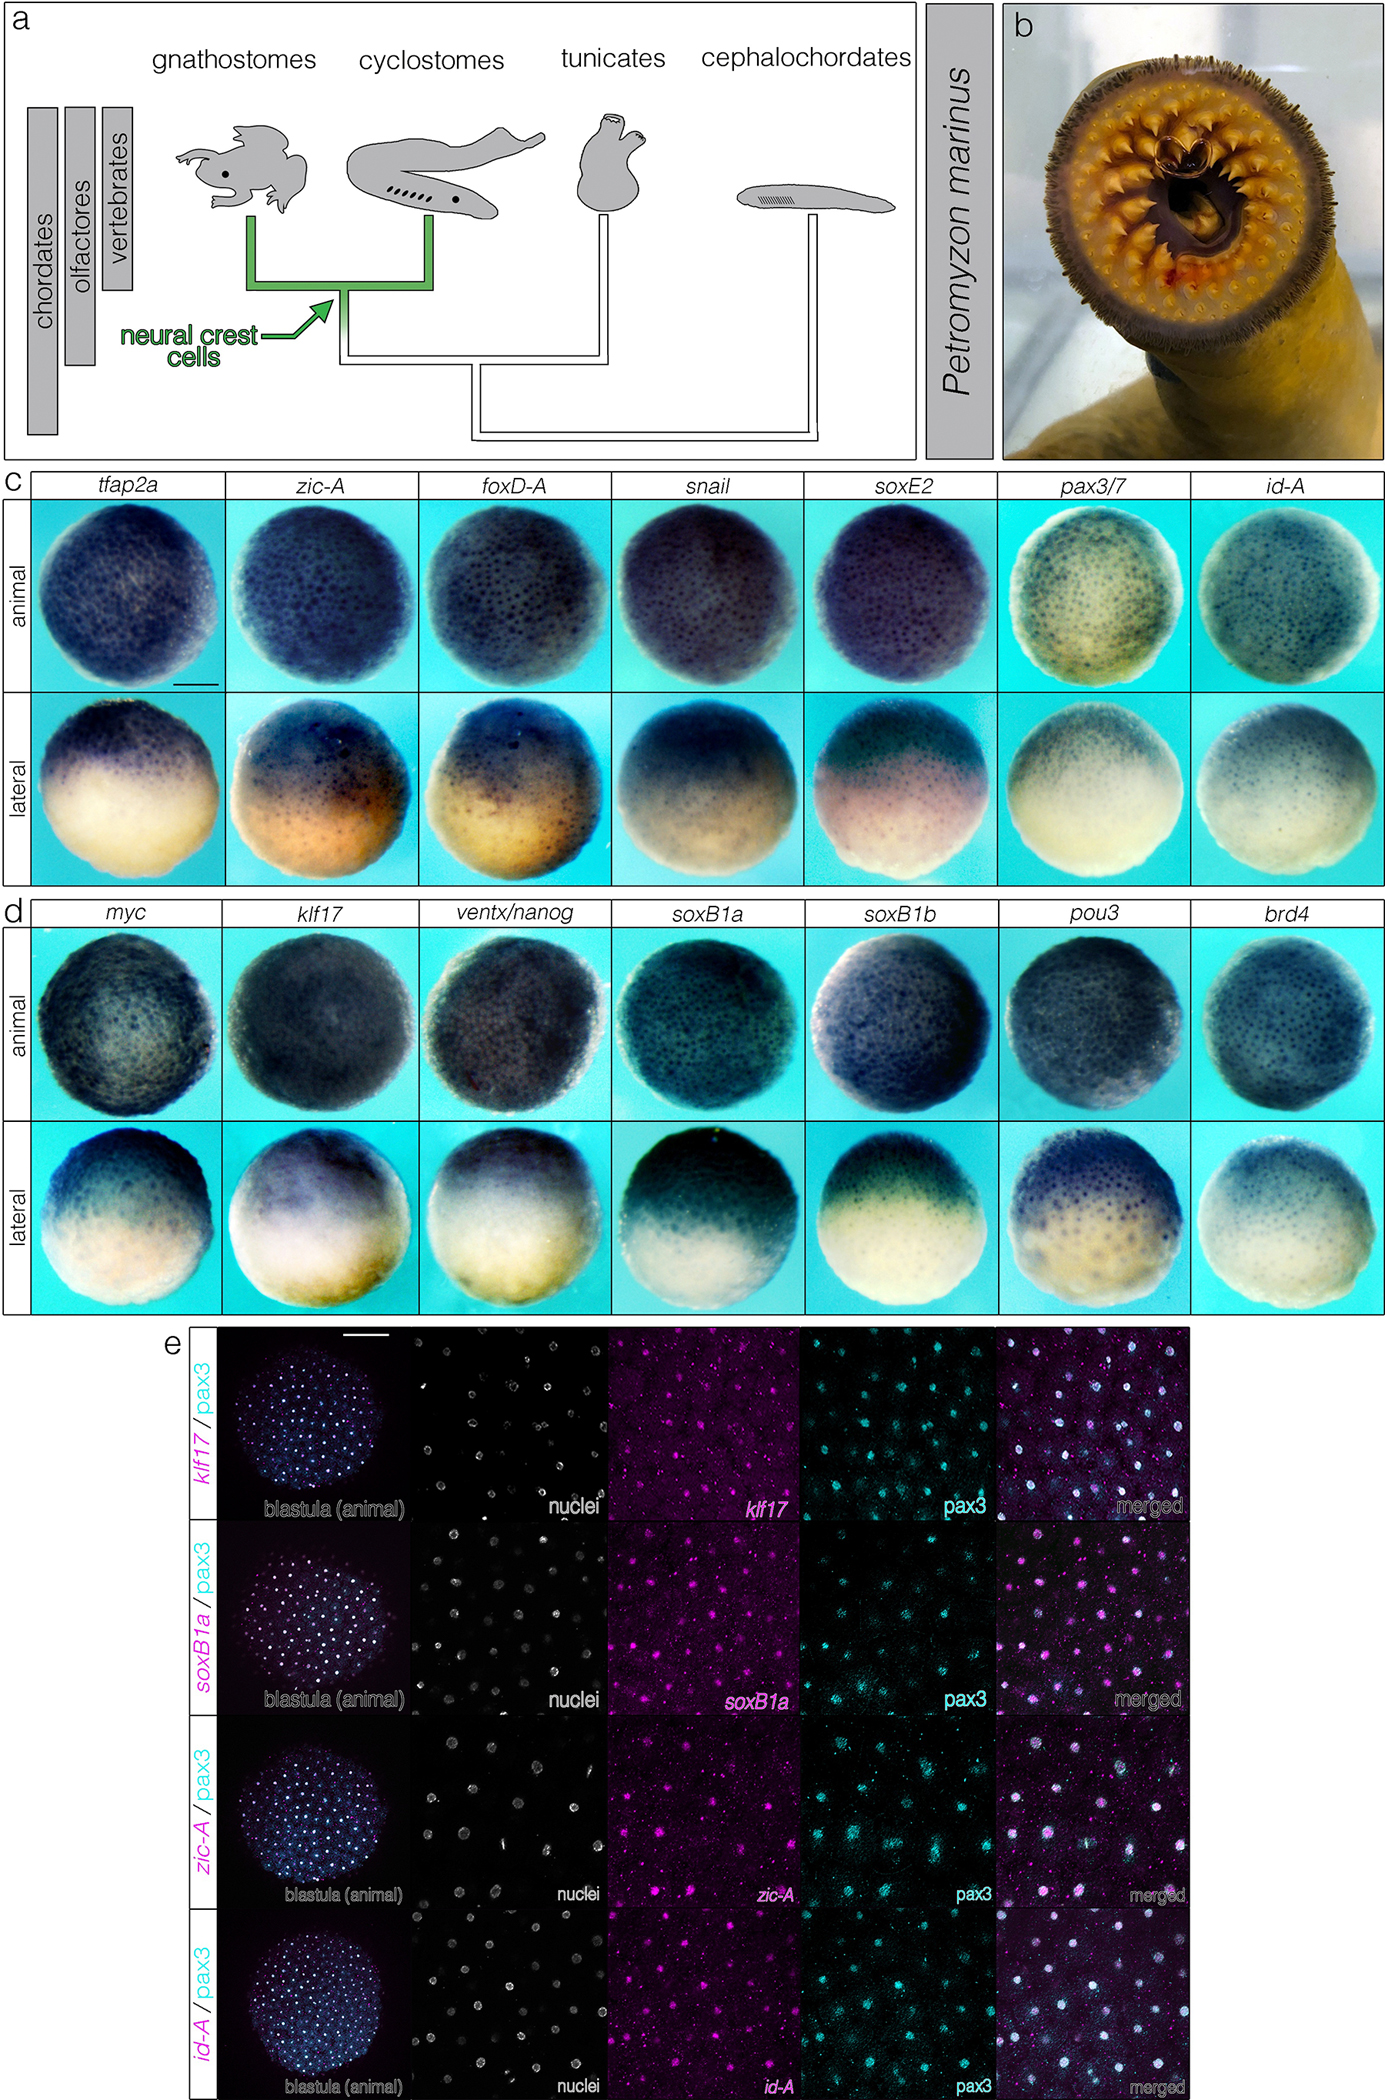
Lamprey animal pole cells co-express neural crest and pluripotency GRN components. (a, b) Phylogenetic framework for investigating the evolutionary origins of neural crest potential using the sea lamprey (Petromyzon marinus) and Xenopus laevis, species separated by 500 million years of evolution. (c) in situ hybridizations of canonical neural crest and (d) pluripotency genes in animal pole cells of blastula-stage lamprey embryos. (e) Neural crest and pluripotency factors co-localize in lamprey animal pole cells. Reproducible on n ≥ 10 embryos per time point for n ≥ 3 experiments. Scale bars: 250 μm.
Results
Neural crest and pluripotency GRN factors expressed in the lamprey blastula
If neural crest and pluripotency GRNs share a common developmental and evolutionary origin, then a shared expression signature between these cells should be found in both jawed and jawless vertebrates. In Xenopus, this signature is revealed by co-expression of neural crest (sox5, snai1, id3, tfap2a, foxd3, zic1, ets1) and pluripotency (sox2, sox3, ventx2.2, myc, pou5f3.2, pou5f3.3) genes1 in blastula animal pole stem cells. We examined if this expression signature is conserved in blastula-stage lamprey embryos. In situ hybridization showed that tfap2a, zic-A, foxD-A, snail, soxE2, pax3/7, and id-A as well as myc, klf17, ventx/nanog, soxB1a, soxB1b, brd4 were all expressed in lamprey animal pole cells, analogous to Xenopus (Fig. 1c, d; Extended Data Fig. 1). Double-labeling experiments further demonstrated extensive co-expression of these factors in individual cells (Fig. 1e). These results constrain the origins of the vertebrate pluripotency GRN to the last common vertebrate ancestor and highlight deeply conserved developmental and evolutionary affinities between neural crest stem cells and animal pole stem cells.
Expression of pluripotency-linked genes in the lamprey neural plate border and neural crest
Given that both neural crest GRN components as well as those linked to pluripotency are co-expressed in lamprey animal pole cells (Fig. 1), we next examined the expression of these factors through gastrulation and neural crest formation. Canonical pluripotency factors from jawed vertebrates, including myc, ventx/nanog, and klf17, all displayed expression in the lamprey gastrula ectoderm, neural plate border, and neural crest, that was very similar to their expression in Xenopus (Fig. 2a; Extended Data Fig. 2). Orthologs of soxB1 were also expressed in the blastula, gastrula ectoderm and neural plate border, but then downregulated in premigratory neural crest (Fig. 2a; Extended Data Fig. 2), concomitant with a switch to soxE factor expression, a feature conserved with Xenopus14. Similarly, neural crest regulatory genes such as tfap2a, zic-A, snail, and id-A, after initially being expressed in animal pole cells were also expressed in neural plate border and neural crest, similar to Xenopus (Fig. 2b; Extended Data Fig. 3). Double-labeling experiments showed co-expression of neural crest and pluripotency-linked factors in individual cells, as was observed at blastula stages (Fig. 2c; Extended Data Fig. 4). Notably, we did not observe axial-specific expression of these factors, supporting recent work15 suggesting that the neural crest of ancestral vertebrates displayed similar expression along the anteroposterior axis. (Extended Data Fig. 5).
Fig. 2.
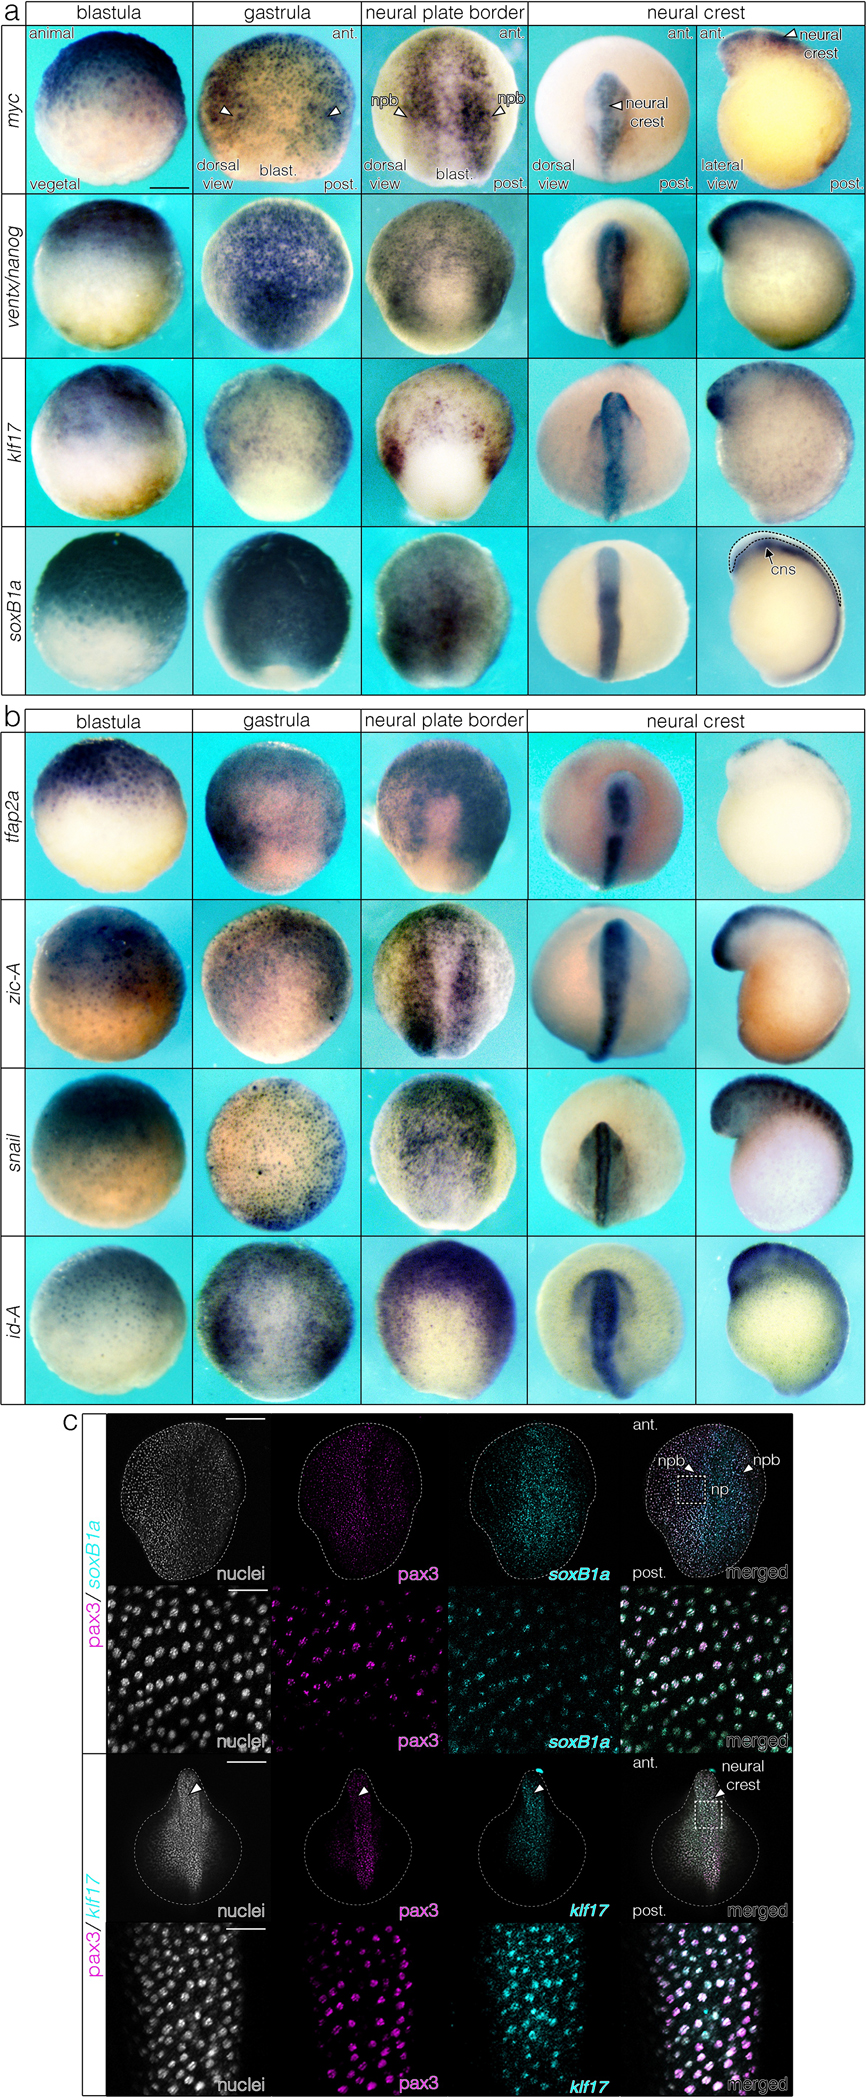
Neural crest and pluripotency GRN components are both expressed in the blastula and neural plate border and neural crest in lamprey. (a, b) Time series of in situ hybridizations for pluripotency and neural crest regulatory genes. (c) Co-localization of neural crest and pluripotency factors in the neural plate border and neural crest of lamprey. Reproducible on n ≥ 10 embryos per time point for n ≥ 3 experiments. Abbreviations: npb= neural plate border, ant = anterior, post = posterior, cns = central nervous system. Scale bar: 250 μm.
Taken together, these results show that core components of the jawed vertebrate neural crest and pluripotency GRNs are initially expressed together in lamprey animal pole cells and then deployed in the neural plate border and neural crest, analogous to their expression in Xenopus.
Transcriptomic signature of pluripotency factors in neural crest and animal pole cells
Few studies have examined pre-gastrula stages of lamprey development16,17 and there are no published transcriptomes of isolated animal pole cells at these stages. The lack of such data makes it unclear if the components of the canonical pluripotency GRN identified in jawed vertebrates were also fully present in jawless vertebrates, or if some features are an innovation of jawed vertebrates. To examine this, we performed RNA-Seq on animal pole explants dissected from blastula-stage lamprey embryos (Tahara 11 (T11); Fig. 3, Extended Data Fig. 6a-h). Although it is unknown whether lamprey animal pole cells are functionally pluripotent (i.e., form all cell types), we recovered an expression signature consistent with such a progenitor-like state, as revealed by high expression levels of pluripotency factors (e.g., myc, soxB1, klf17, ventx/nanog) and a lack of gene expression suggesting commitment to germ layer differentiation (Extended Data Fig. 6i). We then compared our lamprey animal cap transcriptome to published transcriptomes18 of neural crest dissected from early (T18) and late (T21) neurula-stage embryos (Fig. 3a). For evolutionary comparisons, we performed RNA-Seq on pluripotent animal pole explants dissected from st9 Xenopus blastulae, and on animal caps reprogrammed to neural plate border (early neurula, st13) and neural crest (late neurula, st17) states using wnt8a/chordin expression (Fig. 3a, Extended Data Fig. 6d, e, g, h).
Fig. 3.
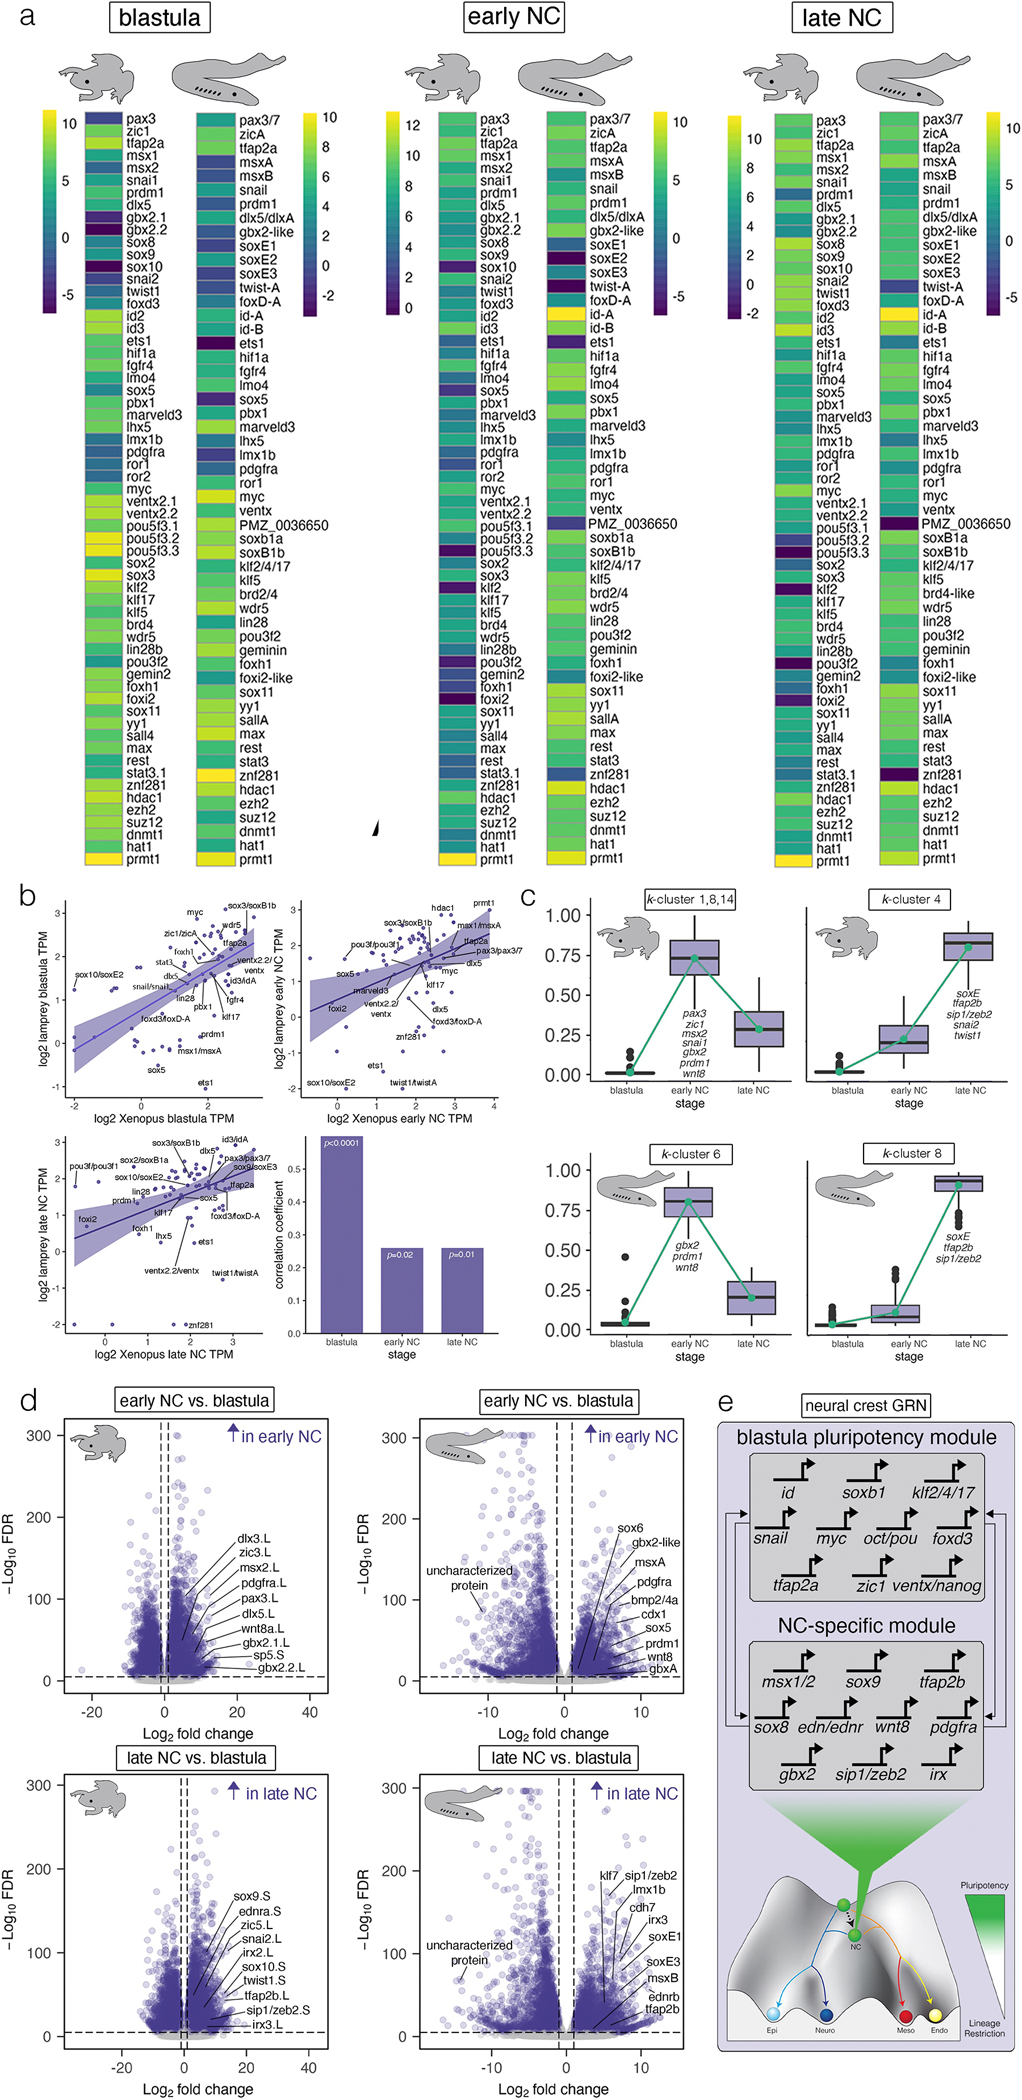
Comparative transcriptomics of neural crest and pluripotency GRNs. (a) Heatmaps of log-transformed transcript abundance (transcripts per million, TPM) for Xenopus and lamprey depicting expression of genes essential for pluripotency and neural crest formation. (b) Spearman correlations of TPMs across Xenopus and lamprey for animal pole cells and neural crest. (c) k-means clusters showing conserved expression dynamics of genes with an early and late neural crest signature. (d) Volcano plots showing genes that are specific to the neural crest in Xenopus and lamprey. Data were obtained from ≥100 lamprey animal caps (n = 3 biological replicates per stage) and ≥10 Xenopus animal caps (n = 3 biological replicates per stage). A false discovery rate of p < 0.05 determined statistical significance. (e) The neural crest-pluripotency GRN depicted as two distinct modules associated with blastula-stage pluripotency (top) and novel genes co-opted to the neural crest (bottom).
Directly comparing the transcriptomes of Xenopus and lamprey—species separated by 500 million years of independent evolution—is complicated by the lack of clear gene orthology for some genes. Therefore, gene expression levels were normalized within each species to compare the relative abundance of GRN components. We focused on neural crest factors, pluripotency factors, signaling pathways, and chromatin modifiers known to be essential for maintenance of pluripotency and/or neural crest development in vertebrates and identified their lamprey counterparts for comparisons (Materials and Methods). This analysis revealed considerable conservation of the relative expression levels of many of these factors, particularly within lamprey animal pole cells as compared to Xenopus (Fig. 3a). These included homologs of id3, tfap2a, foxd3, pax3, zic1, lmo4, hif1a, dlx5, pbx1 (neural crest factors), myc, stat3, foxh1, foxi2, soxB1 (sox2/3), sox11, fgfr4, klf2/4/17, ventx/nanog, brd4, wdr5, lin28, znf281, geminin, yy1, sall4 (pluripotency factors), and ezh2, suz12, hdac1, and prmt1 (chromatin modifiers). While there was also evidence for conservation of relative expression levels in the neural crest, this was reduced relative to that of animal pole cells (Fig. 3a).
To test evolutionary conservation more quatitatively, we performed cross-species correlations of transcript abundance (transcripts per million, TPM) across developmental time (Fig. 3b, Materials and Methods, Source Data File S1). Despite Xenopus and lamprey being separated by over half a billion years of independent evolution, we found statistically significant and positive cross-species correlations of transcript abundance in the blastula (r=0.60, p<0.0001), and neural crest at early neurula (r=0.28, p=0.02) and late neurula (r=0.29, p=0.01) stages (Fig. 3b). Notably, correlation coefficients were highest between Xenopus and lamprey in the blastula and lower in early and late neural crest (Fig. 3b), suggesting that selective constraints on transcript abundance are strongest at blastula stages. Among the genes displaying the most strictly conserved transcript levels across all stages were homologs of tfap2a, klf17, soxB1, and ventx/nanog (Fig. 3b). This suggests that strong selection pressures maintained these factors at similar levels in pluripotency GRNs across jawed and jawless vertebrates over evolutionary time. This is consistent with the requirement for precise levels of sox2 and pou5 to maintain pluripotency in mammalian ES cells19–21.
Our comparisons also revealed key differences in these GRNs across vertebrates. For example, compared to Xenopus, lamprey prdm1 and sox5 show limited expression in blastula animal pole cells, and lamprey ets1 is not expressed in these cells, as previously reported for the lamprey neural crest14,15 (Fig. 3a). Other important differences include moderate-to-high levels of lefty, eomes, and otxA in the lamprey blastula, similar to early mouse embryos22–24, factors which are expressed at negligible levels in Xenopus (Extended Data Fig. 6j). We also found key differences between mammalian pluripotency GRNs and lamprey and Xenopus. Expression of some genes involved in mouse ES cells such as essrb25,26, nr5a1/227,28, cdx1/229,30, tbx3 31,32, myb33, fgf434,35, and prdm14 36,37 was absent in both lamprey and Xenopus blastula cells (Extended Data Fig. 6k). These may therefore reflect mammalian-specific adaptations of the vertebrate pluripotency GRN, although not all of these genes have been shown to also be essential in inner cell mass cells.
Expression dynamics of neural crest and pluripotency GRN components
We used k-means clustering to compare the transcriptional dynamics of Xenopus neural crest and pluripotency GRNs to lamprey. Several components showed highly correlated and conserved expression dynamics from the blastula to early and late neural crest in both species (Fig. 3c; Source Data File S2). For example, in both species some definitive neural crest factors, such as soxE, tfap2b, and ednrA/B, displayed monotonic increases in expression as cells progressed from blastula to late neurula stages. Interestingly, in Xenopus but not lamprey twist1, ets1, and snai2 also displayed these dynamics (Fig. 3c). By contrast, some neural plate border factors exhibited non-monotonic expression dynamics, with their expression peaking at early neural crest stages. In both lamprey and Xenopus, clusters with this signature included canonical neural plate border factors such as prdm1, gbx2 and wnt8 (Fig. 3c). Notably, a number of other neural plate border factors, including myc, pax3, msx1, zic1, and klf17 displayed these dynamics in Xenopus but not in lamprey. When we examined the expression dynamics of these genes in lamprey, we found that they either increased monotonically over time, peaking in late neural crest (pax3/7, msx-A, zic-A), or were maintained at similar levels across stages (klf17, snail, myc) (k-clusters 7,8, 11, 12; Extended Data Fig. 6f,m). This suggests modifications of ancestral gene expression dynamics may have contributed to the evolution of jawed vertebrates.
Novel GRN components co-opted into the neural crest GRN
Beyond the transcriptomic signature shared with blastula stage stem cells, neural crest cells evolved in part by co-opting novel genes and signaling pathways. An example of this includes the switch from SoxB1 to SoxE factor utilization in the blastula versus neural crest, respectively38. To further identify such novelties shared across vertebrates, we performed differential expression analyses, focusing on transcripts that showed low expression in animal pole cells (TPMs < 10) and significant enrichment in the neural crest (Fig. 3d, Source Data File S3).
Our comparisons revealed overlap in differential enrichment of genes that establish and pattern the neural plate border (wnt8, msx, gbx, irx)39–41, initiate epithelial-mesenchymal transition (EMT) and migration (pdgfra, tfap2b, sip1/zeb2, soxE) 42–45, and promote lineage diversification (endothelin signaling and soxE)46,47 (Fig. 3d). We also identified species-specific differences in regulatory programs, with lamprey having neural crest-enriched expression of prdm1, sox5, and cdh7, whereas Xenopus had neural crest-enriched expression of zic3, pax3, dlx5, and sox10 (Fig. 3d, Extended Data Fig. 6l). These results suggest that the neural crest evolved from the activity of at least two regulatory modules: a blastula-stage module that is also deployed in neural crest progenitors, and a neural crest-specific module co-opted downstream that endows the neural crest with many of its hallmark traits—EMT, migration and adoption of novel lineage states (Fig. 3e).
Lamprey pou5 is absent in neural crest but can promote neural crest formation.
In jawed vertebrates, pou5 transcription factors (pou5f1, pou5f3) are key regulators of pluripotency48–50. While pou5 had been proposed to be a jawed vertebrate innovation, recently pou5 orthologs were reported in hagfish and lamprey51–54. Nothing is known, however, about the expression and function of pou5 in jawless vertebrates, making it unclear if pou5 functioned within the ancestral vertebrate pluripotency or neural crest GRNs. Our RNA-Seq analysis in lamprey revealed an uncharacterized transcript that was among the most downregulated genes in the neural crest relative to animal pole cells (Fig. 3d), and the top hits from a BLAST analysis were pou5 transcription factors in jawed vertebrates. Molecular phylogenetics and synteny comparisons confirm that this gene is a lamprey ortholog of pou5 (Extended Data Fig. 7a, b). In agreement with our differential expression analyses, mean transcript abundance of lamprey pou5 was high in animal pole cells as in jawed vertebrates, but virtually absent in the neural crest (Extended Data Fig. 7c), an expression profile confirmed with in situ hybridization (Fig. 4a). In contrast to lamprey, the combined expression of three Xenopus pou5f3 paralogs persists from the blastula through early neural crest stages, with maternal pou5f3.3 expressed strongly in the blastula, and zygotic pou5f3.1 and pou5f3.2 expressed in the neural plate border and neural crest (Extended Data Fig. 7d, e).
Fig. 4.
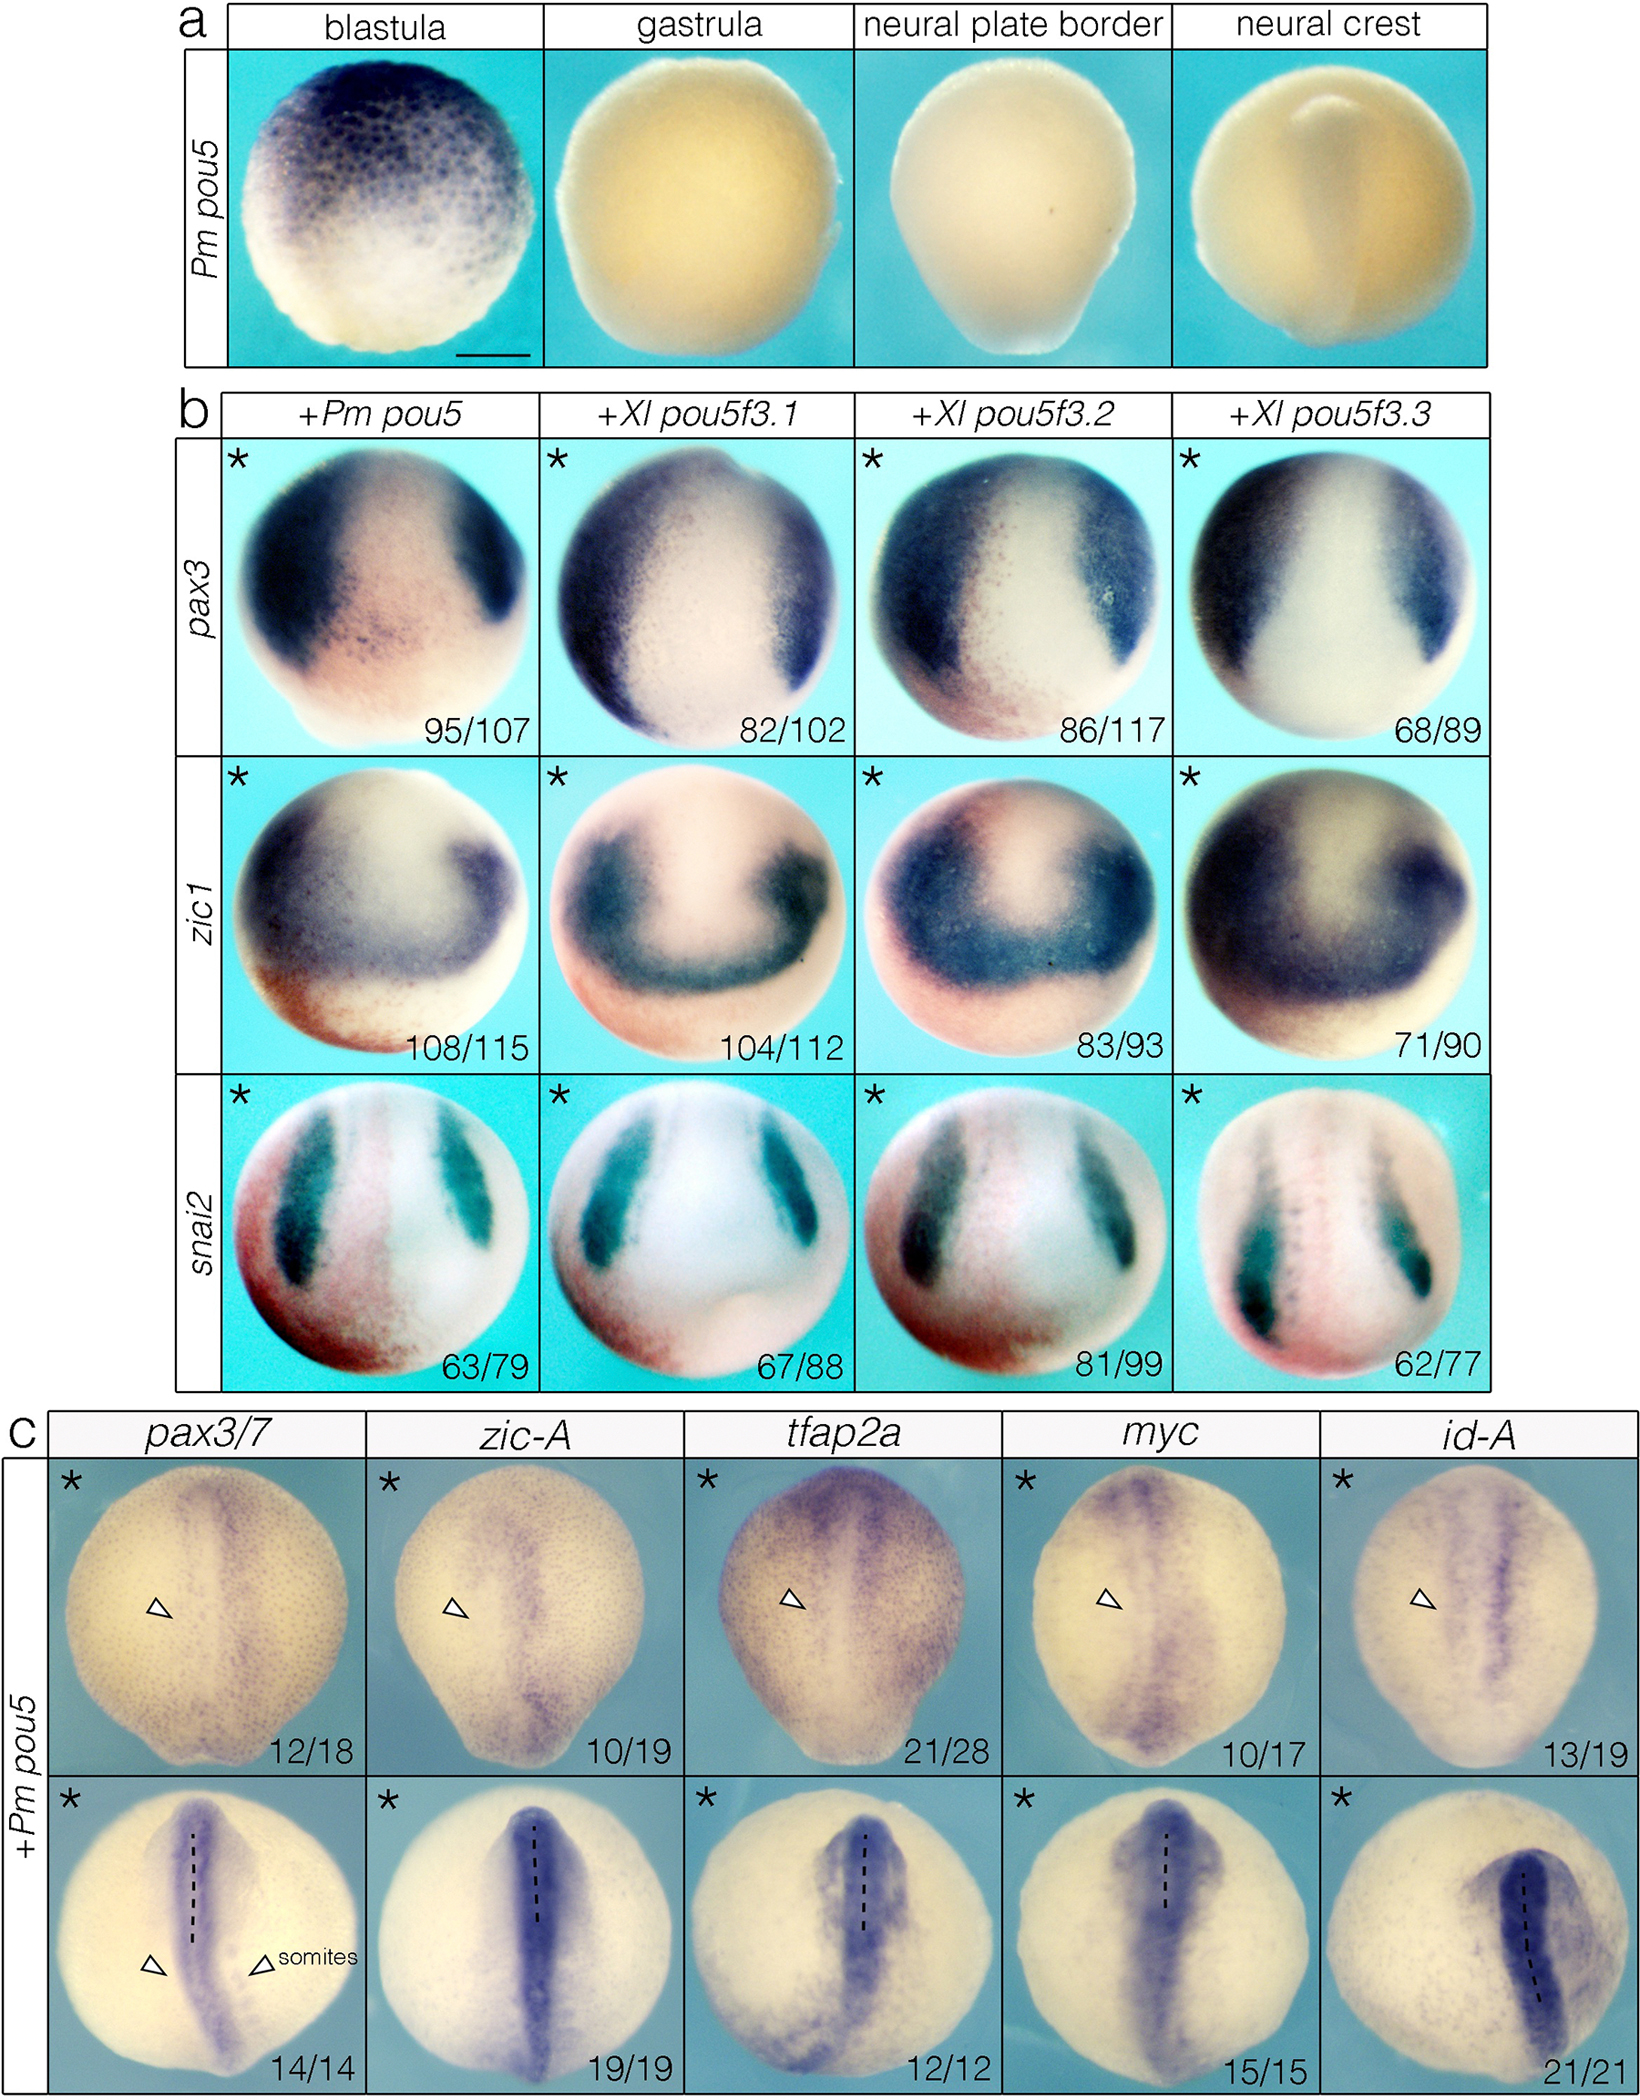
pou5 is absent from the neural crest of jawless vertebrates but can enhance neural crest formation in a jawed vertebrate. (a) in situ hybridization of lamprey pou5. (b) Overexpression of lamprey (Pm) and Xenopus (Xl) pou5 orthologs expand pax3, zic1, and snai2 in Xenopus embryos. Asterisk denotes the injected side of the embryo, which is also indicated with beta-galactosidase (red) as a lineage tracer. (c) Overexpression of lamprey pou5 in lamprey embryos either inhibits or causes no change in expression of canonical neural plate border and neural crest genes. Asterisk denotes the injected side of the embryo. Data in (b, c) were obtained from n ≥ 3 biological replicates for each construct. Scale bar: 250 μm.
Absence of pou5 expression in the lamprey neural crest is consistent with two evolutionary scenarios: subsequent co-option into the neural crest GRN of what would become jawed vertebrates, or alternatively loss from the neural crest GRN in the lineage leading to extant jawless vertebrates. We reasoned that some insights into these possibilities might be gained by examining if lamprey pou5 could functionally engage with the neural crest GRN. Accordingly, we expressed lamprey pou5 on one side of early Xenopus embryos and compared its activity to that of Xenopus pou5f3.1, pou5f3.2, or pou5f3.3 expressed at equivalent levels (Extended Data Fig. 8a). All pou5 factors were found to expand the expression domain of neural plate border and neural crest markers pax3, zic1, and snai2 to comparable extents (Fig. 4b). By contrast, when we expressed lamprey pou5 or Xenopus pou5f3 in lamprey embryos, we observed reduction or no change of expression of pax3/7, zic-A, tfap2a, myc, and id-A, (Fig. 4c, Extended Data Fig. 8b) indicating that pou5 factors are unable to productively engage the neural crest GRN in lamprey.
pou5 is required for neural crest formation in Xenopus
Because our gain-of-function experiments showed that pou5 has neural crest-promoting activity, we next asked if pou5 is required for neural crest formation in Xenopus. Morpholino-(MO) mediated depletion of the zygotic pou5f3 factors (pou5f3.1 and pou5f3.2) lead to a reduction of pax3 expression (Fig. 5a). We observed expansion of zic1 expression when pou5f3 was depleted (Fig. 5a), a difference likely due to expansion of the neural expression of this factor at the expense of its neural crest expression. Consistent with this, pou5f3 depletion resulted in a near-total loss of snai2 and foxd3 neural crest expression (Fig. 5a) that was not driven by a compensatory increase in pou5f3.3 expression (Extended Data Fig. 9). We then tested if lamprey pou5 can functionally substitute for Xenopus pou5f3 by comparing its ability to rescue the pou5 depletion phenotype to that of Xenopus pou5f3.1 or pou5f3.2. We found that lamprey and Xenopus pou5 orthologs were indistinguishable in their ability to restore snai2 and foxd3 expression (Fig. 5b), providing further evidence that lamprey pou5 can properly engage the neural crest GRN of jawed vertebrates.
Fig. 5.
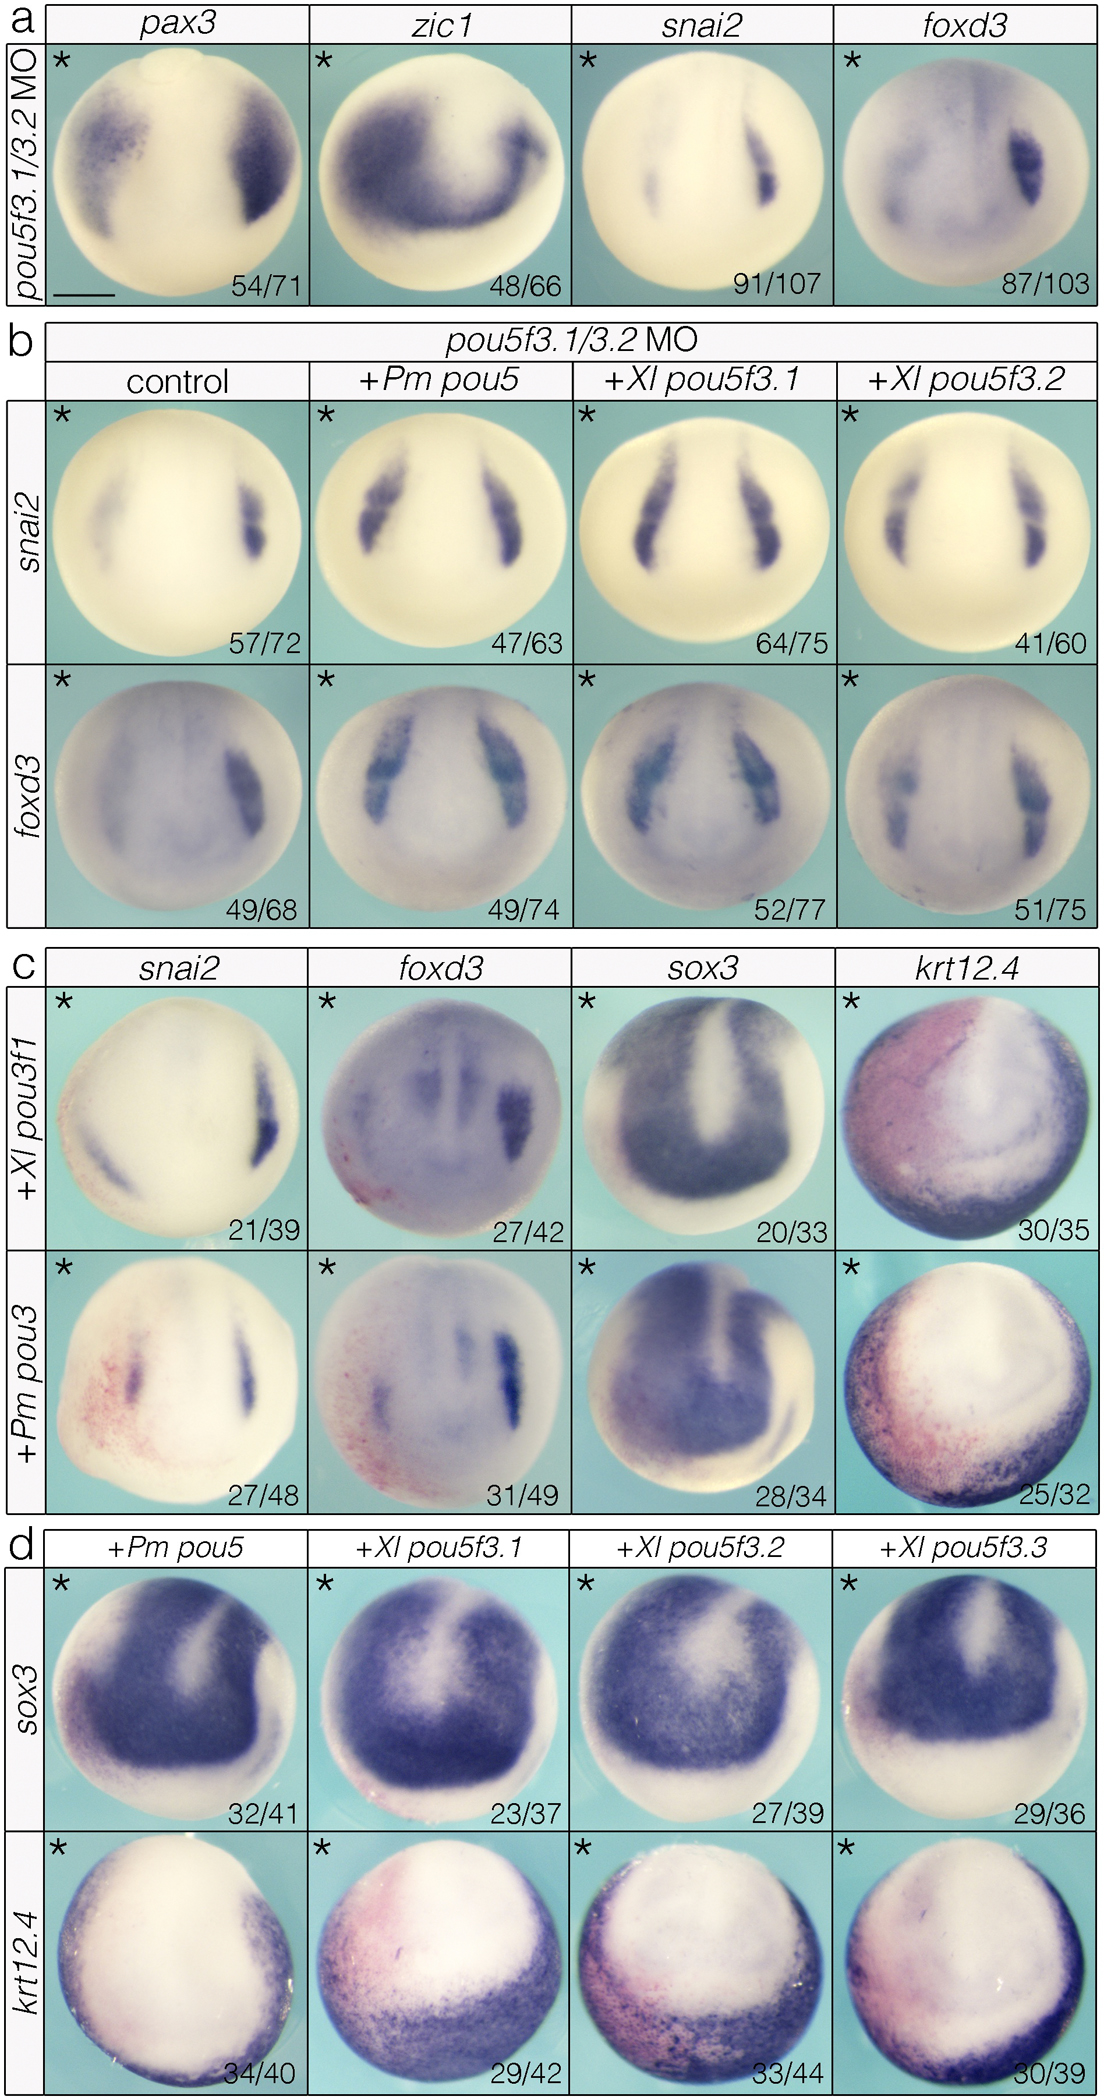
pou5 is essential for neural crest formation and evolved neural crest-enhancing activity from a pou3-like ancestor involved in neurogenesis. (a) MO-mediated knockdown of zygotic pou5f3 paralogs results in mis-patterning of the neural plate border (pax3, zic1) and loss of neural crest (snai2, foxd3). (b) lamprey and Xenopus pou5 can rescue pou5 MO phenotypes. (c) pou3 gain-of-function causes loss of neural crest and epidermis and expands the neural plate. (d) pou5 retains an ancestral role in enhancing neurogenesis. Data were obtained from n ≥ 3 biological replicates for each construct with a minimum of n = 30 embryos per replicate. Pm = Petromyzon marinus, Xl = Xenopus laevis. Scale bar: 250 μm.
pou5 evolved neural crest-promoting activity from a pou3-like ancestor
Based on the absence of pou5 in invertebrate genomes, pou5 appears to be a vertebrate innovation, as with another pluripotency factor, ventx/nanog9. Thus, the acquisition of pou5, like ventx/nanog, coincides with the acquisition of neural crest and the evolution of vertebrates. However, the origins of pou5 in the neural crest remain unknown. To address this, we first revisited our phylogenetic analysis (Extended Data Fig. 7a). We determined that pou3 shares a common ancestor with pou5, supporting the hypothesis that pou5 likely evolved from a pou3-like ancestor as has been previously suggested52. Vertebrate pou3 paralogs are expressed in neural progenitors, and this is the case in both lamprey and Xenopus, with pou3 transcripts ultimately resolving to the neural plate (Extended Data Fig. 10). Such expression is consistent with the evolution of pou5 from a pou3-like ancestor that was involved in neurogenesis55,56—a function likely ancestral for chordates and therefore one that preceded the origin of pou5 function in the neural crest.
If pou5 evolved from a pou3-like ancestor, then pou3 factors may also be capable of enhancing neural crest formation. Alternatively, the neural crest-enhancing activities of pou5 may be an evolutionary novelty. To test these possibilities, we expressed Xenopus and lamprey pou3 in Xenopus embryos at equivalent levels. Notably, both lamprey and Xenopus pou3 inhibited—rather than promoted—snai2 and foxd3 expression (Fig. 5c). This loss of neural crest was accompanied by a lateral expansion of the neural plate as evidenced by an expanded domain of sox3 expression, a result consistent with pou3 factors promoting neurogenesis (Fig. 5c). We then asked if pou5 factors retain an ancestral ability to promote neurogenesis. Strikingly, we found that all pou5 orthologs also expanded sox3 expression in the neural plate (Fig. 5d). Both pou3 and pou5 gain of function also led to a loss of krt12.4+ epidermal progenitors (Fig. 5d). Together, these results point to a unique role for pou5 in promoting neural crest development that evolved from an ancestral pou3-like clade involved in neurogenesis. Comparison of pou3 and pou5 sequences revealed residues in the conserved pou-s and linker domains that distinguish these two groups. Specifically, there are two potential MAPK phosphorylation sites as well as a conserved sequence identified as a putative non-canonical SUMOylation site that are present in pou3 and absent from pou5 (Extended Data Fig. 11). Moreover, pou5 has an extended c-terminal domain relative to pou3 and this domain contains regions of amino acid conservation (albeit weaker in lamprey and hagfish) (Extended Data Fig. 11; Source Data File S4). Future studies will be needed to determine if any of these sequence difference contribute to distinct activities of pou5 factors and the evolution of the vertebrate neural crest.
Discussion
Understanding the origins of the neural crest and its developmental potential is essential to deciphering the evolution of vertebrates. Comparative approaches are critical to understanding this pivotal evolutionary transition, while studies in traditional models, including Xenopus, chick, zebrafish, and mouse, will continue to reveal species-specific differences that arose due to adaptation or developmental drift. In the current study we provide evidence for conservation in lamprey of the blastula pluripotency network identified in jawed vertebrates, conservation across vertebrates of a related network in the neural crest and the functional evolution of a key transcription factor in these networks, pou5.
While an assay system for determining if lamprey blastula animal pole cells display functional pluripotency does not currently exist, our study demonstrates that the factors that control pluripotency in jawed vertebrates are expressed in these cells. Through comparisons of neural crest and pluripotency GRNs across the two major clades of vertebrates we have begun to elucidate how these GRNs are developmentally and evolutionarily coupled. Our results suggest that the integration of pou5 and ventx/nanog into the progenitor network of klf17, soxB1, and myc was already fixed in the last common vertebrate ancestor (Fig. 6). Moreover, lamprey and Xenopus blastula animal pole cells also express genes classically associated with neural crest identity (tfap2a, snail, zic, foxd3, id) supporting a model wherein multiple tiers of the neural crest GRN originated in animal pole blastula cells and were also deployed to varying degrees into the neural crest of stem vertebrates. Our results also show that this neural crest-pluripotency GRN was further elaborated upon by downstream integration of novel genes and signaling pathways (e.g., wnt8, msx, gbx, soxE, endothelins) that pattern the neural plate border, initiate EMT, and control lineage diversification of neural crest fates. Taken together, we hypothesize that these events endowed cells at the neural plate border of stem vertebrates with the potential to layer new cell types onto the ancestral chordate baüplan, and that this pluripotency-neural crest GRN is what largely distinguishes the broad developmental potential of the vertebrate neural crest from the unipotent or bipotent cells of invertebrate chordates that have neural crest-like features57–59.
Fig. 6.
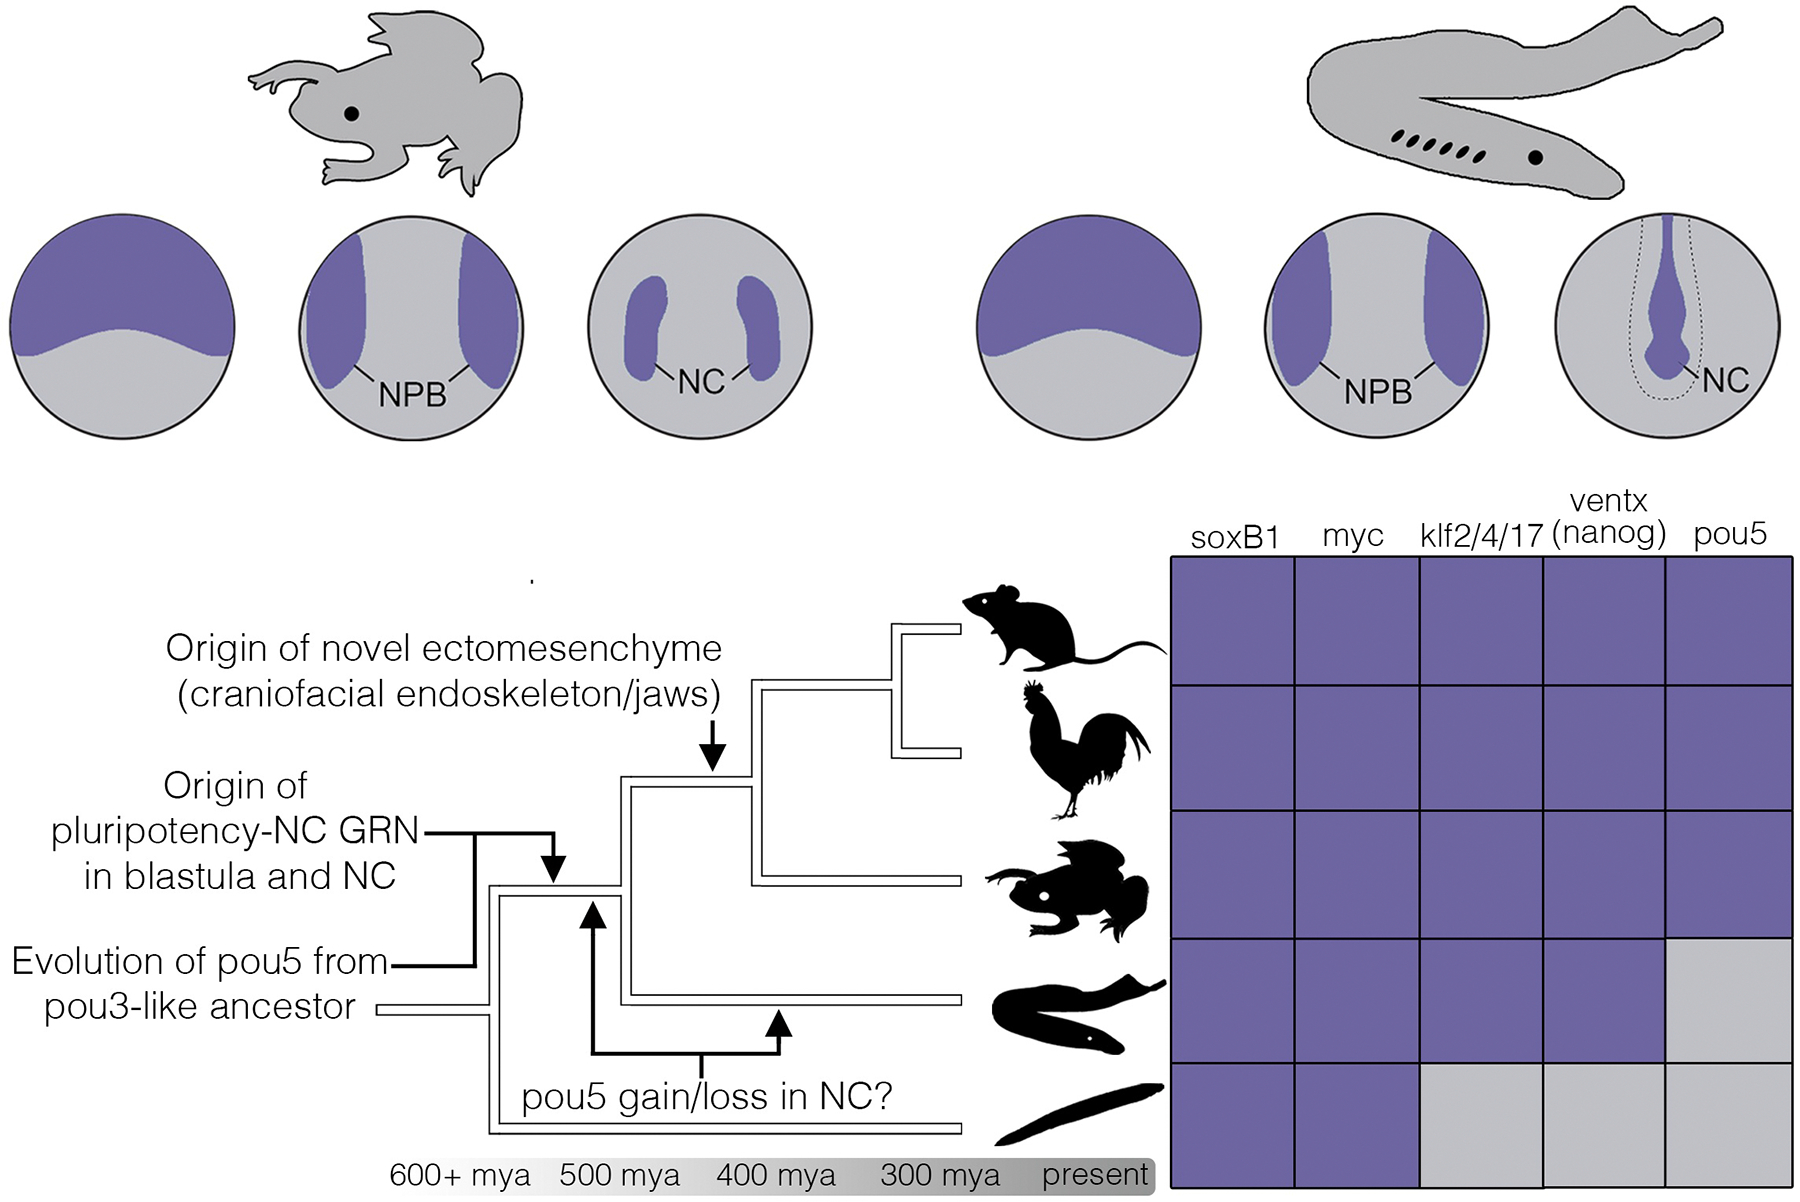
Neural crest evolution by deployment of pluripotency GRN components. Expression of canonical pluripotency factors in the neural crest is mapped onto a chordate phylogeny. Purple boxes indicate conserved expression in the neural plate border and/or neural crest; gray boxes indicate absence of expression. NPB = neural plate border; NC = neural crest. From top to bottom, chordate lineages are represented by mouse, chick, Xenopus, lamprey, and invertebrate chordates.
Historically, pou5 has been recognized as a key regulator of pluripotency in ES cells, and has also been recently implicated in controlling neural crest potential12. Here, we show that in lamprey pou5 is not expressed in the neural crest, unlike in jawed vertebrates. Lamprey neural crest cells give rise to a more limited set of derivatives and these animals lack a bony endoskeleton and jaws. It is intriguing to speculate that the broader developmental potential of the gnathostome neural crest could have been driven in part by deployment of pou5, highlighting yet another potential link between pluripotency factors in the neural crest and the origin of ectomesenchyme5,9,60. Importantly, despite being absent in the lamprey neural crest, when expressed in Xenopus lamprey pou5 can expand the pool of neural crest progenitors, whereas it is unable to do so when expressed in lamprey. This suggests that cis-regulatory evolution of pou5 binding sites—either through loss in cyclostomes or acquisition in jawed vertebrates—was a driver of pou5 expression dynamics in the neural crest, coupled with rapid rates of evolution driving novel protein-protein interactions54. Loss of pou5 in the lamprey neural crest is consistent with evolutionary divergences of pou5 expression, and that is supported here by the ability of a novelty to the vertebrate genome, lamprey pou5, to promote the formation of a cell type it is not expressed in. Leaving aside this question, however, together with previous work showing a functional role for pou5 in supporting blastula-stage pluripotency in Xenopus61,62, we hypothesize that pou5 activity helps maintain a similar progenitor state in the neural crest. Finally, we provide evidence that pou5 evolved neural crest-enhancing activity from an ancestral pou3-like factor functioning in neurogenesis, and that this neural-promoting activity has been retained in both Xenopus and lamprey pou5 and pou3. Importantly, however, only pou5 appears to have evolved potent neural crest-promoting activity. Thus, the ability of pou5 to promote neural crest development is not a general feature of pou-family proteins but rather a synapomorphy of the pou5 clade that emerged after diverging from a pou3-like ancestor (Fig. 6). Future work should functionally explore the amino acid changes that drove this novel activity.
Based on the recognition that the core pluripotency factors pou5 and ventx/nanog are vertebrate novelties9,51 we suggest that blastula-stage (i.e., somatic) pluripotency itself is likely a vertebrate innovation. Thus, although the blastula stage is an ancient feature of metazoan development, a dual pluripotency-neural crest GRN, driven by the vertebrate-specific genes pou5 and ventx/nanog is an evolutionary innovation of vertebrates. Evidence for this comes from the absence of the core pluripotency factors pou5, and ventx/nanog in invertebrate genomes, and the finding that cells of pre-blastula tunicate embryos—the sister group to vertebrates—are already restricted to a single lineage63,64. Although pou5 and ventx/nanog are not encoded in invertebrate chordate genomes 9,65,66, invertebrate chordates do express homologs of the neural stem cell factors soxB1 and myc in the blastula17. Thus the precursors of the vertebrate pluripotency GRN may have arisen in cells fated to be neural progenitor cells, perhaps explaining why the neural lineage has been found to lie closest in gene regulatory state space to pluripotent blastula cells and why several neural crest regulatory factors have been found to have deep roots in bilaterian neurogenesis4,67,68.
Methods and Materials
Embryological methods
Adult sea lamprey were collected from the Hammond Bay Biological Station, Millersburg, MI, and shipped to Northwestern University. Animals were maintained at 14 °C in a recirculating water system. Embryos were obtained by in vitro fertilization and cultured in 0.05X Marc’s Modified Ringers (MMR) in Pyrex dishes. All procedures were approved by Northwestern University’s Institutional Animal Care and Use Committee (IACUC A3283–01). Blastula-stage animal pole explants were manually dissected from lamprey embryos that were dechorionated in 1X MMR in a dish lined with 1% agarose. Animal caps were dissected manually using sharp forceps and cultured until the desired stage before harvesting for total RNA extraction. For Xenopus, controls were wildtype (epidermal) caps collected at st 13 and st 17. Alternatively, caps were induced to form neural plate border (st 13) and neural crest (st 17) by microinjection of wnt8a and chordin mRNA at the 2-cell stage. mRNA for microinjection was in vitro transcribed from a linearized DNA template using the SP6 mMessage mMachine kit (ThermoFisher AM1344). All animal cap experiments were collected for three biological replicates.
Cloning and in situ hybridization
X. laevis clones were obtained from ORFeome (www.xenbase.org/reagents/static/orfeome.jsp). Lamprey clones were obtained from previous library screens or gene synthesis (Synbio Technologies). in situ hybridization was performed as done previously (11,12). Embryos and sections were imaged on an Olympus SZX12 microscope equipped with an Olympus QColor3 camera and QCapture software.
Double labeling with HCR-FISH with immunohistochemistry
For HCR-FISH, we adopted the third generation HCRv3-FISH69 protocol. HCR-FISH probe sets targeting were custom-designed by Molecular Instruments. Immediately after HCR-FISH, lamprey embryos were rinsed in PBS-T (1x PBS, 0.1% Tween 20), blocked (PBS-T, 10% fetal bovine serum), and then rocked overnight at 4°C in anti-Pax3 primary antibody that has been previously validated in lamprey70 (DSHB #528426, 1:5). After several rinses in PBS-T, samples were incubated in goat anti-mouse IgG Alexa Fluor™ 546 secondary antibody (ThermoFisher A28182), rinsed again several times in PBS-T, and incubated with SYTOX Green nucleic acid stain (ThermoFisher S7020). Samples were mounted and imaged using a Nikon C2 confocal microscope. Co-localization was determined by examining individual optical sections of z-slices through a single-cell depth.
RNA isolation, library preparation, and sequencing
Total RNA from Xenopus and lamprey was extracted using TRIZOL reagent (ThermoFisher 15596026) and LiCl precipitation as per standard procedures. Lamprey RNA-Seq libraries were prepared using the NEBNext Ultra II Directional RNA Library Prep Kit for Illumina, along with the NEBNext Poly(A) mRNA Magnetic Isolation Module and NEBNext High-Fidelity 2X PCR Master Mix using the manufacturer’s protocol. Xenopus RNA-Seq libraries were prepared using the Illumina TruSeq Library Prep kit. Libraries were quantified by Qubit and assessed using an Agilent TapeStation. Next Generation Sequencing was performed at the NUSeq Core facility at Northwestern Medicine’s Center for Genetic Medicine. We obtained 50 million single end reads on three biological replicates for lamprey animal caps and Xenopus animal cap experiments on the Illumina NextSeq500 platform. For previously published lamprey neural crest RNA-Seq data sets (T18 neural folds, T20, T21 dorsal neural tubes), we downloaded FASTQ files from the European Nucleotide Archive (https://www.ebi.ac.uk/ena/browser/home) and processed these files in parallel with our lamprey animal cap transcriptomes as outlined below.
Processing and analysis of RNA-Seq data
RNA-Seq read quality was evaluated using FASTQC (v0.11.5). Reads were trimmed by fastp (v0.23.2) for quality and to remove Illumina adapters using default parameters. Trimmed reads were mapped to the Xenopus (Xl9.2) (https://www.xenbase.org/other/static-xenbase/ftpDatafiles.jsp) or sea lamprey germline genome assemblies (https://simrbase.stowers.org/sealamprey) using STAR (v2.6.0). Read counts were obtained using HTSeq (v1.99.2). PCA and differential expression analyses were performed in DESeq2 (v3.14) using R (v4.0.3; http://www.R-project.org/). For comparisons of transcriptomes between Xenopus and lamprey, we constructed heatmaps (‘pheatmap’ package in R) using log-transformed normalized transcript abundance values (transcripts per million, TPM) generated from RSEM (v1.2.28). This method is ideal for our comparisons as it allows for normalized transcript abundance of genes to be directly compared across species. For our comparisons, we curated from the literature a set of transcription factors, signaling pathways, and epigenetic modifiers known to be essential for pluripotency and/or neural crest development in vertebrates.
To test evolutionary conservation of transcript abundance between Xenopus and lamprey, we performed correlation analysis on the transcripts in in Fig. 3a. For genes having a single putative ortholog in both species (e.g., Xenopus foxd3 and lamprey foxD-A), we calculated the mean TPMs for each gene in each cell population for one-to-one comparisons. For paralogous groups of genes where one-to-one orthology is unclear or unknown, we performed pairwise comparisons between genes within each paralogy group. For example, the lamprey genome encodes a single snail ortholog (11), which has affinities to both snai1 and snai2, whereas Xenopus has distinct snai1 and snai2 paralogs. In such cases, for example, the mean TPMs for lamprey snail in each cell population was compared separately to both snai1 and snai2 in Xenopus. We performed separate correlation analyses (blastula, early neural crest, late neural crest) between Xenopus and lamprey, using log transformed TPMs. Visual inspection of residual plots from parametric correlation analyses revealed significant departures from normality. We therefore performed non-parametric Spearman rank correlation analyses in R (v4.0.3) using the ‘cor.test’ function (‘stats’ package). We report correlation coefficients from our analyses; effects were statistically significant where p<0.05. For k-means analysis, RNA-Seq data were analyzed using the package ‘coseq’ with the following parameters: K=2:25, transformation=“logclr”,norm=“DESeq”,meanFilterCutoff=50, model=“kmeans”, iter.max=10,seed=12345.
To test for potential batch effects from incorporating our lamprey RNA-Seq data with previously published data sets (described above), we performed PCA with two additional T21 dorsal neural tube replicates from another independent publication15. We performed the same analyses in Xenopus by incorporating an additional neurula-stage samples in which neural crest was dissected from the embryo71. The results from these analyses indicate a lack of significant batch effects (Extended Data Fig. 6).
Phylogenetic analysis and synteny of vertebrate pou5 transcription factors
Full length oct/pou-family proteins were downloaded manually from NCBI. Sequences were aligned using MAFFT (v7.490) with <--maxiterate 1000 –-globalpair>, and then trimmed using trimAl (v1.4.1). The <-automated1> option was used to heuristically determine the optimal method for trimming. The trimmed alignment file was converted to NEXUS format for phylogenetic analysis in MrBayes (v3.2.7a), or PHYLIP format for analysis in RAxML (v8). The following parameters were used in MrBayes: <prset aamodel = mixed>, <mcmc ngen = 500000>; mouse pou6f1 was specified as outgroup. The following parameters were used in RAxML: <-m PROTGAMMAAUTO>, <-p12345>, <-x 12345>, <-#1000>; mouse pou6f1 was specified as outgroup. Consensus trees were visualized using iTOL (https://itol.embl.de). NCBI accession numbers for oct/pou sequences are: Ambystoma mexicanum pou5f3 AGN30963.1; Ambystoma mexicanum pou5f1 AY542376.1; Danio rerio pou1f1 NP_998016.1; Danio rerio pou5f3 BAA05901.1; Danio rerio pou2f2 XP_009290402.1; Danio rerio pou2f3 XP_005172050.1; Danio rerio pou3f1 NP_571236.1; Danio rerio pou3f2 NP_571235.1; Danio rerio pou3f3 NP_571225.2; Danio rerio pou4f1 NP_001299795.1; Felis catus pou5f1 ACY72350.1; Gallus gallus pou5f3 ABK27428.1; Gallus gallus pou2f1 NP_990803.1; Gallus gallus pou2f3 XP_015153671.1; Gallus gallus pou3f1 NP_001026755.1; Gallus gallus pou3f2 XP_015140157.1; Gallus gallus pou3f3 XP_040518115.1; Gallus gallus pou3f4 XP_003641125.3; Gallus gallus pou4f1 XP_015132813.1; Homo sapiens pou5f1 BAC54946.1; Mus musculus pou1f1 AAH61213.1; Mus musculus pou2f1 NP_001355737.1; Mus musculus pou2f2 NP_001157028.1; Mus musculus pou2f3 NP_035269.2; Mus musculus pou3f1 NP_035271.1; Mus musculus pou3f2 NP_032925.1; Mus musculus pou3f3 NP_032926.2; Mus musculus pou3f4 NP_032927.1; Mus musculus pou4f1 NP_035273.3; Mus musculus pou4f2 NP_620394.2; Mus musculus pou5f1 NP_038661.2; Oryzias latipes pou5f3 AAT64911.1; Petromyzon marinus pou5 XP_032835430.1; Petromyzon marinus pou3f2-like XP_032828582.1; Petromyzon marinus pou2f2-like XP_032821400.1; Petromyzon marinus pou2f1 XP_032833038.1; Petromyzon marinus pou2f2 XP_032821327.1; Xenopus laevis pou5f3.1 NP_001081342.1; Xenopus laevis pou5f3.2 NP_001079832.1; Xenopus laevis pou5f3.3 NP_001081583.1; Xenopus tropicalis pou1f1 XP_031752450.1; Xenopus tropicalis pou2f1 XP_012812406.1; Xenopus tropicalis pou2f2 XP_002936445.2; Xenopus tropicalis pou2f3 XP_031762183.1; Xenopus tropicalis pou3f1 NP_001016504.1; Xenopus tropicalis pou3f2 NP_001263306.1; Xenopus tropicalis pou3f3 XP_017947125.1; Xenopus tropicalis pou3f4 NP_001090728.1; Xenopus tropicalis pou4f1 XP_002931972.1; Mus musculus pou6f1 AAH85139.1. Other sequences were obtained from previously published data sets54.
Synteny analysis was performed by comparing the coding sequences of Xenopus genes surrounding the pou5f3.1, pou5f3.2, and pou5f3.3 loci to those surrounding the pou5 locus in the germline genome assembly of lamprey. Residue analysis of pou5 versus pou3 proteins was performed by SUMOplot and GPS-SUMO (https://sumo.biocuckoo.cn), whereas MAPK phosphorylation sites were curated through manual inspection of alignments.
Overexpression of lamprey and Xenopus pou5 and pou3 mRNA in Xenopus embryos
Full-length lamprey pou5, lamprey pou3, Xenopus pou5f3.1, Xenopus pou5f3.2, Xenopus pou5f3.3, and Xenopus pou3f1 were subcloned into the pCS2 vector with a 6X N-terminal MYC tag. mRNA for microinjection was in vitro transcribed from linearized DNA templates using an SP6 mMessage mMachine SP6 kit. Injections were performed at the two- or four-cell stage with beta-galactosidase as a lineage tracer. Protein levels were matched for phenotypic comparisons as determined by Western analysis (Extended Data Fig. 8) with an anti-MYC antibody as described in (18).
pou5 morpholino experiments in Xenopus
Previously validated FITC-conjugated morpholino (MO) oligonucleotides61,62 targeting Xenopus pou5f3.1 and pou5f3.2 were injected unilaterally (~1.4 ng per MO) into one or two animal pole blastomeres at the eight-cell stage with or without MYC-tagged mRNA encoding full-length lamprey pou5, Xenopus pou5f3.1, or pou5f3.2. Embryos were sorted for unilateral incorporation of FITC. MO sequences: pou5f3.1.L = CCTATACAGCTCTTGCTCAAATC, pou5f3.1.S = GATTAAACATGATCTGTTGTCCG, pou5f3.2.L = CCAAGAGCTTGCAGTCAGATC, pou5f3.2.S = GCTGAACCCTAGAATGACCAG
Overexpression of lamprey pou5 mRNA in lamprey embryos
Lamprey embryos were injected with MYC-tagged lamprey (pou5) or Xenopus (pou5f3.1, pou5f3.2, pou5f3.3) mRNA and a FITC dextran tracer (ThermoFisher AAJ6360622) into one blastomere at the two-cell stage at the same concentration used for injections in Xenopus. In approximately 30–40% of lamprey embryos, the first cleavage prefigures the left-right axis. Therefore, embryos were sorted by unilateral FITC incorporation before processing for in situ hybridization.
Sectioning
Lamprey embryos were embedded in 4% agarose, and then sectioned on a Leica VT100S vibratome.
Extended Data
Extended Data Fig. 1.
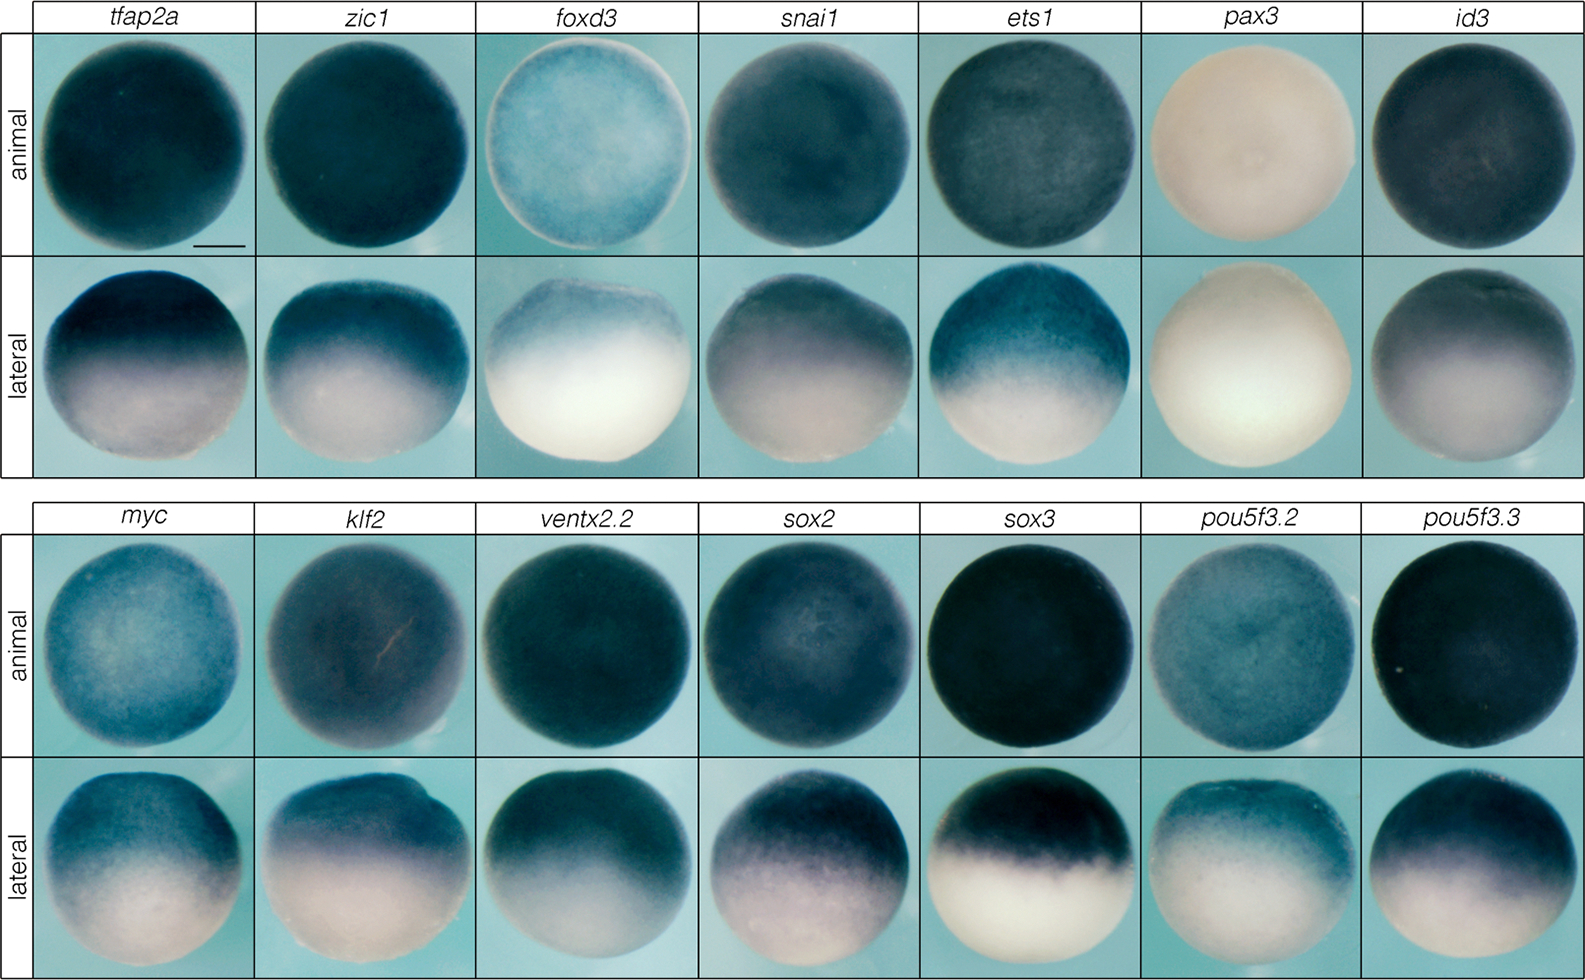
Neural crest and pluripotency factors are expressed in animal pole blastula cells in Xenopus. In situ hybridizations of neural crest (top) and pluripotency (bottom) factors in animal pole stem cells. Reproducible on n ≥ 10 embryos for n ≥ 3 experiments.
Extended Data Fig. 2.
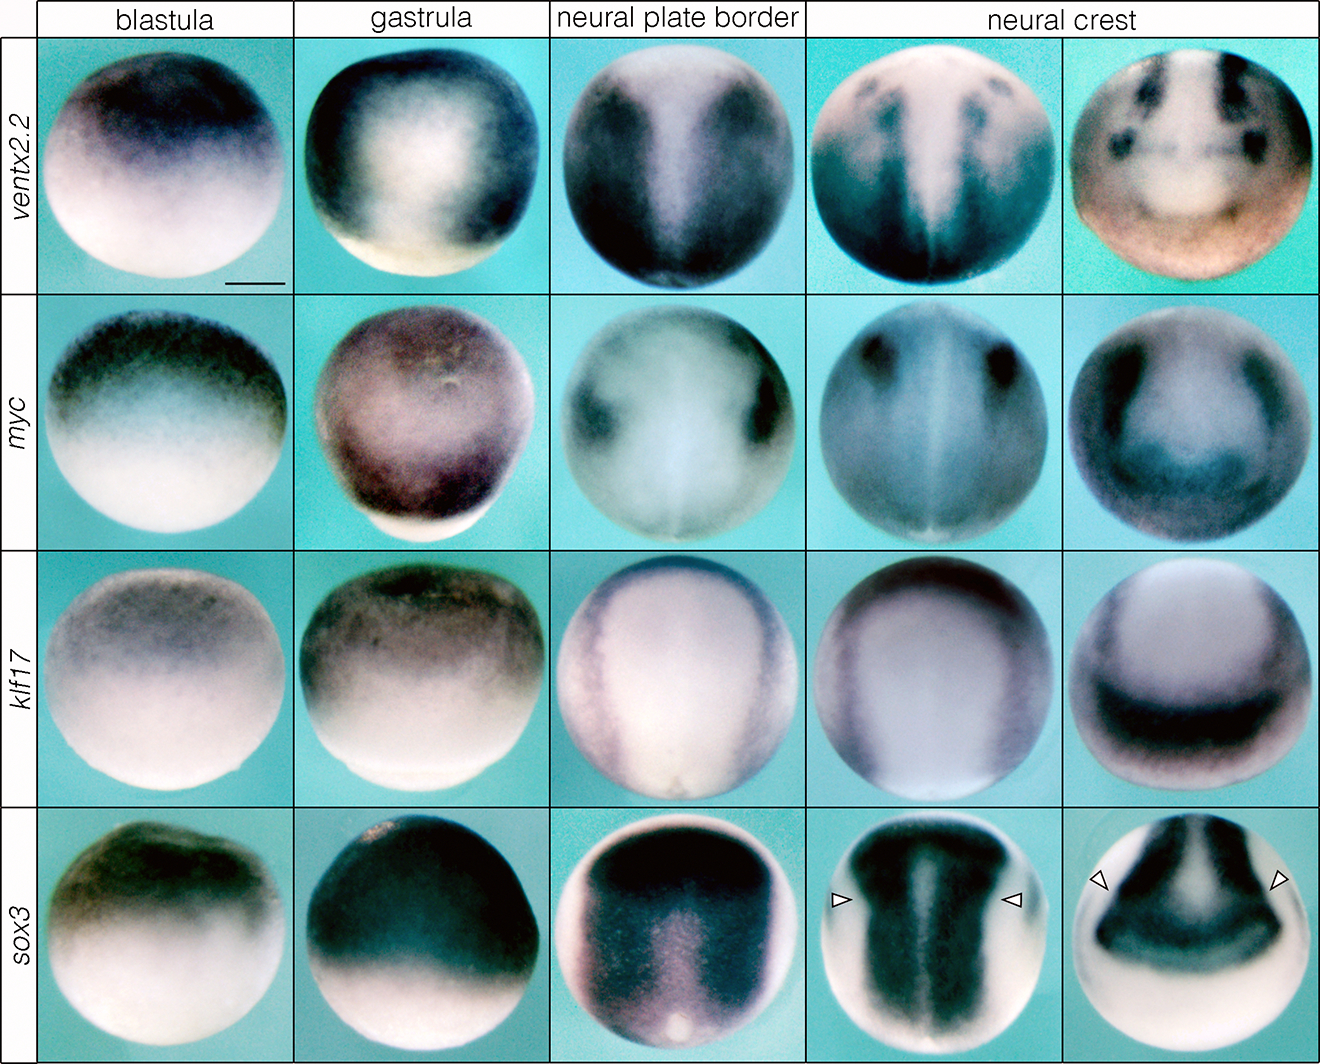
Pluripotency factors in the blastula gradually resolve to the neural plate border and neural crest in Xenopus. Arrowheads denote expression of sox3 largely excluded from the neural crest at late neurula stages. Reproducible on n ≥ 10 embryos per time point for n ≥ 3 experiments. Scale bar: 250 μm.
Extended Data Fig. 3.
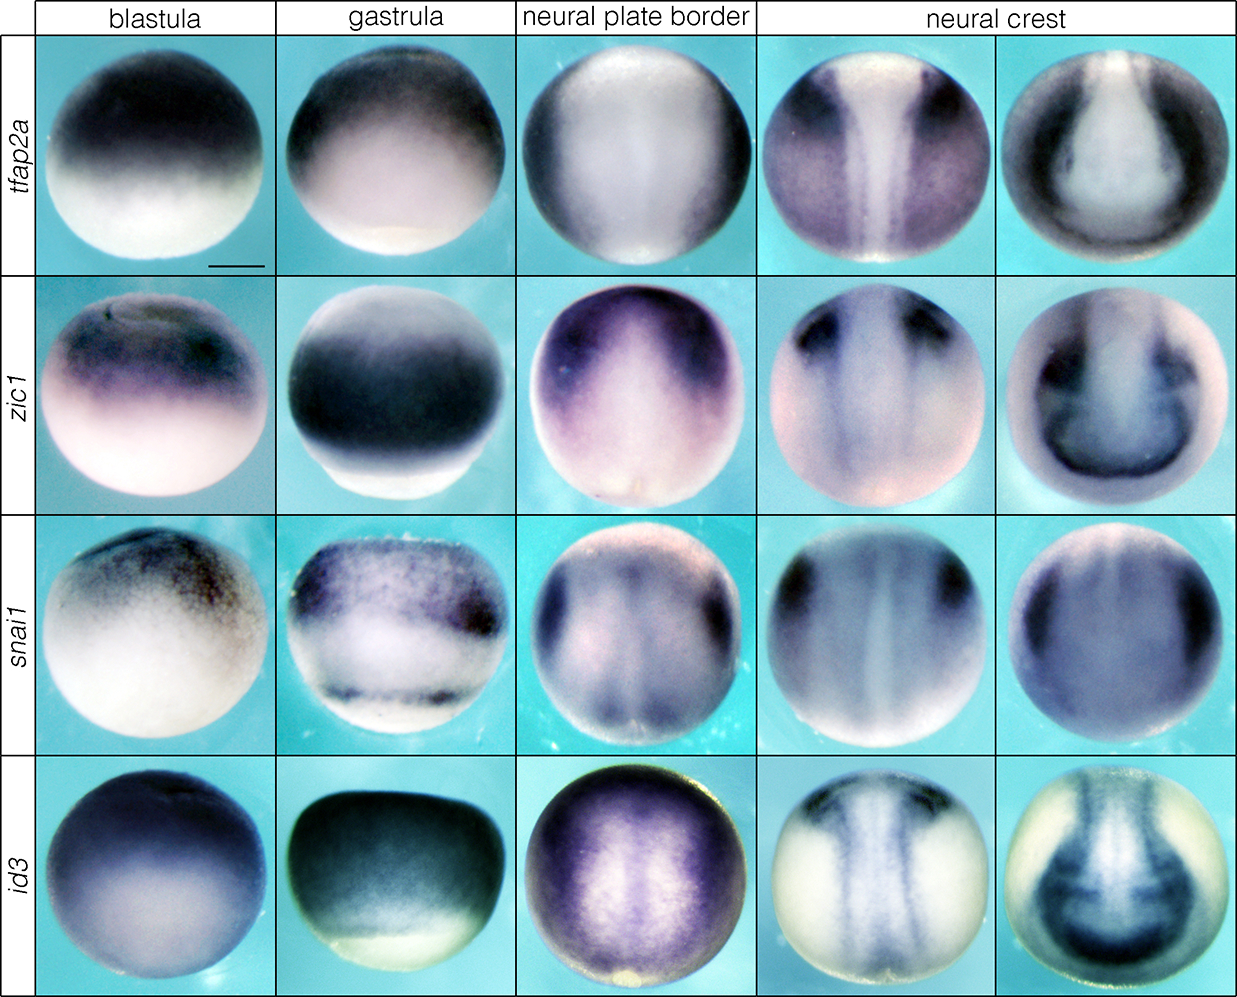
Neural crest factors in the blastula gradually resolve to the neural plate border and neural crest in Xenopus. Reproducible on n ≥ 10 embryos per time point for n ≥ 3 experiments. Scale bar: 250 μm.
Extended Data Fig. 4.

Neural crest and pluripotency factors are expressed along the antero-posterior axis in lamprey embryos. Scale bar: 250 μm.
Extended Data Fig. 5.
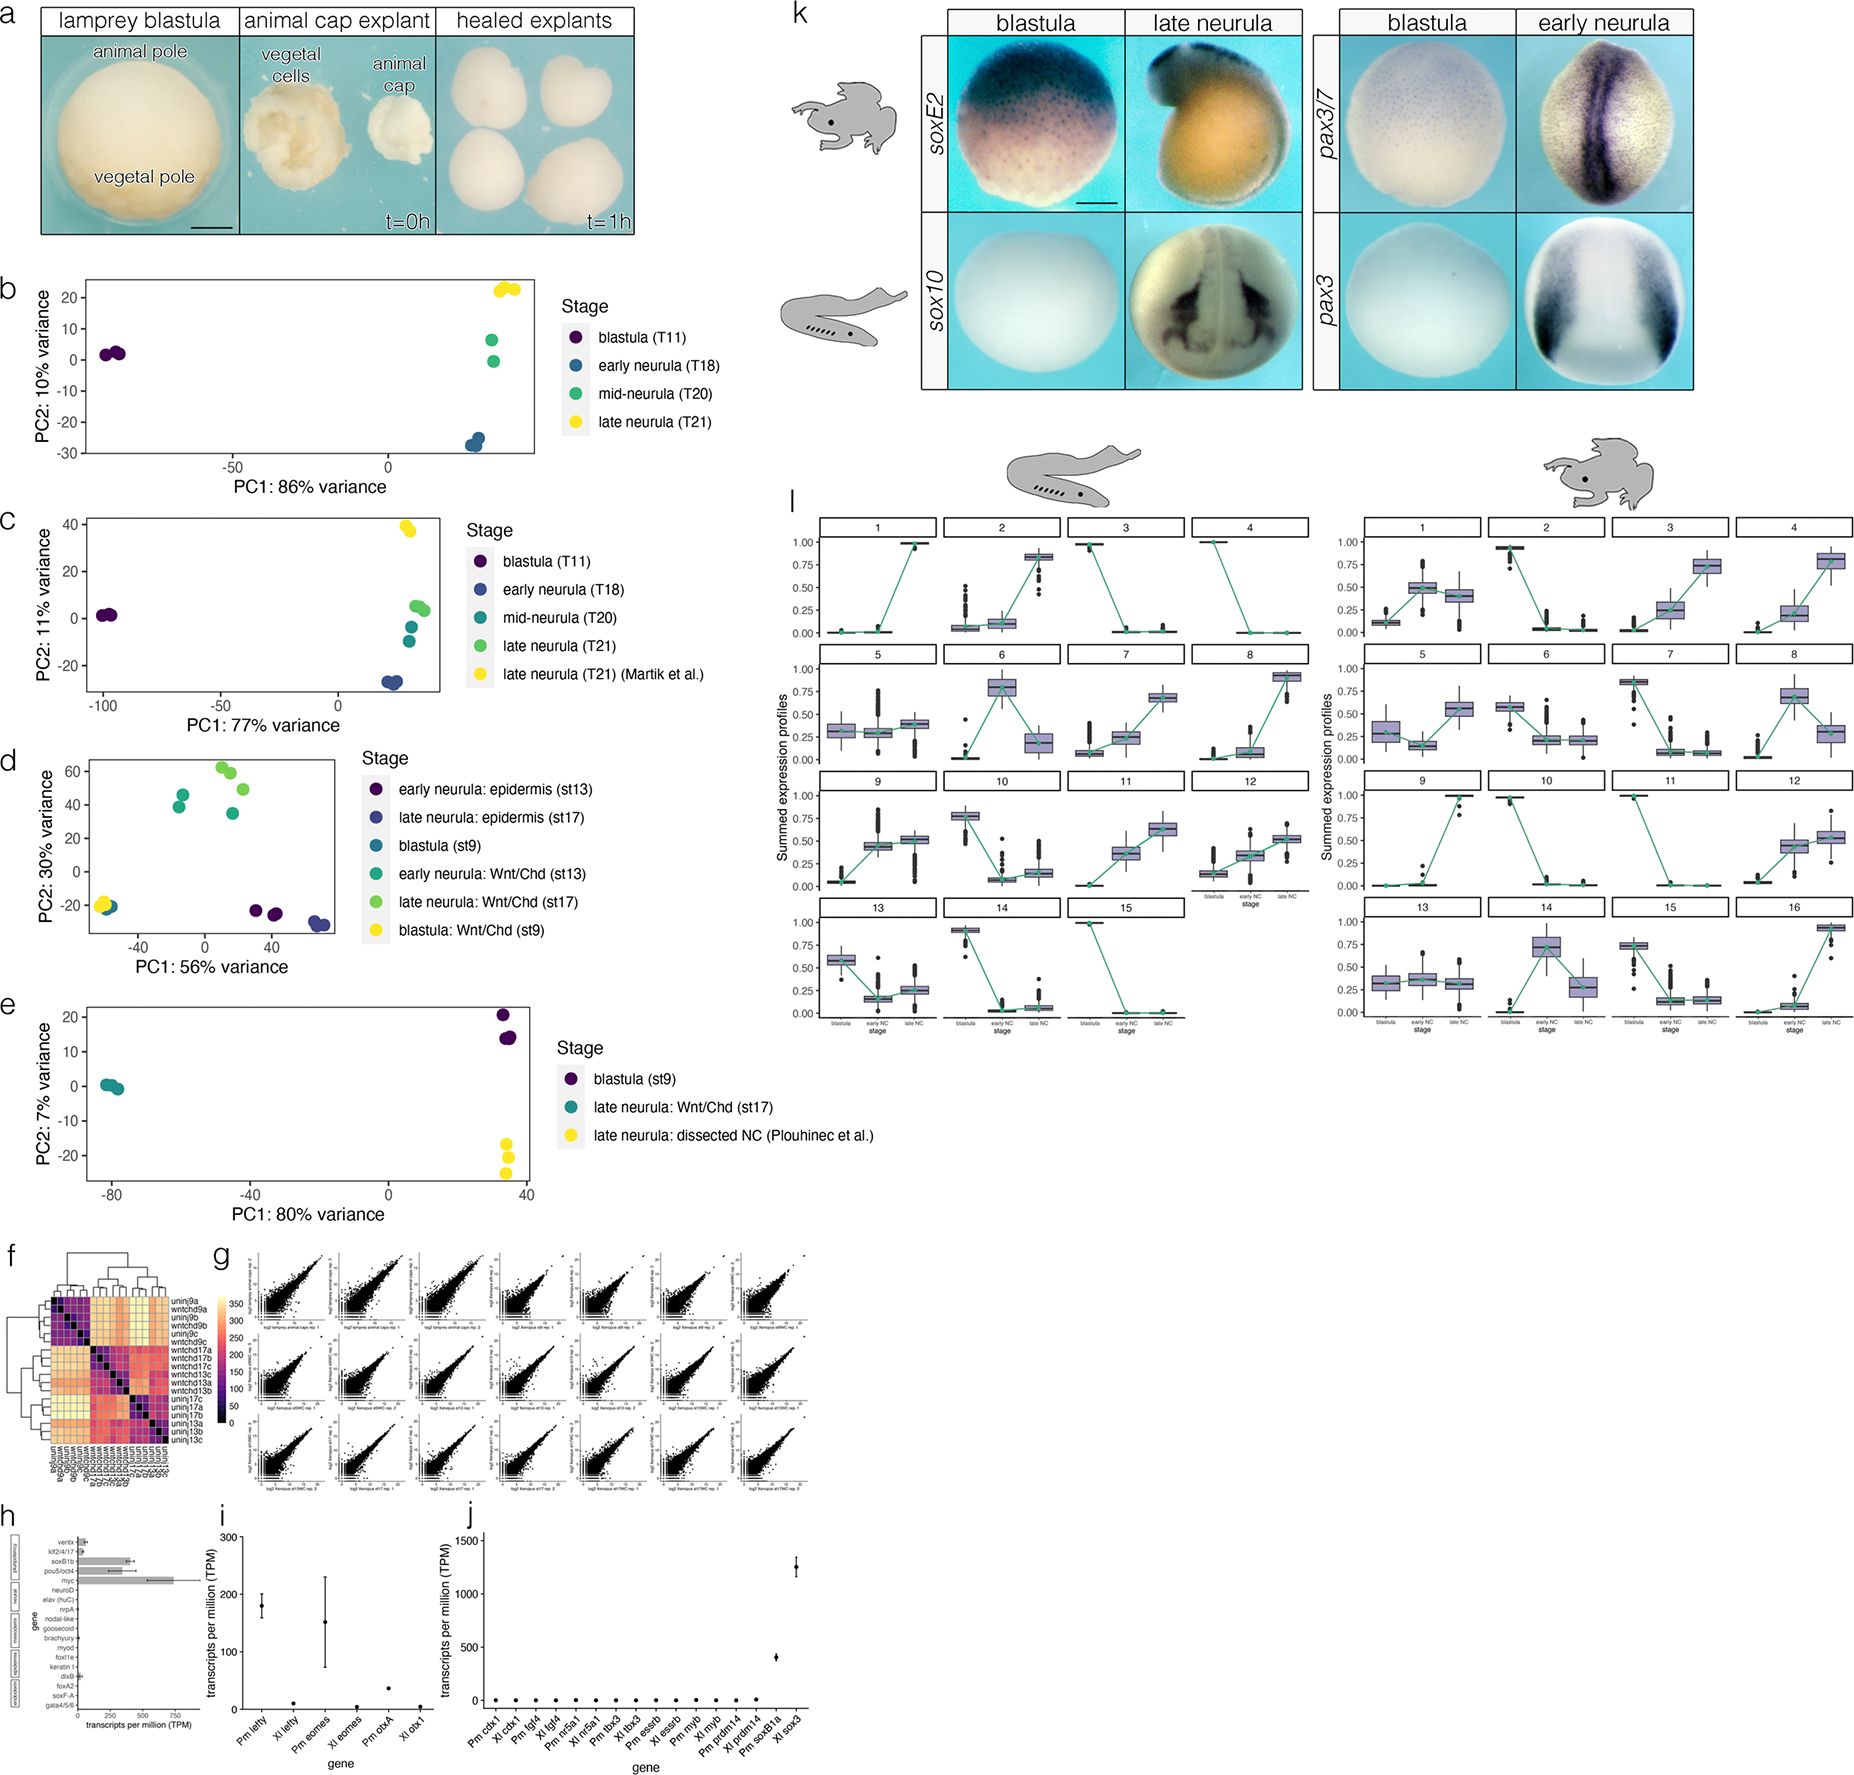
Analysis of RNA-Seq data in Xenopus and lamprey. (a) Example dissection of lamprey animal caps. (b-e) Comparisons of principal components analyses (PCA) of samples used in this study and elsewhere indicate a lack of significant batch effects. (f,g) Reproducibility of RNA-Seq data generated in this study for Xenopus. (h) Lamprey animal caps express canonical pluripotency factors but not markers of germ layer differentiation. (i) Genes involved in vertebrate pluripotency that are expressed at in blastula-stage lamprey embryos are not expressed in Xenopus embryos blastulae. (j) Several factors involved in mammalian pluripotency are absent in the animal poles of Xenopus and lamprey. Transcript abundance of soxB1 factors are included for both Xenopus (sox3) and lamprey (soxB1a) for context. Pm = Petromyzon marinus, Xl = Xenopus laevis. (k) Validation of RNA-Seq comparisons showing species-specific differences in expression of neural crest genes in the blastula. Lamprey soxE2 and pax3/7 are expressed in both animal pole cells and neural crest, whereas these factors are only enriched in the neural crest of Xenopus. (l) Full results of k-means analysis. Abbreviations: uninj9 = uninjected caps, st9; wntchd9 = wnt8a/chordin-injected caps, st9; uninj13 = uninjected caps, st13; wntchd13 = wnt8a/chordin-injected caps, st13; uninj17 = uninjected caps, st17; wntchd17 = wnt8a/chordin-injected caps, st17. Scale bars: 250 μm.
Extended Data Fig 6.
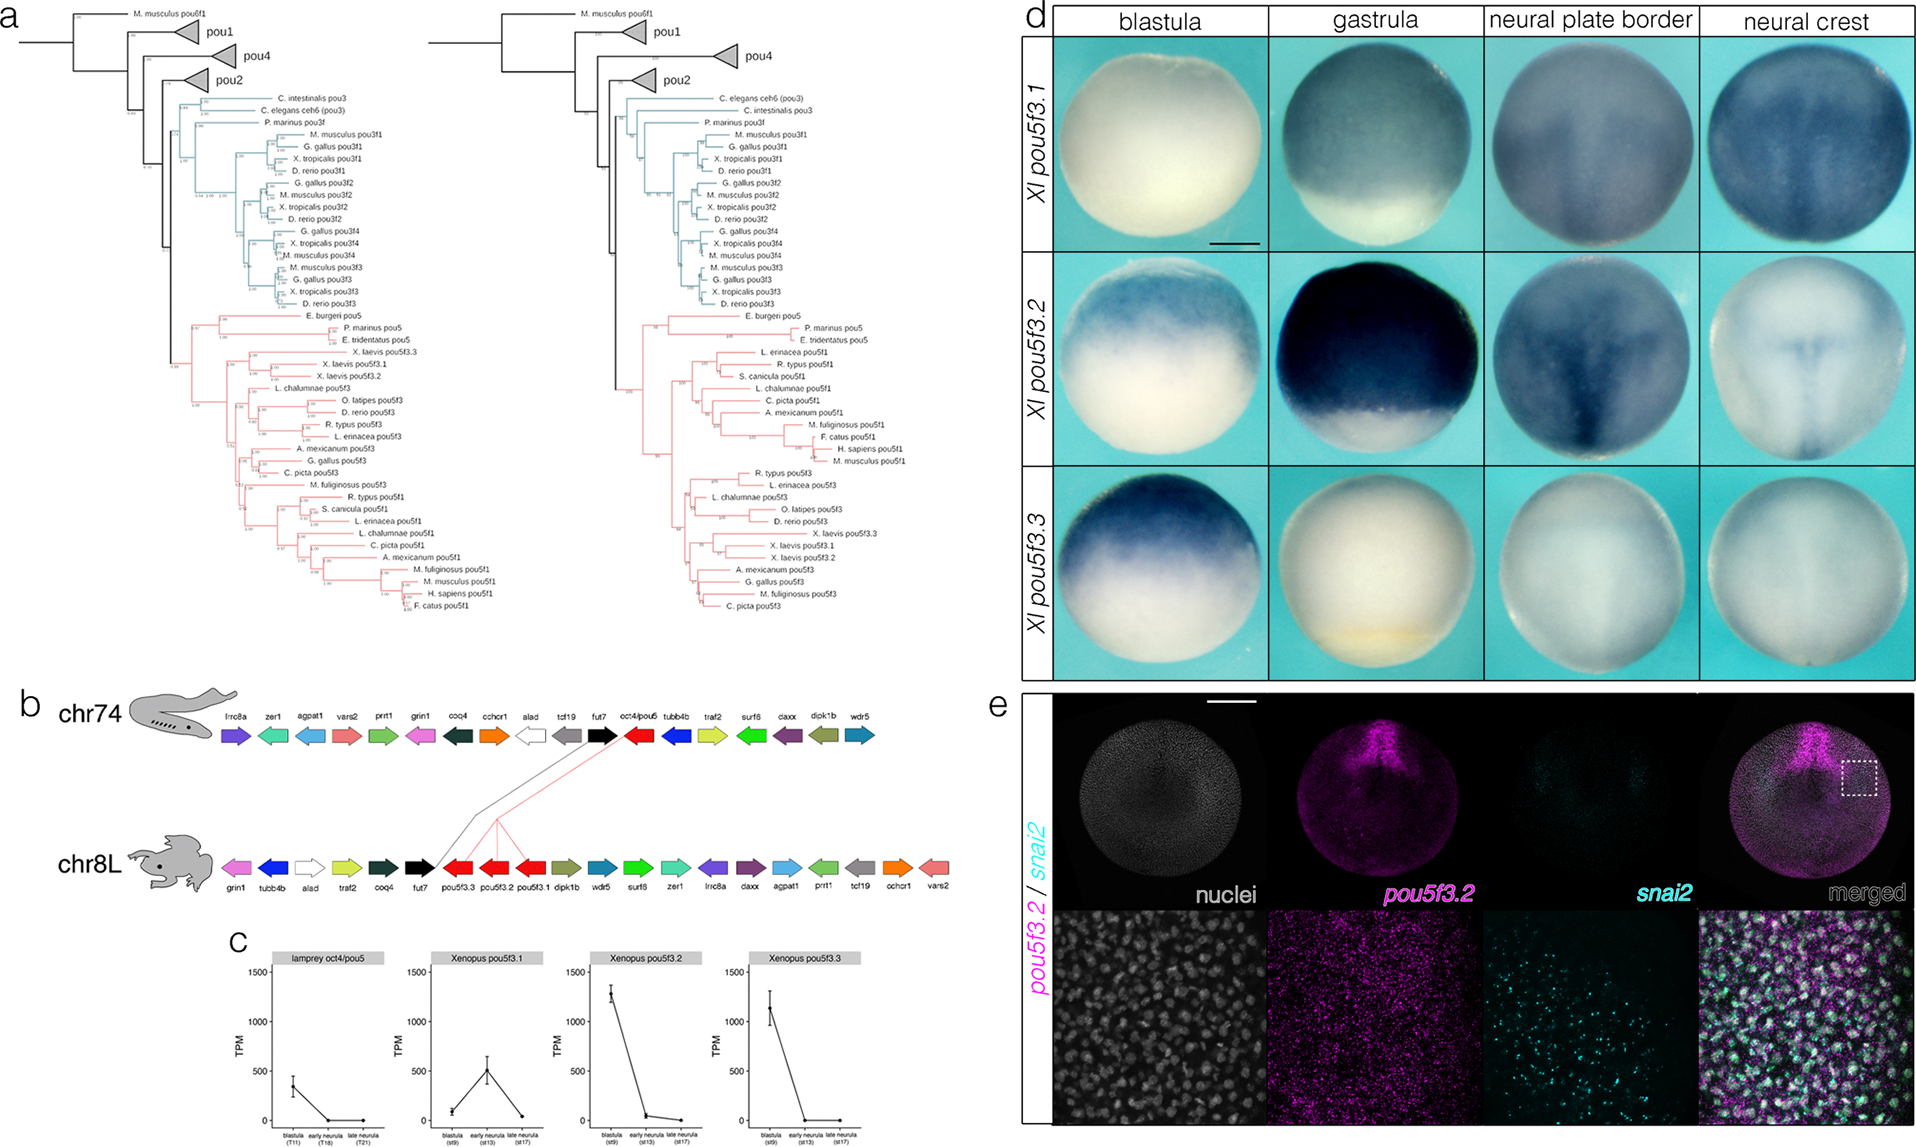
Phylogenetic analysis and characterization of lamprey pou5 and Xenopus pou5f3. (a) Bayesian (left) and Maximum likelihood (right) phylogenies of POU transcription factors. (b) Synteny comparisons of pou5 loci. (c) Quantification of transcript abundance (TPM) by RSEM for lamprey pou5 and Xenopus pou5f3 in animal pole cells and neural crest. Data were obtained from ≥100 lamprey animal caps for n = 3 biological replicates and ≥10 Xenopus animal caps at each stage for n = 3 biological replicates. (d) in situ hybridization of Xenopus pou5f3 paralogs. (e) HCR-FISH showing colocalization of pou5f3.2 with snai2 transcripts in the neural plate border. Xl, Xenopus laevis. Pm, Petromyzon marinus. Data were obtained from n = 3 biological replicates. Scale bars: 250 μm.
Extended Data Fig. 7.
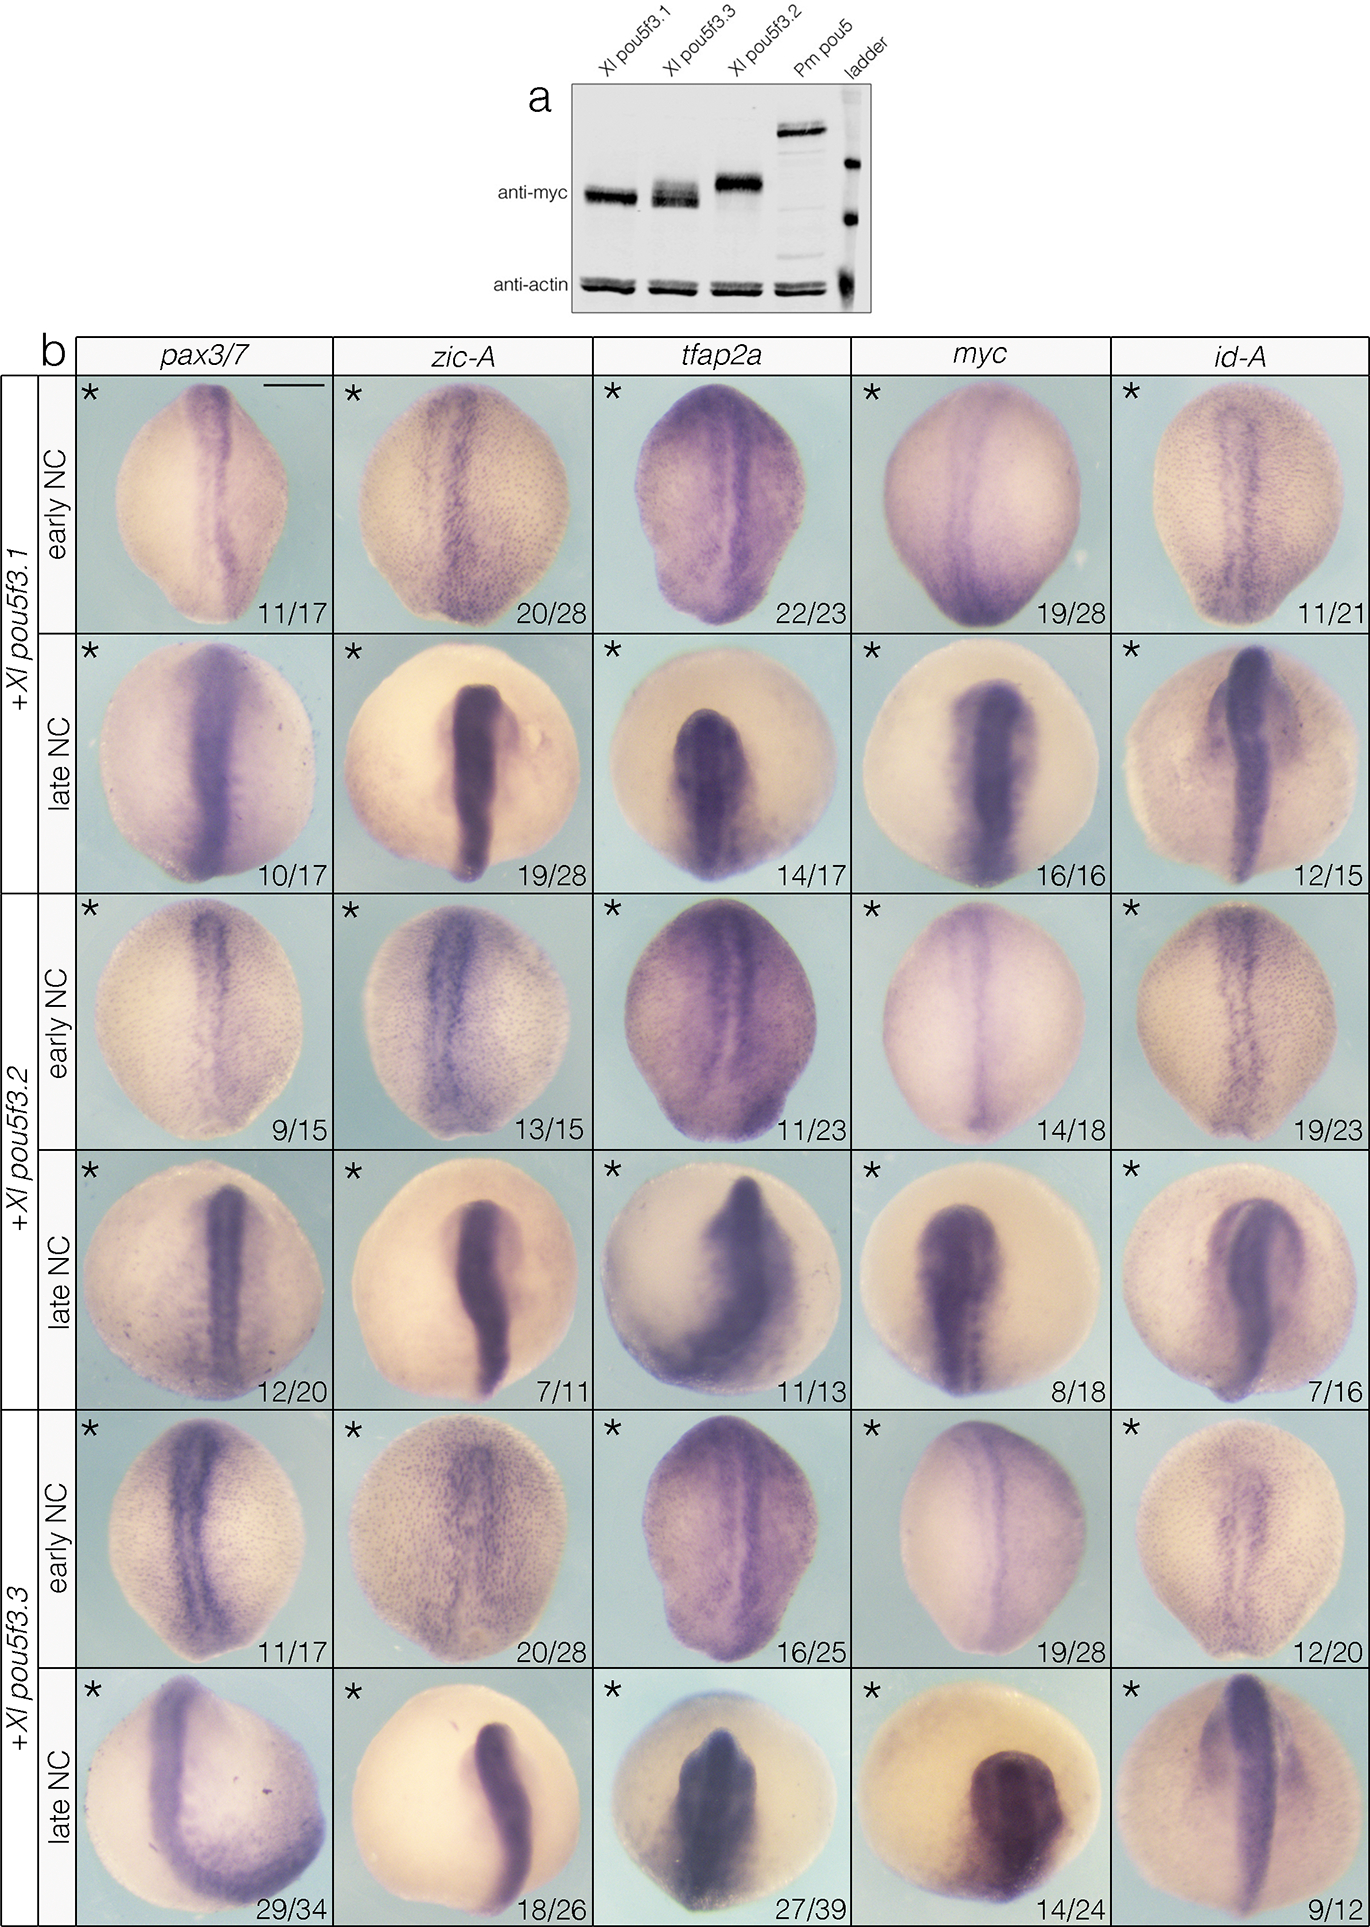
Pou5f3 overexpression experiments in lamprey embryos. (a) Western blot showing matched protein levels for experiments. (b) Overexpression of Xenopus pou5f3 factors in lamprey causes loss or no change of expression of multiple neural plate border and neural crest markers. Asterisk denotes the injected side of the embryo. Scale bar: 250 μm.
Extended Data Fig. 8.
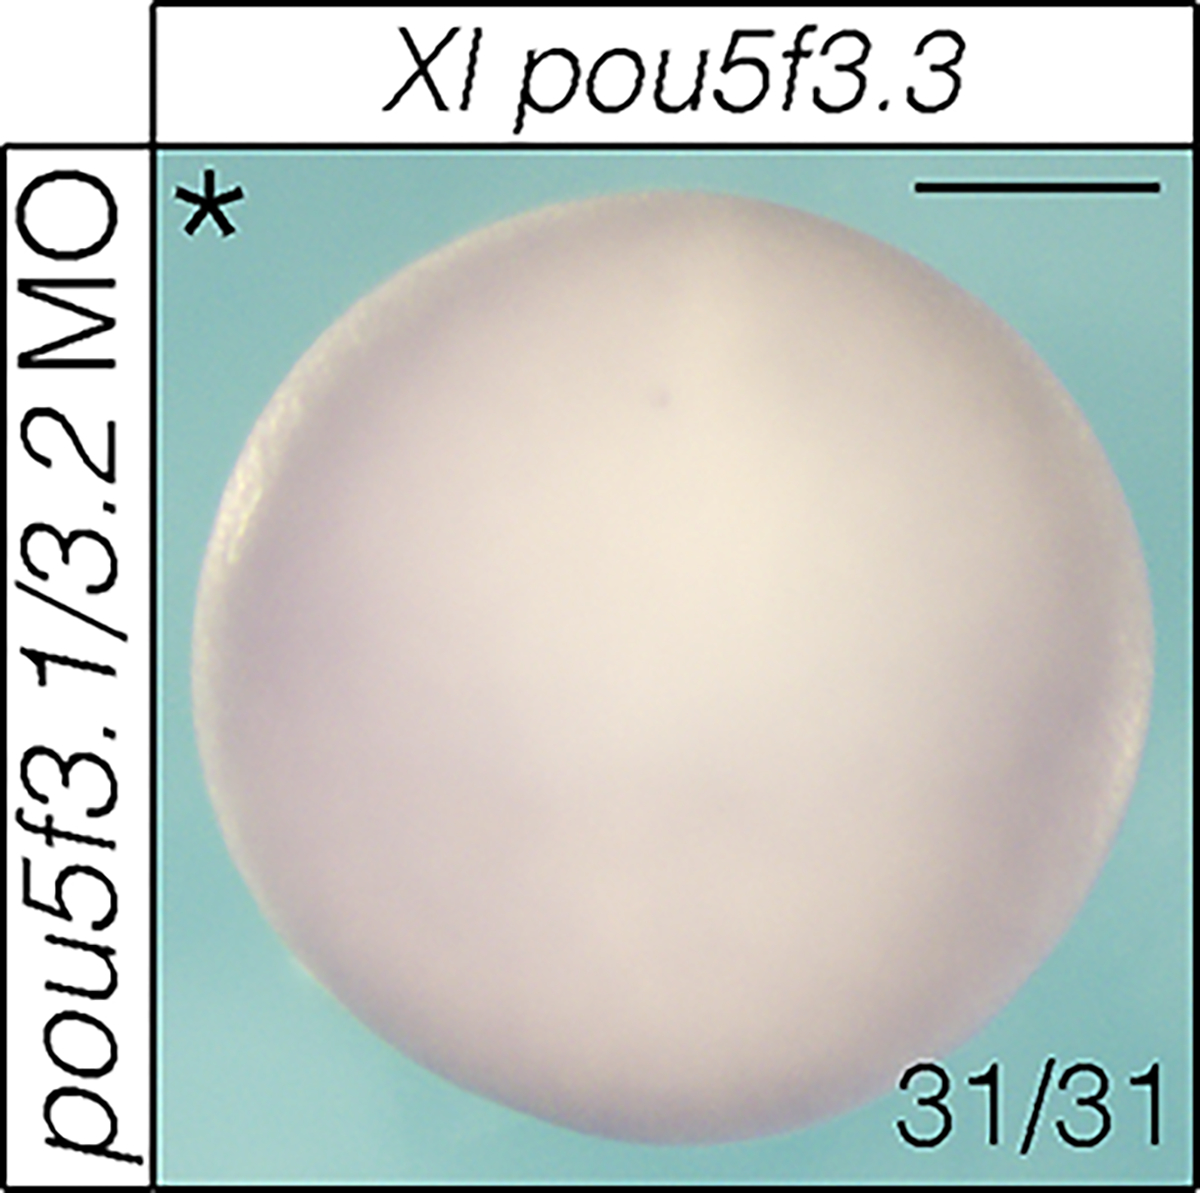
MO knockdown of Xenopus pou5f3.1 and pou5f3.2 does not result in a compensatory increase in pou5f3.3 expression. Scale bar: 250 μm.
Extended Data Fig. 9.
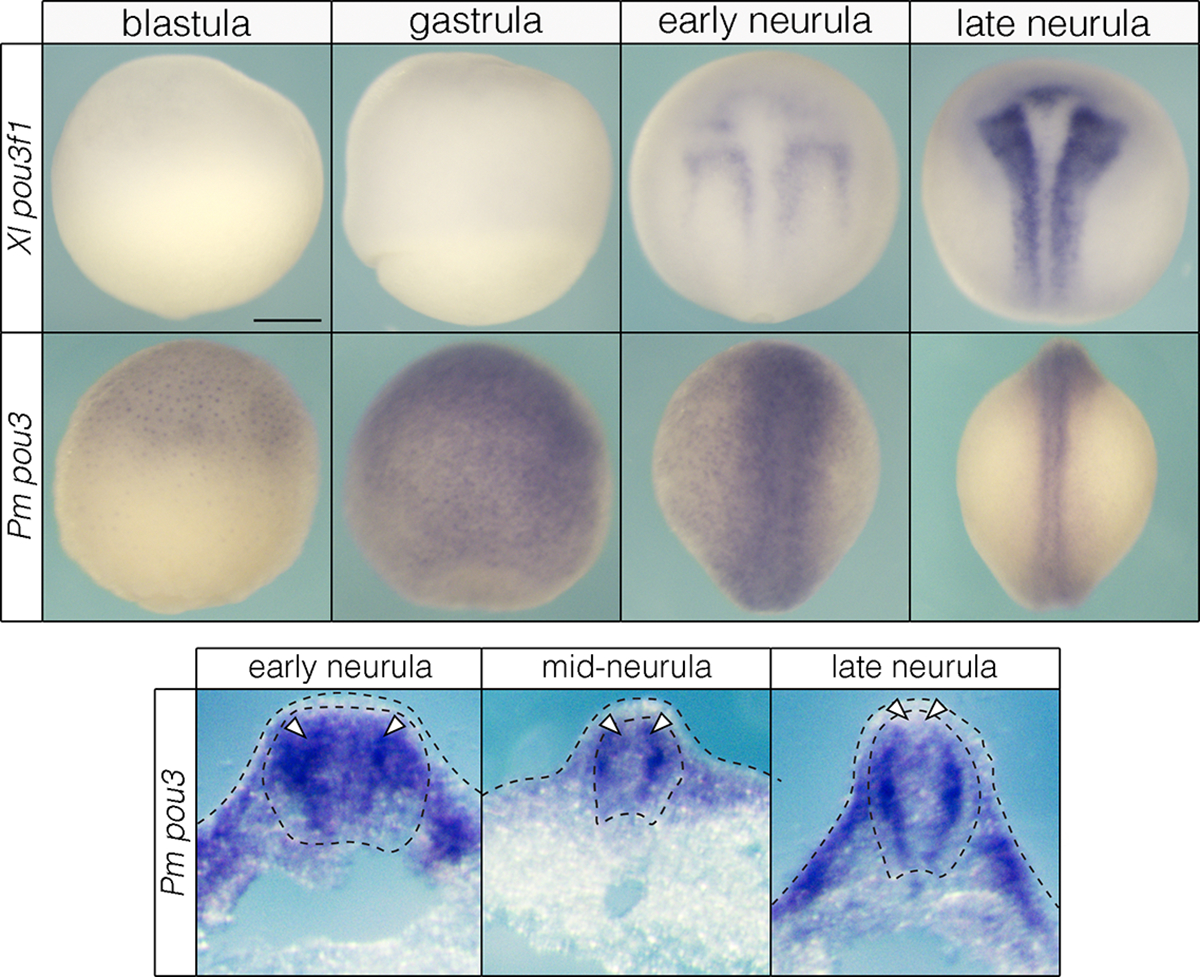
Whole mount (top) and sectioned (bottom) embryos showing wildtype pou3 expression in Xenopus (Xl) and lamprey (Pm) embryos. In lamprey, pou3 transcripts are observed in the neural crest of early and mid-neurulae (arrowheads). By late neurula stages, pou3 expression is largely absent from the neural crest (arrowheads) while being enriched in the neural tube. Scale bar: 250 μm.
Extended Data Fig. 10.
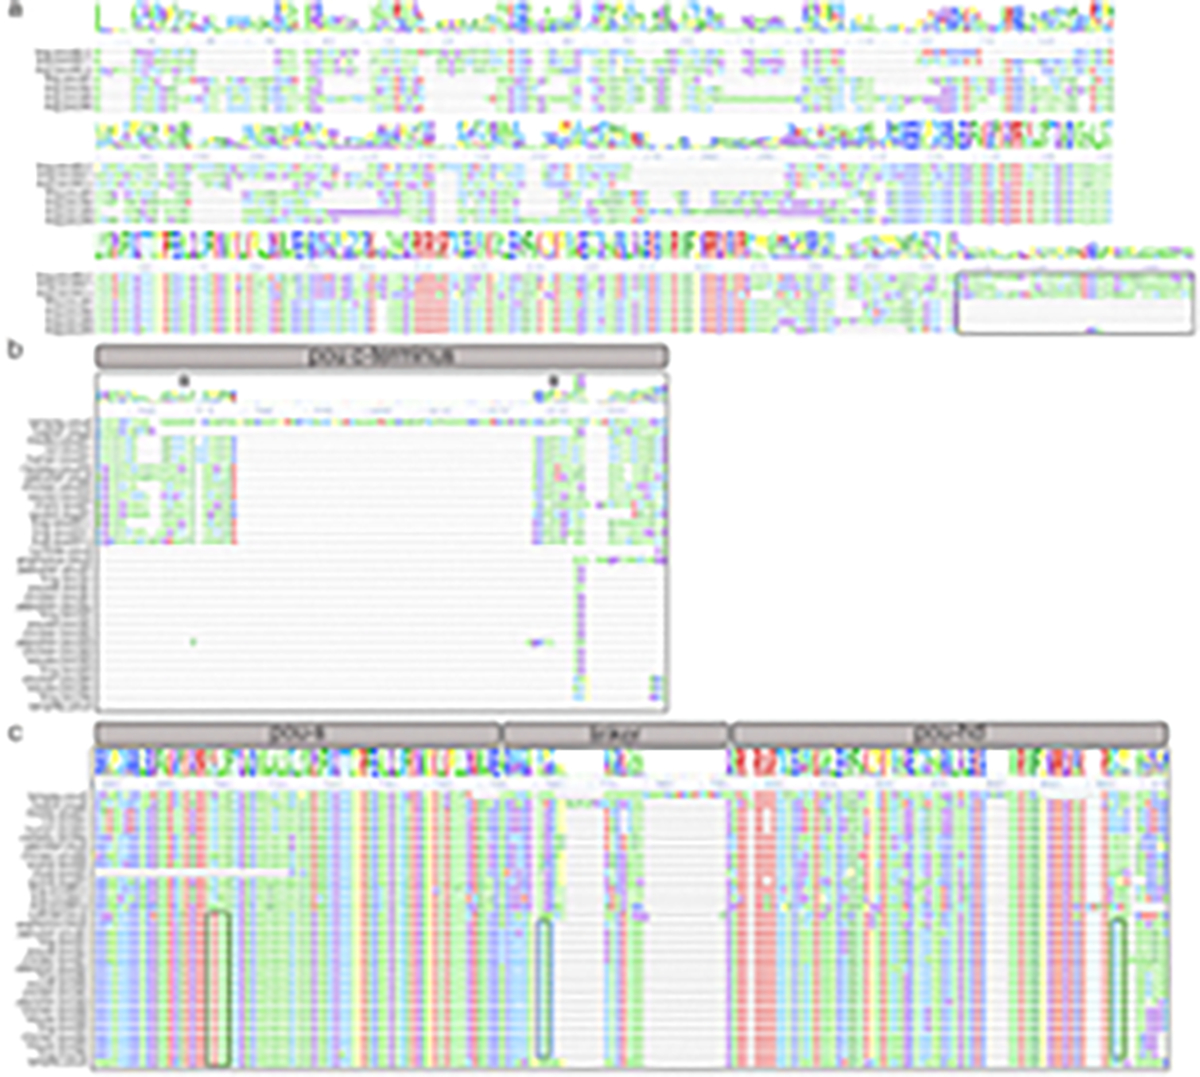
Sequence comparisons of chordate pou5 and pou3 proteins. a) Alignment of Xenopus pou5 and pou3 proteins. The box on the C-terminus shows a conserved region in the transactivation domain of pou5 that is highly conserved across most vertebrates (asterisks in b). (c) Alignment of chordate pou3 and vertebrate pou5 proteins reveals a conserved potential SUMOylation site (first box) within the pou-s domain of pou3 that is absent from pou5.There are also highly conserved residues among pou3 proteins (second and third boxes) representing potential MAPK phosphorylation sites in the linker domain and pou-hd that are also absent from pou5.
Supplementary Material
Extended Data Source File S2: spreadsheet associated with Fig. 3d containing output from DESeq2 analysis for Xenopus and lamprey.
Extended Data Source File S1: spreadsheet associated with Fig. 3b containing log transformed TPMs used for correlation analyses.
Acknowledgments:
We thank Scott Miehls and the staff of the Hammond Bay Biological Station for shipment of lampreys. We also thank David McCauley, Daniel Medeiros, Tatjana Sauka-Spengler, and Marianne Bronner for clones and reagents, Rosemary Braun for statistical advice and participants in the Woods Hole Embryology course and members of the LaBonne laboratory for helpful discussions. This paper is dedicated to the memory of Dr. Joseph Walder, founder of Integrated DNA Technologies and co-founded the Walder Foundation, which generously underwrote JY’s LSRF fellowship.
Funding:
Life Sciences Research Foundation postdoctoral fellowship (JRY)
National Institutes of Health grant R01GM116538 (CL)
National Science Foundation grant 1764421 (CL)
Simons Foundation grant SFARI 597491-RWC (CL)
National Institutes of Health grant F32DE029113 (ENS)
Footnotes
Competing interests: Authors declare that they have no competing interests.
Data and materials availability:
RNA-Seq data have been deposited at NCBI (GSE205436) All other data are available in the main text or the supplementary materials.
References
- 1.Buitrago-Delgado E, Nordin K, Rao A, Geary L & LaBonne C Shared regulatory programs suggest retention of blastula-stage potential in neural crest cells. Science 348, 1332–1335 (2015). [DOI] [PMC free article] [PubMed] [Google Scholar]
- 2.Le Douarin N & Kalcheim C The neural crest. 2nd edn, (Cambridge; New York: : Cambridge University Press, 1999). [Google Scholar]
- 3.Schock EN, York JR & LaBonne C in Semin. Cell Dev. Biol. (Elsevier; ). [DOI] [PMC free article] [PubMed] [Google Scholar]
- 4.York JR & McCauley DW The origin and evolution of neural crest cells. Open Biology 10, 190285 (2020). [DOI] [PMC free article] [PubMed] [Google Scholar]
- 5.Green SA, Simões-Costa M & Bronner M Evolution of vertebrates as viewed from the crest. Nature 520, 474–482, doi: 10.1038/nature14436 (2015). [DOI] [PMC free article] [PubMed] [Google Scholar]
- 6.Lignell A, Kerosuo L, Streichan SJ, Cai L & Bronner ME Identification of a neural crest stem cell niche by Spatial Genomic Analysis. Nature Communications 8, 1–11 (2017). [DOI] [PMC free article] [PubMed] [Google Scholar]
- 7.Nordin K & Labonne C Sox5 Is a DNA- Binding Cofactor for BMP R-Smads that Directs Target Specificity during Patterning of the Early Ectoderm. Developmental Cell 31, 374–382, doi: 10.1016/j.devcel.2014.10.003 (2014). [DOI] [PMC free article] [PubMed] [Google Scholar]
- 8.Scerbo P et al. Ventx factors function as Nanog-like guardians of developmental potential in Xenopus. PLoS One 7, e36855 (2012). [DOI] [PMC free article] [PubMed] [Google Scholar]
- 9.Scerbo P & Monsoro-Burq AH The vertebrate-specific VENTX/NANOG gene empowers neural crest with ectomesenchyme potential. Science Advances 6, eaaz1469 (2020). [DOI] [PMC free article] [PubMed] [Google Scholar]
- 10.Rao A & LaBonne C Histone deacetylase activity has an essential role in establishing and maintaining the vertebrate neural crest. Development 145, dev163386 (2018). [DOI] [PMC free article] [PubMed] [Google Scholar]
- 11.Geary L & LaBonne C FGF mediated MAPK and PI3K/Akt Signals make distinct contributions to pluripotency and the establishment of Neural Crest. Elife 7, e33845 (2018). [DOI] [PMC free article] [PubMed] [Google Scholar]
- 12.Zalc A et al. Reactivation of the pluripotency program precedes formation of the cranial neural crest. Science 371, eabb4776 (2021). [DOI] [PMC free article] [PubMed] [Google Scholar]
- 13.Pajanoja C et al. Maintenance of pluripotency-like signature in the entire ectoderm leads to neural crest stem cell potential. Nature Communications (2023). [DOI] [PMC free article] [PubMed] [Google Scholar]
- 14.Sauka-Spengler T, Meulemans DM, Jones M & Bronner-Fraser M Ancient evolutionary origin of the neural crest gene regulatory network. Developmental Cell 13, 405–420, doi: 10.1016/j.devcel.2007.08.005 (2007). [DOI] [PubMed] [Google Scholar]
- 15.Martik ML et al. Evolution of the new head by gradual acquisition of neural crest regulatory circuits. Nature 574, 675–678 (2019). [DOI] [PMC free article] [PubMed] [Google Scholar]
- 16.Takeuchi M, Takahashi M, Okabe M & Aizawa S Germ layer patterning in bichir and lamprey: an insight into its evolution in vertebrates. Developmental Biology 332, 90–102 (2009). [DOI] [PubMed] [Google Scholar]
- 17.Cattell MV, Garnett AT, Klymkowsky MW & Medeiros DM A maternally established SoxB1/SoxF axis is a conserved feature of chordate germ layer patterning. Evol. Dev. 14, 104–115 (2012). [DOI] [PubMed] [Google Scholar]
- 18.Hockman D et al. A genome-wide assessment of the ancestral neural crest gene regulatory network. Nature Communications 10, 1–15 (2019). [DOI] [PMC free article] [PubMed] [Google Scholar]
- 19.Shi G & Jin Y Role of Oct4 in maintaining and regaining stem cell pluripotency. Stem cell research & therapy 1, 1–9 (2010). [DOI] [PMC free article] [PubMed] [Google Scholar]
- 20.Thomson M et al. Pluripotency factors in embryonic stem cells regulate differentiation into germ layers. Cell 145, 875–889 (2011). [DOI] [PMC free article] [PubMed] [Google Scholar]
- 21.Radzisheuskaya A et al. A defined Oct4 level governs cell state transitions of pluripotency entry and differentiation into all embryonic lineages. Nature cell biology 15, 579–590 (2013). [DOI] [PMC free article] [PubMed] [Google Scholar]
- 22.Kim D-K, Cha Y, Ahn H-J, Kim G & Park K-S Lefty1 and lefty2 control the balance between self-renewal and pluripotent differentiation of mouse embryonic stem cells. Stem Cells Dev. 23, 457–466 (2014). [DOI] [PMC free article] [PubMed] [Google Scholar]
- 23.Tosic J et al. Eomes and Brachyury control pluripotency exit and germ-layer segregation by changing the chromatin state. Nature Cell Biology 21, 1518–1531 (2019). [DOI] [PubMed] [Google Scholar]
- 24.Acampora D, Di Giovannantonio LG & Simeone A Otx2 is an intrinsic determinant of the embryonic stem cell state and is required for transition to a stable epiblast stem cell condition. Development 140, 43–55 (2013). [DOI] [PubMed] [Google Scholar]
- 25.Ivanova N et al. Dissecting self-renewal in stem cells with RNA interference. Nature 442, 533–538 (2006). [DOI] [PubMed] [Google Scholar]
- 26.Zhang X, Zhang J, Wang T, Esteban MA & Pei D Esrrb activates Oct4 transcription and sustains self-renewal and pluripotency in embryonic stem cells. Journal of Biological Chemistry 283, 35825–35833 (2008). [DOI] [PubMed] [Google Scholar]
- 27.Guo G & Smith A A genome-wide screen in EpiSCs identifies Nr5a nuclear receptors as potent inducers of ground state pluripotency. Development 137, 3185–3192 (2010). [DOI] [PMC free article] [PubMed] [Google Scholar]
- 28.Gassler J et al. Zygotic genome activation by the totipotency pioneer factor Nr5a2. Science, eabn7478 (2022). [DOI] [PubMed] [Google Scholar]
- 29.Blij S, Parenti A, Tabatabai-Yazdi N & Ralston A Cdx2 efficiently induces trophoblast stem-like cells in naïve, but not primed, pluripotent stem cells. Stem Cells Dev. 24, 1352–1365 (2015). [DOI] [PMC free article] [PubMed] [Google Scholar]
- 30.Rousso SZ et al. Negative autoregulation of Oct3/4 through Cdx1 promotes the onset of gastrulation. Developmental Dynamics 240, 796–807 (2011). [DOI] [PubMed] [Google Scholar]
- 31.Han J et al. Tbx3 improves the germ-line competency of induced pluripotent stem cells. Nature 463, 1096–1100 (2010). [DOI] [PMC free article] [PubMed] [Google Scholar]
- 32.Russell R et al. A dynamic role of TBX3 in the pluripotency circuitry. Stem Cell Reports 5, 1155–1170 (2015). [DOI] [PMC free article] [PubMed] [Google Scholar]
- 33.Tanaka Y, Patestos NP, Maekawa T & Ishii S B-myb is required for inner cell mass formation at an early stage of development. Journal of Biological Chemistry 274, 28067–28070 (1999). [DOI] [PubMed] [Google Scholar]
- 34.Fernandez-Tresguerres B et al. Evolution of the mammalian embryonic pluripotency gene regulatory network. Proceedings of the National Academy of Sciences 107, 19955–19960 (2010). [DOI] [PMC free article] [PubMed] [Google Scholar]
- 35.Tanaka S, Kunath T, Hadjantonakis A-K, Nagy A & Rossant J Promotion of trophoblast stem cell proliferation by FGF4. Science 282, 2072–2075 (1998). [DOI] [PubMed] [Google Scholar]
- 36.Yamaji M et al. PRDM14 ensures naive pluripotency through dual regulation of signaling and epigenetic pathways in mouse embryonic stem cells. Cell Stem Cell 12, 368–382 (2013). [DOI] [PubMed] [Google Scholar]
- 37.Grabole N et al. Prdm14 promotes germline fate and naive pluripotency by repressing FGF signalling and DNA methylation. EMBO Reports 14, 629–637 (2013). [DOI] [PMC free article] [PubMed] [Google Scholar]
- 38.Buitrago-Delgado E, Schock EN, Nordin K & LaBonne C A transition from SoxB1 to SoxE transcription factors is essential for progression from pluripotent blastula cells to neural crest cells. Developmental Biology 444, 50–61 (2018). [DOI] [PMC free article] [PubMed] [Google Scholar]
- 39.Monsoro-Burq A-H, Wang E & Harland R Msx1 and Pax3 Cooperate to Mediate FGF8 and WNT Signals during Xenopus Neural Crest Induction. Developmental Cell 8, 167–178, doi: 10.1016/j.devcel.2004.12.017 (2005). [DOI] [PubMed] [Google Scholar]
- 40.Li B, Kuriyama S, Moreno M & Mayor R The posteriorizing gene Gbx2 is a direct target of Wnt signalling and the earliest factor in neural crest induction. Development 136, 3267–3278 (2009). [DOI] [PMC free article] [PubMed] [Google Scholar]
- 41.LaBonne C & Bronner-Fraser M Neural crest induction in Xenopus: evidence for a two-signal model. Development 125, 2403–2414 (1998). [DOI] [PubMed] [Google Scholar]
- 42.Lander R et al. Interactions between Twist and other core epithelial–mesenchymal transition factors are controlled by GSK3-mediated phosphorylation. Nature communications 4, 1–11 (2013). [DOI] [PMC free article] [PubMed] [Google Scholar]
- 43.Mancilla A & Mayor R Neural crest formation in Xenopus laevis: mechanisms of Xslug induction. Developmental Biology 177, 580–589 (1996). [DOI] [PubMed] [Google Scholar]
- 44.Rogers CD, Saxena A & Bronner ME Sip1 mediates an E-cadherin-to-N-cadherin switch during cranial neural crest EMT. Journal of Cell Biology 203, 835–847 (2013). [DOI] [PMC free article] [PubMed] [Google Scholar]
- 45.LaBonne C & Bronner-Fraser M Snail-related transcriptional repressors are required in Xenopus for both the induction of the neural crest and its subsequent migration. Developmental Biology 221, 195–205 (2000). [DOI] [PubMed] [Google Scholar]
- 46.Square TA et al. Evolution of the endothelin pathway drove neural crest cell diversification. Nature 585, 563–568 (2020). [DOI] [PubMed] [Google Scholar]
- 47.Haldin CE & LaBonne C SoxE factors as multifunctional neural crest regulatory factors. The international journal of biochemistry & cell biology 42, 441–444 (2010). [DOI] [PMC free article] [PubMed] [Google Scholar]
- 48.Tapia N et al. Reprogramming to pluripotency is an ancient trait of vertebrate Oct4 and Pou2 proteins. Nature communications 3, 1–12 (2012). [DOI] [PMC free article] [PubMed] [Google Scholar]
- 49.Nichols J et al. Formation of pluripotent stem cells in the mammalian embryo depends on the POU transcription factor Oct4. Cell 95, 379–391 (1998). [DOI] [PubMed] [Google Scholar]
- 50.Niwa H, Miyazaki J. i. & Smith AG Quantitative expression of Oct-3/4 defines differentiation, dedifferentiation or self-renewal of ES cells. Nature genetics 24, 372–376 (2000). [DOI] [PubMed] [Google Scholar]
- 51.Onichtchouk D Evolution and functions of Oct4 homologs in non-mammalian vertebrates. Biochimica et Biophysica Acta (BBA)-Gene Regulatory Mechanisms 1859, 770–779 (2016). [DOI] [PubMed] [Google Scholar]
- 52.Gold DA, Gates RD & Jacobs DK The early expansion and evolutionary dynamics of POU class genes. Molecular Biology and Evolution 31, 3136–3147 (2014). [DOI] [PMC free article] [PubMed] [Google Scholar]
- 53.Bakhmet EI & Tomilin AN The functional diversity of the POUV-class proteins across vertebrates. Open Biology 12, 220065 (2022). [DOI] [PMC free article] [PubMed] [Google Scholar]
- 54.Sukparangsi W et al. Evolutionary Origin of Vertebrate OCT4/POU5 Functions in Supporting Pluripotency. Nature Communications 5537 (2022) (2022). [DOI] [PMC free article] [PubMed] [Google Scholar]
- 55.Zhu Q et al. The transcription factor Pou3f1 promotes neural fate commitment via activation of neural lineage genes and inhibition of external signaling pathways. Elife 3, e02224 (2014). [DOI] [PMC free article] [PubMed] [Google Scholar]
- 56.Cosse-Etchepare C et al. Pou3f transcription factor expression during embryonic development highlights distinct pou3f3 and pou3f4 localization in the Xenopus laevis kidney. International Journal of Developmental Biology 62, 325–333 (2018). [DOI] [PubMed] [Google Scholar]
- 57.Stolfi A, Ryan K, Meinertzhagen IA & Christiaen L Migratory neuronal progenitors arise from the neural plate borders in tunicates. Nature 527, 371, doi: 10.1038/nature15758 (2015). [DOI] [PMC free article] [PubMed] [Google Scholar]
- 58.Abitua PB, Wagner E, Navarrete IA & Levine M Identification of a rudimentary neural crest in a non-vertebrate chordate. Nature 492, 104–107, doi: 10.1038/nature11589 (2012). [DOI] [PMC free article] [PubMed] [Google Scholar]
- 59.Jeffery WR, Strickler AG & Yamamoto Y Migratory neural crest- like cells form body pigmentation in a urochordate embryo. Nature 431, 696–699 (2004). [DOI] [PubMed] [Google Scholar]
- 60.Smith JJ et al. The sea lamprey germline genome provides insights into programmed genome rearrangement and vertebrate evolution. Nature Genetics 50, 270–277 (2018). [DOI] [PMC free article] [PubMed] [Google Scholar]
- 61.Morrison GM & Brickman JM Conserved roles for Oct4 homologues in maintaining multipotency during early vertebrate development. Development (2006). [DOI] [PubMed] [Google Scholar]
- 62.Livigni A et al. A conserved Oct4/POUV-dependent network links adhesion and migration to progenitor maintenance. Current Biology 23, 2233–2244 (2013). [DOI] [PMC free article] [PubMed] [Google Scholar]
- 63.Satou Y A gene regulatory network for cell fate specification in Ciona embryos. Current Topics in Developmental Biology 139, 1–33 (2020). [DOI] [PubMed] [Google Scholar]
- 64.Lemaire P Unfolding a chordate developmental program, one cell at a time: invariant cell lineages, short-range inductions and evolutionary plasticity in ascidians. Developmental Biology 332, 48–60 (2009). [DOI] [PubMed] [Google Scholar]
- 65.Frankenberg S & Renfree MB On the origin of POU5F1. BMC biology 11, 1–12 (2013). [DOI] [PMC free article] [PubMed] [Google Scholar]
- 66.Vanni V et al. Yamanaka Factors in the budding tunicate Botryllus schlosseri show a shared spatio-temporal expression pattern in chordates. Frontiers in Cell and Developmental Biology, 394. [DOI] [PMC free article] [PubMed] [Google Scholar]
- 67.Johnson K, Freedman S, Braun R & LaBonne C Quantitative analysis of transcriptome dynamics provides novel insights into developmental state transitions. BMC genomics 23, 723 (2022). [DOI] [PMC free article] [PubMed] [Google Scholar]
- 68.York JR, Zehnder K, Yuan T, Lakiza O & McCauley DW Evolution of Snail-mediated regulation of neural crest and placodes from an ancient role in bilaterian neurogenesis. Developmental Biology 453, 180–190 (2019). [DOI] [PubMed] [Google Scholar]
- 69.Choi HM et al. Third-generation in situ hybridization chain reaction: multiplexed, quantitative, sensitive, versatile, robust. Development 145, dev165753 (2018). [DOI] [PMC free article] [PubMed] [Google Scholar]
- 70.Migocka-Patrzałek M et al. Unique Features of River Lamprey (Lampetra fluviatilis) Myogenesis. International Journal of Molecular Sciences 23, 8595 (2022). [DOI] [PMC free article] [PubMed] [Google Scholar]
- 71.Plouhinec J-L et al. A molecular atlas of the developing ectoderm defines neural, neural crest, placode, and nonneural progenitor identity in vertebrates. PLoS Biology 15, e2004045 (2017). [DOI] [PMC free article] [PubMed] [Google Scholar]
Associated Data
This section collects any data citations, data availability statements, or supplementary materials included in this article.
Supplementary Materials
Extended Data Source File S2: spreadsheet associated with Fig. 3d containing output from DESeq2 analysis for Xenopus and lamprey.
Extended Data Source File S1: spreadsheet associated with Fig. 3b containing log transformed TPMs used for correlation analyses.
Data Availability Statement
RNA-Seq data have been deposited at NCBI (GSE205436) All other data are available in the main text or the supplementary materials.


