

Abstract
Stable iron isotope techniques are critical for developing strategies to combat iron deficiency anemia, a leading cause of global disability. There are four primary stable iron isotope methods to assess ferrokinetics in humans. (i) The fecal recovery method applies the principles of a metabolic balance study but offers enhanced accuracy because the amount of iron isotope present in feces can be directly traced back to the labeled dose, distinguishing it from endogenous iron lost in stool from shed intestinal cells. (ii) In the plasma isotope appearance method, plasma samples are collected for several hours after oral dosing to evaluate the rate, quantity, and pattern of iron absorption. Key metrics include the time of peak isotope concentration and the area under the curve. (iii) The erythrocyte iron incorporation method measures iron bioavailability (absorption and erythrocyte iron utilization) from a whole blood sample collected 2 weeks after oral dosing. Simultaneous administration of oral and intravenous tracers allows for separate measurements of iron absorption and iron utilization. These three methods determine iron absorption by measuring tracer concentrations in feces, serum, or erythrocytes after administration of a tracer. In contrast, (iv) in iron isotope dilution, an innovative new approach, iron of natural composition acts as the tracer, diluting an ad hoc modified isotopic signature obtained via prior isotope administration and equilibration with body iron. This technique enables highly accurate long-term studies of iron absorption, loss, and gain. This review discusses the application of these kinetic methods and their potential to address important questions in hematology and iron biology.
Key Points
| Stable iron isotope techniques are essential for evaluating iron kinetics from oral supplements and fortificants, as well as for studying the effects of diseases and genetic disorders on iron absorption and excretion. |
| The appearance of a stable iron isotope in plasma after oral administration can be used to immediately assess the rate, quantity, and pattern of iron absorption. In contrast, the erythrocyte iron incorporation method measures both the absorption and subsequent utilization of iron by erythrocytes, measured 14 days after administration. |
| The iron isotope dilution method employs naturally occurring iron as a tracer, which dilutes an enriched isotopic signature previously introduced and equilibrated with the body’s iron stores. This innovative new technique enables long-term studies of iron absorption, loss, and gain. |
The Importance of Iron in Global Health
Iron plays a crucial role in human health, and iron deficiency is one of the primary causes of disability worldwide. According to the World Health Organization, anemia affects 30% of non-pregnant women, 37% of pregnant women, and 40% of children under the age of 5 years, with ~50% of these cases attributable to iron deficiency [1]. In 2019, anemia accounted for 50 million years of healthy life lost because of disability [2]. There is an urgent need for successful strategies to control and treat iron deficiency, and their success hinges on increasing the intake of bioavailable sources of iron. Stable iron isotope techniques are critical for assessing the bioavailability of iron from fortificants and supplements, as well as for evaluating the impact of diseases and genetic disorders on iron absorption and loss. Most previous reviews have focused on methods used to study iron bioavailability from foods [3–7]. The objective of this review is to critically evaluate methods for assessing iron kinetics in humans, with an emphasis on the effects of iron supplements and fortificants. However, the absorption of iron supplements and fortificants taken with food is influenced by dietary inhibitors and enhancers. Additionally, physiological factors that modulate iron absorption from foods also affect supplemental and fortificant iron absorption, and these will be discussed where relevant.
Iron Physiology and Body Iron Pools
To design studies of iron absorption using stable isotopes, a basic understanding of iron physiology and body iron pools is essential. This knowledge aids in selecting the correct isotope type and dose, as well as determining which biological samples to assess and the timing of their collection.
Iron Absorption and Loss
For other minerals and trace elements in humans, homeostatic mechanisms adjust both stool and urinary losses and intestinal absorption rates to maintain optimal levels in the body. However, in humans, iron absorption is the primary mechanism for regulating body iron because iron cannot be actively excreted [8]. Physiological iron loss is minimal, occurring mainly through cellular desquamation, and cannot be accelerated even with excess body iron content or intake, as demonstrated in meticulous balance studies from the 1930s [9, 10].
Thus, regulation of intestinal iron absorption rebuilds iron stores after blood loss and increases body iron when physiological needs are high, for example, during the expansion of the red cell mass during pregnancy and during childhood growth. High body iron stores and inflammation can increase serum hepcidin levels, leading to hepcidin binding to ferroportin on enterocytes and macrophages. This interaction causes the internalization and degradation of ferroportin, preventing the release of intracellular iron [11]. Early studies in iron physiology revealed that the fractional absorption of iron typically decreases as the iron dose increases [12]. Heme iron is found in animal-based foods, particularly in red meat, poultry, and fish. It is derived from hemoglobin and myoglobin, proteins that store and transport oxygen in animals. Non-heme iron is found in plant-based foods, including vegetables, grains, nuts, seeds, and legumes. It is also the type of iron added to iron-fortified foods and supplements. Heme iron is more readily absorbed by the body, with an absorption rate of about 15–35%. The absorption of heme iron is relatively unaffected by other dietary factors. Non-heme iron is less efficiently absorbed, with an absorption rate of about 2–20%. The absorption of non-heme iron is markedly influenced by various dietary factors that can reduce absorption (e.g., phytic acid) or increase it (e.g., ascorbic acid). This review focuses on absorption of non-heme iron. Over the past two decades, significant advancements have been made in understanding the molecular pathways involved in iron absorption and metabolism [13].
Body Iron Pools and Partitioning
Once absorbed, iron is exported from the enterocyte and transported in the circulation by transferrin [11]. Transferrin receptors on the cell membranes of tissues bind to transferrin, allowing the iron to be internalized and released [8]. Most transferrin-bound iron is taken up by erythroid cells in the bone marrow, with each mature erythrocyte containing approximately 1 million iron atoms in hemoglobin for oxygen transport. Approximately 80% of absorbed iron is taken up by the developing erythron, and in healthy adults, it takes 10–12 days for absorbed iron to appear in the blood as reticulocytes [14]. This timeframe is critical in designing studies that use the erythrocyte incorporation method. Iron is also a vital component of myoglobin, cytochromes, and many enzymes. Absorbed iron that is not immediately utilized can be stored, primarily as ferritin in the liver [8]. Erythrocytes have a mean lifespan of 120 days in non-pregnant adults, and once an iron isotope is incorporated into new erythrocytes, the isotopic enrichment remains stable over this 120-day period [14]. Senescent erythrocytes are ingested by splenic and hepatic macrophages. The iron released from the catabolized heme is recycled by transferrin, allowing it to be re-incorporated into erythrocytes and other tissues [13]. Iron isotopic studies have helped to define the distribution and partitioning of body iron pools and these are illustrated in Fig. 1.
Fig. 1.

Human body iron pools (70-kg adult). About 10% of dietary iron is absorbed in the proximal duodenum, and 1–2 mg/day of absorbed iron enters the circulation bound to transferrin. Approximately 1000 mg of iron is stored as ferritin in the liver. About 130 mg is in other tissues bound to myoglobin or to enzymes. Erythrocytes contain about 2000 mg bound to hemoglobin. Around 80 mg of iron is found in splenic macrophages that degrade senescent erythrocytes and return iron to the circulating iron pool, which contains 20–25 mg/day. The body loses 1–2 mg of iron each day, mainly through sloughed epithelial cells
Iron Isotopic Tracers
Iron isotopes can be either radioisotopes that emit ionizing radiation, or stable isotopes that are naturally occurring non-radioactive isotopes found in fixed amounts in nature and in the foods we consume. Isotopes of the same element have the same number of protons (same atomic number) but differ in atomic mass owing to varying numbers of neutrons. Iron isotopes are frequently used as tracers in environmental and health studies. For an iron tracer to be useful for human studies, the tracer should be absorbed in the same manner as iron from the supplement or fortificant it is labeling and should be metabolized in the same way as other body iron.
Radioisotopes
Early studies of body iron pools and iron bioavailability were conducted using the iron radioisotopes, 55Fe (half-life 2.94 years) and 59Fe (half-life 45 days) [15]. They have several advantages for human studies: (i) they require only a very small amount of iron label; (ii) 59Fe, a gamma-emitter, allows for whole-body counting to measure the retention of iron isotope in the body and its distribution [15]; and (iii) the facilities needed to measure iron radioisotopes are widely available. However, there are disadvantages to using radioisotopes: (i) specific licenses are required to administer radioactive isotopes to human subjects and remove radioactive waste; (ii) they have finite half-lives, so there are time constraints for shipping and storing radioisotopes, and for the collection and analysis of samples after dosing; and (iii) exposure to ionizing radiation limits their use primarily to non-pregnant adults.
Stable Isotopes
The four stable isotopes of iron are not radioactive and exist in fixed ratios in the environment, human body, and foods, i.e., they have fixed naturally occurring abundances (Table 1). Stable isotopes of iron were introduced for human studies in the 1960s [16], and their use in human nutrition studies expanded in the 1980s. Validation studies showed that data from radioisotope iron studies were comparable to those obtained with stable isotopes in men and women [17, 18]. Administration of stable iron isotopes poses no known adverse risks to humans at the doses typically used. Because of their differences in mass, the three less abundant stable iron isotopes can be administered simultaneously to the same subject in human studies. This allows for the simultaneous comparison of iron bioavailability within-subjects under various conditions. [19].
Table 1.
Atomic mass and natural abundance of stable iron isotopes [67]
| Isotope | Atomic mass (g/mol) | Naturally occurring abundance (at.%) |
|---|---|---|
| 54Fe | 53.940 | 5.845 |
| 56Fe | 55.935 | 91.754 |
| 57Fe | 56.935 | 2.1191 |
| 58Fe | 57.933 | 0.2819 |
Stable Isotope Methods to Assess Iron Kinetics in Humans
There are four primary approaches for utilizing stable iron isotopes to evaluate iron kinetics in humans: (i) the fecal recovery method; (ii) the plasma appearance method; (iii) the erythrocyte iron incorporation method; and (iv) the isotope dilution method.
Fecal Isotope Recovery
Iron absorption can be estimated by measuring the difference between the amount of oral stable isotope ingested and the amount excreted in feces. Typically, complete collections of feces are obtained over a period of 7–10 days following oral isotope dosing, assuming that the majority of non-absorbed isotope in the intestine will have been excreted during this period [20]. The approach applies the principles of a chemical balance method but with enhanced accuracy because the amount of stable iron isotope present in feces can be directly traced back to the labeled supplement, distinguishing it from endogenous iron lost in stool from shed intestinal cells. Fecal monitoring can be used to measure iron absorption because there is no appreciable fecal loss of iron once absorbed and negligible urinary iron excretion.
The equations used to calculate absorption are as follows:
-
(i)
-
(ii)
-
(iii)
The method can also be used to estimate the total absorption of non-heme iron from the diet, assuming that fractional absorption is comparable between the added tracer in the test meal and dietary non-heme iron. On the day of oral dose administration, total dietary intake is assessed through complete collections of duplicate meals or weighed diets. Then, the following equation is used:
-
(i)
Fecal recovery of orally administered stable iron isotopes has been compared to the erythrocyte iron incorporation method in infants [21] and has been used in studies on iron absorption in infants and adults [22–24]. Fairweather-Tait et al. [25] performed a study in newborn infants (n = 36) to measure iron absorption from (58Fe)-labeled lactoferrin compared to (58Fe)-labeled ferric citrate, using a fecal recovery period of 3 days after an oral dose. However, a fecal marker was not administered, and fecal collections might not have been complete for all infants. There was considerable variation in isotope recovery, and no significant difference in iron absorption was observed between the groups.
An advantage of the fecal recovery method is it is non-invasive, as it does not require a blood sample. Additionally, the tracer dose required may be lower than that needed for other isotopic techniques. However, it has significant drawbacks. It is labor intensive and time consuming for subjects and researchers. Dietary intake data are often imprecise. Subject compliance is crucial, as even minor losses of excreted isotope can lead to overestimations of absorbed iron. Short collection periods lead to an overestimate of absorption due to the incomplete recovery of the unabsorbed isotope. Collection periods need to be of sufficient duration to ensure the complete fecal excretion of isotopic iron trapped in the gut mucosa but not absorbed into the circulation, otherwise the method only measures the luminal disappearance of iron. Contamination of stool collection containers with environmental iron can reduce the fecal isotopic enrichment, leading to an overestimation of net absorption. Given that daily dietary iron intake averages only milligrams and the fraction of absorbed iron from the gut is usually low, these small discrepancies can sharply bias results. Because of these challenges and limitations, this approach is now seldom used to assess iron absorption.
Plasma Stable Isotope Appearance
Stable isotope appearance curves after an oral tracer dose can be measured in whole blood, plasma, or serum to detect the appearance of small amounts of absorbed labeled iron with high precision. This method was originally developed using iron radioisotopes [26]. It can differentiate absorbed iron from circulating body iron, even with doses as low as 5 mg [27]. This provides an advantage over total serum (non-isotopic) iron curves, which are typically informative only for supplemental oral doses exceeding 25 mg of iron [6]. This is because a pharmacologic dose of iron is required to elicit a serum iron response that is significantly different from basal intra-individual and diurnal variations [28]. Stable isotope appearance curves have been validated as a reliable measure of iron absorption [17]. These curves can assess the rate, quantity, and pattern of absorption, as well as the clearance rate of absorbed iron. In a study by Troesch et al. [29], iron from ferrous sulfate was absorbed rapidly and cleared from the serum at a rate comparable to earlier studies estimating the clearance of radioactive iron isotopes from plasma [26]. While stable isotope appearance curves can be measured in whole blood [27], measurements in serum or plasma may enhance sensitivity and resolution [29].
In this approach, a baseline blood sample is collected after an overnight fast before tracer consumption, followed by regular interval samples (e.g., at 15 min, 30 min, 1 h, 90 min, 2 h, 3 h, 4 h, 6 h, 8 h, 12 h, and 24 h post-dose intake) [30]. To minimize postprandial serum iron fluctuations, subjects may receive standardized low-iron vegetarian meals on the day of the study [30]. The maximum (peak) plasma iron concentration and the time to reach maximal plasma concentration can be extrapolated from data fitted to a one-compartment model assuming first-order absorption [30]. The area under the curve (AUC) can be calculated using the trapezoidal rule [30]. A final blood sample can be collected 14 days later to determine the erythrocyte isotopic composition for calculating overall iron bioavailability from the test dose (as described in the next section).
An early study using plasma appearance of a stable isotope to measure iron absorption was done in 9 healthy UK women studied serially during pregnancy [31]. Isotope ratios in serum were measured following the oral administration of 5 mg of 54FeSO4 and the intravenous injection of 200 μg of 57FeSO4. The authors calculated the AUC for enrichment in the iron isotope ratios, rather than concentrations, for both the oral and intravenous labels. Fractional iron absorption was then calculated using the ratio of the two AUCs. The study reported a significant six-fold increase in iron absorption over a normal pregnancy.
The absorption profile of iron fortificants may determine their ability to generate non-transferrin-bound iron and, consequently, their potential safety. Ferrous iron is typically absorbed more rapidly than ferric iron, but differences at the fortification level cannot be distinguished with non-isotopically labeled serum iron curves. Using stable isotope appearance curves measured over 8 hours after oral dosing in a crossover design, Troesch et al. [29] measured iron absorption profiles in 16 healthy Swiss women from 6 mg of iron as FeSO4 with ascorbic acid and from 6 mg as NaFeEDTA, as well as the non-transferrin-bound iron response following the meals. Iron from FeSO4 was more rapidly absorbed, resulting in a 35% greater relative AUC during the first 2 hours compared with NaFeEDTA, but neither compound increased non-transferrin-bound iron. This was the first study to demonstrate that stable isotope appearance curves are a useful tool for comparing iron absorption profiles from different iron compounds in fortified foods.
Husmann et al. [30] measured the serum stable iron isotope appearance to investigate the mechanism by which prebiotics increase iron absorption [32]. In a crossover design, iron-depleted (n = 11) women received two 14-mg iron doses as labeled (57Fe,58Fe) ferrous fumarate 14 days apart with and without prebiotics in random order. Multiple blood samples were collected over of 24 hours and 14 days later to determine plasma appearance and fractional iron absorption (Fig. 2). The appearance data were fitted using non-linear mixed-effects modeling to a one-compartment model with first-order absorption, and AUC and time of peak serum isotope concentration (time to reach maximal concentration) were calculated. The absorption kinetics suggested that prebiotics did not influence gastric emptying but were consistent with enhancement of iron absorption in the proximal, rather than the distal, gut.
Fig. 2.

Serum stable iron isotope appearance curves after administration of two 14-mg iron doses of ferrous fumarate (FeFum) to healthy Swiss women (n = 11). One dose was labeled with 57Fe and administered alone and one was labeled with 58Fe and administered with 15 g of prebiotic galacto-oligosaccharides (GOS). The participants were followed for 24 hours (h). Data are presented as means and standard errors. From reference [30] with permission
The plasma isotope appearance method has limitations, including the burden on participants owing to the need for frequent blood draws, as well as the time and cost of numerous isotopic analyses. The technique assumes there are not marked differences in the blood volume between individuals in the population being evaluated. An advantage of this approach is that it does not rely on assumptions of isotopic incorporation into erythrocytes or estimates of hemoglobin iron content.
Erythrocyte Iron Incorporation Method
The erythrocyte iron incorporation method assesses iron bioavailability by measuring the incorporation of stable isotopes into erythrocytes 14 days after administration (Fig. 3). This method evaluates not only the absorption of the iron dose but also its transport to the bone marrow and utilization by developing erythrocytes (the two components of iron bioavailability). Concurrent administration of an intravenous tracer allows discrete measurement of iron utilization versus absorption [33] as discussed below.
Fig. 3.

Overview of two stable iron isotope methods: erythrocyte iron incorporation and isotope dilution. The erythrocyte iron incorporation method assesses iron bioavailability by measuring both the absorption of an orally administered stable isotope and its utilization to form new erythrocytes. Erythrocyte incorporation can be directly measured by giving a second tracer intravenously at the same time as the oral label, or incorporation can be assumed to be 80% (in healthy adults). Incorporation is complete by 10–12 days post-dosing. When the labeled erythrocytes reach the end of their lifespan, they will be broken down and the tracer will enter the circulating body iron pool, and gradually distribute through all tissues. After 12 months in adults, all body iron will be uniformly enriched with the tracer. Thereafter, the isotope dilution method can be used to assess iron absorption (and loss). Iron of natural composition acts as a tracer diluting the ad hoc modified isotopic signature in body iron. The concentration of the isotope tracer can only decrease owing to the influx of iron with a natural isotopic composition. The rate of decrease in the tracer concentration in circulation, expressed as the slope of tracer concentration over time, is proportional to iron absorption
Following absorption of an oral dose, most iron is incorporated into erythrocytes within 10–12 days [14]. It is unclear whether this process may take longer in infants. An early study suggested complete iron incorporation into erythrocytes in infants required 28 days [34], but a recent study reported it is achieved within 14 days [35]. Once incorporated, isotopic enrichment remains stable throughout the lifespan of the erythrocyte (~120 days), making it a reliable indicator of iron absorption following administration of single oral doses, multiple oral doses, or combined oral and intravenous iron isotopes.
The erythrocyte iron incorporation method relies on several assumptions, many of which were validated in early studies using iron radioisotopes [36, 37]. These assumptions include: (i) an unchanging fraction of iron is absorbed is incorporated into erythrocytes; (ii) hemoglobin in erythrocytes contains a constant concentration of iron; and (iii) once absorbed iron has been incorporated into erythrocytes, it remains within the erythrocyte and does not exchange with iron in plasma. However, recent data suggest that erythrocytes can release small amounts of iron into the plasma [38], suggesting this final assumption may not be entirely true.
Studies employing the erythrocyte iron incorporation method often utilize a study design where two or three oral iron isotopes are administered simultaneously to compare different conditions within the same subject [19]. This approach reduces the potential bias from estimating blood volume and the fraction of absorbed iron incorporated into erythrocytes (discussed below), as the primary focus is typically on comparing the relative bioavailability between different test conditions. If achieving sufficient enrichment requires a large dose of isotope, or if native iron intake is low, the isotope dose may be spread over several doses [39] or meals [40]. Single meal studies are useful for indicating whether dietary compounds inhibit or enhance iron absorption, but they may overestimate the effects of these compounds [41]. This is because these studies typically focus on the effects of a single enhancer (e.g., ascorbic acid) or a single inhibitor (e.g., phytic acid) on iron absorption, rather than the effects of mixed meals [42, 43]. Additionally, these studies may not accurately reflect long-term iron absorption from fortified foods or supplements, as they do not account for adaptive changes in absorption that occur with an increased iron intake. Comparative studies indicate that the effect of enhancers and inhibitors on non-heme iron absorption in single meals may be approximately twice as strong as in whole diets consumed over several weeks [44, 45]. Two weeks after the final administration of the isotopes, a blood sample is collected to measure the relative abundance of each isotope in erythrocytes. Most studies employ the two lowest abundance isotopes, 58Fe and 57Fe, but 54Fe can also be used if a third isotope is needed [19].
Calculation of the Circulating Iron Pool
Analyzing the collected isotopic data involves several steps. The initial calculation estimates the size of the circulating iron pool, using the formula:
Blood volume is influenced by multiple factors including body size and composition, sex and age, certain diseases, and pregnancy. It can be measured directly or estimated using established formulas based on weight and/or height. Direct assessment methods include the carbon monoxide re-breathing method [46], intravenous dosing with radioisotope-tagged erythrocytes or albumin, or the use of dyes such as indocyanine green [47]. However, these direct methods are costly and require specialized resources, limiting their use in some research settings. Therefore, in most studies, blood volume estimates are derived from equations considering combinations of body weight, height, surface area, lean body mass, and age. Estimations of blood volume specific to infants, children, and healthy non-pregnant adults have been published [48–53]. It should be noted that the normative groups used to develop equations for estimating blood volume may be limited and therefore might not be applicable to all populations. Typically, to estimate blood volume, studies in infants use 80–85 mL/kg body weight [54], studies in children use 65 mL/kg [55], and studies in adults use normative equations based on both height and weight, for women [52] and men [53].
Estimation of adult blood volume for women can be calculated using the formula [52]:
For men, the estimation of adult blood volume is calculated by [53]:
Calculation of Erythrocyte Incorporation and Fractional Iron Absorption
After calculating circulating iron, the total amounts of stable isotope tracers incorporated into erythrocytes can be assessed. While radioiron concentrations can be directly measured using techniques such as Geiger counters or liquid scintillation, stable isotope concentrations are determined based on the isotope composition obtained by mass spectrometry (inductively coupled plasma mass spectrometry or thermal ionization mass spectrometry) from a whole blood sample.
In a study using the stable isotopes 57Fe (A) and 58Fe (B) as tracers, the measured isotopic ratios R57/56 and R58/56 can be expressed as follows, considering that the tracers are not purely mono-isotopic [56]:
where represents the abundance of isotope i in natural iron, represents the abundance of isotope i in tracer j (respectively A and B), nnat is the amount of circulating natural iron in mmol, and nA and nB are the amounts of circulating tracers in mmol.
Circulating Fe ntot in mmol is the sum of nnat, nA, and nB, and is equal to circulating Fe in mg divided by the atomic mass of Fe (55.845 g/mol).
The equations can be arranged in the following form:
This system of three linear equations can be solved using Cramer’s rule [57, 58] for nA/ntot and nB/ntot, which represent the concentrations of tracers A and B in the total circulating iron. If a third tracer is administered, the equations are extended to a system of four linear equations, solved in the same way.
The amounts in mmol of isotopic tracers incorporated into erythrocytes can then be calculated:
In healthy adults and children, a significant portion of absorbed iron, but not all, is incorporated into erythrocytes. Studies have reported mean erythrocyte incorporation rates of 80–85% in US men [59], ~80% in iron-depleted US women [60], 93% in Thai women [61], ~80% in British men [62], and 73–76% in Ghanian infants [63]. Iron bioavailability studies typically assume that 80% of iron absorbed from an oral dose in adults is incorporated into erythrocytes, and 75% is incorporated in infants. This shared assumption allows comparisons between studies, and is demonstrated in the following equation:
Calculation of the fractional iron absorption of tracers A and B:
where AFeinc and BFeinc are from the equation above and AFedose and BFedose are the doses administered, in mmol, and the assumed incorporation of the absorbed isotope into erythrocytes is 80%.
Intravenous Administration of Tracers
In certain physiological conditions, the rate at which absorbed iron incorporates into erythrocytes can vary, and assuming an 80% incorporation rate may introduce bias. One study reported that erythrocyte iron incorporation is decreased in women receiving iron supplements [64] and one showed that incorporation is indirectly related to iron stores [45, 60]. These variations in erythrocyte iron incorporation between healthy individuals generally do not affect comparative studies where individuals serve as their own controls. However, direct measurement of incorporation can be beneficial in specific cases. For instance, it may be advantageous in pregnant women, where iron incorporation rates can fluctuate [65] and in individuals with genetic or infectious conditions that affect blood volume, turnover of erythrocytes, or recycling of iron by splenic macrophages [33, 61, 66].
In such cases, the fraction of circulating iron isotope that incorporates into erythrocytes can be directly measured by administering an intravenous iron dose. Ferrous citrate is commonly used because of its lower allergenic potential compared with other forms of intravenous iron [67]. Typically, 1 hour after the oral isotope has been administered, an aqueous solution containing 100 μg of 54Fe or 58Fe as iron citrate is slowly infused over 50 minutes [33]. This rate of intravenous infusion of iron is based on the estimated 2-μg/min plasma appearance of iron normally absorbed from the gastrointestinal tract [62]. Subjects undergoing an intravenous infusion of iron should be monitored under medical supervision. The estimated circulating iron pool size is used to determine the amount of intravenous isotope incorporated into erythrocytes, expressed as a percentage of the intravenous dose administered [61]. This percentage is then assumed to reflect the erythrocyte incorporation of absorbed oral label, using the directly measured incorporation rate instead of the assumed 80%. This approach assumes similar kinetics of intravenous and oral iron tracers after absorption.
Normalization to a Reference Dose or to Iron Status
Non-heme iron absorption varies depending on an individual’s iron status. In iron-deficient individuals, iron absorption is up-regulated, and fractional iron absorption of an oral dose typically is higher than in iron-sufficient individuals. To reduce inter-subject differences in absorption, one approach is to administer a stable isotope as a reference dose at the same time the other stable iron isotope is given with the test meal or compound of interest. The reference dose represents iron absorption under ideal conditions. A common reference dose is 3 mg of iron as FeSO4 combined with 30 mg of ascorbic acid [68]. To facilitate comparisons across subjects, absorption data from the reference dose are standardized to a set reference value, typically 40%. The fraction of iron absorbed from the test meal relative to the reference dose is then calculated accordingly [8, 69].
For normalizing iron absorption data to a reference dose, the following equation can be used:
where absorption is expressed as a percentage of the total administered dose, the subscripts N, O, and Ref denote the normalized, observed, and reference doses, respectively.
Another approach to normalization utilizes the indirect relationship observed between iron absorption and serum ferritin [44]. The equation adjusts measured iron absorption to a specified reference serum ferritin, usually 25 or 40 µg/L. This approach allows for comparisons of iron absorption across individuals with varying serum ferritin levels [70].
The equation for normalizing absorption data to a reference serum ferritin level:
where absorptionN is the normalized dietary iron absorption (%), absorptionO is the observed dietary iron absorption (%), ferritinO is the observed serum ferritin level (μg/L), and ferritinR is the reference serum ferritin level (μg/L).
Galetti et al. [71], based on pooled analysis of extant data in over 1000 healthy women given oral stable isotopes, proposed an alternative equation for normalization of individual absorption values to a common ferritin reference value. In this study, serum ferritin levels of 15, 30, and 50 µg/L corresponded to fractional iron absorption of 15.8%, 10.0%, and 5.8%, respectively [71]. The proposed equation is:
where absorptionN is the normalized dietary iron absorption (%), absorptionO is the observed dietary iron absorption (%), and ferritinO is the observed serum ferritin level (μg/L).
Caution is needed when using serum ferritin for normalization because ferritin is an acute-phase protein that increases in response to inflammation or infection [8]. Therefore, iron-deficient individuals with infections may appear iron sufficient because of elevated serum ferritin levels, potentially skewing normalization calculations. To ensure accurate normalization, it is advisable to measure inflammation markers, such as C-reactive protein and alpha-1-acid glycoprotein, to confirm the absence of inflammation in the subjects. Measurements of C-reactive protein and alpha-1-acid glycoprotein can also be used to adjust ferritin for inflammation [72].
Extrinsic Versus Intrinsic Labeling
Isotopes can be incorporated into test meals either extrinsically or intrinsically. In extrinsic labeling, the stable isotope is typically mixed into the test meal just before or during its consumption. Unlike native iron naturally found in the food, the extrinsic label is not integrated into the food's structure or bound to the same substances. This difference raises concerns that the bioavailability of the extrinsic label may not accurately reflect that of the native iron in the tested food.
In contrast, intrinsic labeling involves incorporating the stable iron isotope into the food during its growth or production process to create a labeled food that closely resembles the native food. For plant sources, this typically entails growing the food hydroponically using an enriched iron source, harvesting it, and then measuring the enrichment of the final product. This ensures that the iron isotope is located in the same biological structure and has the same chemical form as the native iron. However, intrinsic labeling can be challenging and costly, especially when the plant source accumulates little iron or when the edible portion is naturally low in iron. Similar difficulties apply when labeling animal-derived foods such as milk.
Studies have provided comparative data on iron absorption from both intrinsically and extrinsically labeled food sources for certain foods. Although there is not universal agreement [73], most researchers have concluded that nearly all non-heme iron in a meal—including native iron and many types of fortification iron, but not all—contributes to a fully exchangeable common pool of non-heme iron in the intestinal lumen [43]. This supports the use of extrinsic labeling in studies assessing food iron absorption [74, 75].
A challenge in measuring the bioavailability of iron supplements using stable isotopes lies in preparing appropriately labeled test materials. To label an iron supplement accurately, the isotopic tracer must be in the identical physicochemical form or must be fully exchangeable with the supplemental iron in the stomach and upper intestine. Iron salts soluble in water or dilute hydrochloric acid (pH 2), which simulates gastric pH, can be extrinsically labeled using an iron isotope solution. However, for supplements that are insoluble, partially soluble, or chelated to other compounds (e.g., amino acid chelates, NaFeEDTA), the isotopic label must be in a similar form before mixing with the supplement. When possible, for pharmaceutical products, enriched iron isotopes should replace the normal iron during manufacturing. The costs of this process can be prohibitive, particularly when the chemical synthesis yields of an iron compound are low and expensive stable isotopes are used [6]. In some instances, synthesizing isotopically enriched forms of iron may not be possible, such as with polysaccharide iron complexes containing iron oxides and certain forms of elemental iron (e.g., hydrolytic iron, reduced iron) [6].
Exemplary Studies
The erythrocyte incorporation method is commonly used to measure iron bioavailability from newly-develeoped supplemental iron compounds in humans. Such studies have evaluated iron absorption from iron amino acid chelates [76], iron picolinate [77], lactoferrin [78], and ferritin [79]. This method has also been used to investigate the effects of different dietary factors and dosing regimens on iron absorption from iron supplements. Guidelines generally recommend taking iron supplements in the morning, away from meals, and with ascorbic acid to enhance absorption, but there is limited direct evidence supporting these recommendations. Recent studies by von Siebenthal et al. [19] addressed this gap. Iron-depleted women (n = 34) received oral iron 100-mg doses labeled with 54Fe, 57Fe, or 58Fe under various conditions: with different doses of ascorbic acid, with coffee and breakfast, and in the morning versus the afternoon (Fig. 4). Fractional iron absorption from over 200 iron supplement doses was calculated based on erythrocyte incorporation of the multiple isotopic labels. The data clearly showed that to maximize efficacy, ferrous iron supplements should be consumed in the morning, away from meals or coffee, and with an ascorbic acid-rich food or beverage.
Fig. 4.

Fractional iron absorption (%) from an oral 100-mg iron supplement in 34 healthy young Swiss women. The ferrous fumarate supplement was given after an overnight fast in the morning with water (reference), with 80 mg of ascorbic acid (AA), with 500 mg of AA, with 150 mL of instant coffee (2 g of coffee powder) or with a breakfast. Breakfast consisted of a wheat flour-based bread roll with butter and honey, plain whole milk yogurt, orange juice, and coffee. Boxes show the median and 25th and 75th percentiles; whiskers show the range; points show individual values. Boxes with different subscript letters differ significantly (capitals: model with enhancers, minuscule: model with inhibitors, p < 0.05). From reference [19] with permission
High-quality studies have measured cumulative iron absorption from multiple stable isotope-labeled supplemental iron doses [39]. One prospective, open-label, randomized controlled trial assessed iron absorption using 57Fe-labeled or 58Fe-labeled ferrous sulfate in iron-depleted young Swiss women (n = 41). One group received 60 mg of iron daily for 14 consecutive days, while the other group received the same doses on alternate days for 28 days. At the end of treatment, cumulative fractional and total iron absorptions were compared. The study found that alternate-day dosing of iron 60 mg significantly increased iron absorption compared with daily dosing. Similar studies using stable iron isotopes have reported the benefits of alternate-day dosing with lower doses of ferrous iron supplements [80, 81]. These findings have influenced changes in recommendations on iron supplementation [82, 83].
The erythrocyte incorporation method can be used to measure the effects of common diseases and the benefits of treatment on iron absorption and utilization. Comparative studies in normal weight and overweight women have used this method to detail the impaired iron homeostasis and reduced iron absorption characteristic of adiposity-related inflammation [84–87]. The profound effects of malaria [88] and tuberculosis [33] on iron absorption and utilization have been quantified in prospective studies in Africa comparing erythrocyte iron incorporation before and after treatment.
The erythrocyte incorporation method using oral and intravenous tracers has been employed to measure the effects of acute and chronic exercise on iron kinetics. In a study by McKay et al. [89], male runners (n = 18) consumed test meals labeled with 4 mg of 57Fe or 58Fe 30 min before and 30 min after treadmill running; iron absorption was found to be comparable pre-exercise and post-exercise. Barney et al. [90] used orally administered 54Fe and reported that a prolonged bout of running increased hepcidin levels and decreased dietary iron absorption immediately after exercise in trained runners (n = 28) with low iron stores. Moretti et al. [91] conducted a prospective intervention study in non-anemic iron-sufficient men (n = 10) who completed a 34-day study consisting of a 16-day control phase and a 22-day exercise-training phase involving 8 km of running every second day. Oral iron absorption and erythrocyte iron utilization were measured using oral 57Fe and intravenous 58Fe tracers administered before and during training. The study found that increased exercise intensity led to both increased inflammation and erythropoiesis; the net effect was a decrease in hepcidin levels and an increase in oral iron absorption. However, compartmental modeling indicated that the iron required for the increase in hemoglobin was predominantly (>80%) obtained from mobilized stores rather than from increased dietary absorption.
Stable Iron Isotope Dilution Method
The stable isotope dilution method is an innovative new method that allows longer term studies of both absorption and loss. Conventional means of evaluating iron fortification or supplementation can provide estimates of hemoglobin and serum ferritin gains during an iron intervention but cannot quantify the amounts of iron absorbed or lost. Moreover, determinations of hemoglobin and other serum iron biomarkers only indirectly reflect changes in total body iron, often with poor specificity and/or sensitivity [92, 93]. Although methods for measuring iron excretion [94, 95] exist, they are not practical for clinical use. The stable isotope dilution method, adapted from techniques originally developed for radioisotope studies [96, 97], allows for the safe and direct measurement of iron absorption and loss over extended periods. It may be particularly useful in regions with high infection rates, where inflammation can skew common iron indices [12]. Isotopic dilution may exhibit greater robustness and reduced confounding compared with conventional iron indices [98].
In the three stable isotope methods described above, measurement of tracer concentration in feces, serum, or erythrocytes after tracer administration is used to determine fractional absorption. The isotope dilution approach uses an inversion of this concept—with iron of natural composition acting as a tracer diluting an ad hoc-modified isotopic signature obtained via stable isotope administration and equilibration with body iron (Fig. 3). Initially, iron isotope tracer causes enrichment in erythrocytes, which then decreases as the iron is redistributed to other tissues following erythrocyte turnover [99]. After a period of 12 months in adults [96] or 8 months in infants and children [55], isotopic equilibrium is achieved, with the tracer concentration becoming uniform across body compartments [99]. After this point, the concentration of the isotope tracer only decreases owing to the influx of iron with a natural isotopic composition, which ‘dilutes’ the enriched tracer [96, 97]. The rate of decrease in the tracer concentration in circulation, expressed as the slope of tracer concentration over time, is proportional to iron absorption. The factor describing this relationship is the slope of the logarithmical tracer concentration plotted over time (kabs) (Fig. 5). The larger the absolute value of kabs, the greater the fraction of total body iron that has been absorbed.
Fig. 5.
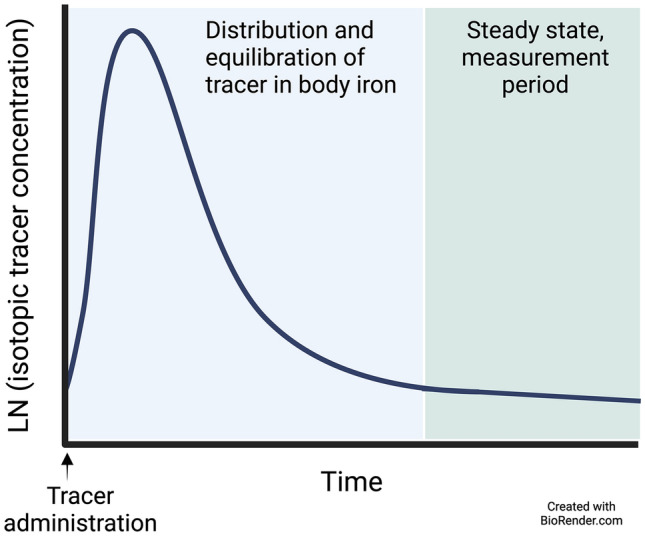
Schematic of changes in the concentration of an isotopic iron tracer in circulating blood over time. After an equilibration period, isotope equilibration with total body iron is achieved. Starting from this point onwards, as iron of natural abundance is absorbed into the body, the rate of decrease of the natural logarithm of the concentration of the tracer is proportional to the fraction of total body iron absorbed per unit of time. LN natural logarithm
Similarly to kabs, a decrease in the amount of tracer in the circulation can occur only with loss of the tracer and a corresponding loss of body iron (of natural isotopic composition). Iron loss only influences the amount of body iron but not its isotopic composition. The factor describing this is the slope of the logarithmical 57Fe amount over time (kloss), the fraction of total body iron lost per unit of time.
Calculation of Total Body Iron
The first step in the isotope dilution method is calculation of total body iron (Fetotal), which is calculated as the sum of circulating iron, tissue iron, and storage iron according to the following equation:
where Fecirc represents circulating iron, and is calculated according to the equation in Sect. 4.3.1, Fetissue represents tissue iron in myoglobin and iron-containing enzymes and is simplified as 6 mg/kg body weight for adults, derived from adult men [100] and assumed by analogy to be the same in children [55]. Festore represents storage iron, consisting of iron in ferritin and hemosiderin and for adults and children is calculated (only if the serum ferritin level is > 15.9 μg/L, when the serum ferritin level is ≤ 15.9 μg/L, stores are absent) according to the equation [101]:
where serum ferritinA is the serum ferritin level adjusted for inflammation according to the BRINDA (Biomarkers Reflecting Inflammation and Nutritional Determinants of Anemia) initiative [72].
Calculation of kabs
The decrease in tracer concentration after the equilibration period, in which all body iron is equilibrated with the tracer, reflects the rate of change of body iron composition [d−1] expressed as:
where d(AA)/dt represents the rate of change of tracer concentration AA per unit of time and kabs is the rate of change of tracer concentration constant.
Resolution of the differential equation leads to:
Iron loss only reduces the amount of body iron but does not affect its isotopic composition. Thus, kloss as the rate of decrease of the isotopic label results from the semi-logarithmical regression of the tracer amount plotted against time; similar to the relationship shown above for kabs.
The mean quantity of iron absorbed (Feabs) over the period of interest is then calculated as
where Fetotal is the total body iron at the period midpoint calculated from the linear regression of Fetotal against time and kabs is the rate of change of tracer concentration constant.
Mean iron loss (Feloss) is calculated correspondingly and net iron balance (Fegain) is determined by subtracting Feloss from Feabs.
Exemplary Studies
The iron isotope dilution method has been successfully applied across various populations, including newborns [54], infants [55, 98], children [102], adolescents [103], and women of reproductive age [104, 105]. Fomon et al. [55] administered 1.6 mg of 58Fe-labeled FeSO4 to 33 free-living US infants at 5.6 months of age and followed them to age 26 months. Blood samples were collected at regular intervals for determination of isotopic enrichment and indices of iron status. The isotope equilibrated with total body iron by 13 months of age. From 13 to 26 months, absorption and loss of iron were calculated based on changes in the tracer’s abundance in circulating iron. There was significant intersubject variability in iron loss and absorption, and these two factors were highly correlated. The data indicated that the intake of bioavailable iron from 13 to 26 months of age was insufficient to maintain optimal iron nutritional status.
Isotope dilution may be particularly useful in the newborn period when dynamic shifts between body iron compartments complicate the interpretation of conventional iron biomarkers. However, a challenge in using isotope dilution at this age is the required equilibration period of approximately 8 months after isotope administration [55]. To address this, Stoffel et al. administered 12 mg of the stable iron isotopes 57Fe or 58Fe as ferrous sulfate to pregnant women in their second and third trimester [106] and used maternal-fetal iron transfer to label newborn body iron [54]. Infants were studied at ~2 days after birth and at 3 and 6 months of age and iron absorption, loss, and gain from birth to 6 months were assessed. Dietary assessment of infant feeding was performed at three timepoints, allowing for calculation of iron intakes and bioavailability. The method was minimally invasive, requiring only heel-stick blood samples, and provided long-term assessment of iron homeostasis, rather than single-point estimates from absorption studies. This study demonstrated that isotope dilution can quantify long-term iron absorption and describe the trajectory of iron depletion during early infancy.
Isotopic dilution appears to be an accurate method to assess the impact of oral iron supplementation in regions where infections are common, where inflammation complicates the interpretation of serum iron biomarkers, such as serum ferritin and soluble transferrin receptor. This has recently been demonstrated in Gambian infants (Fig. 6) [98] and women in Benin [105]. Notably, in these studies, isotope dilution suggests that daily oral iron supplementation leads to increased iron losses, potentially diminishing the effectiveness of the supplements in children and women [107].
Fig. 6.
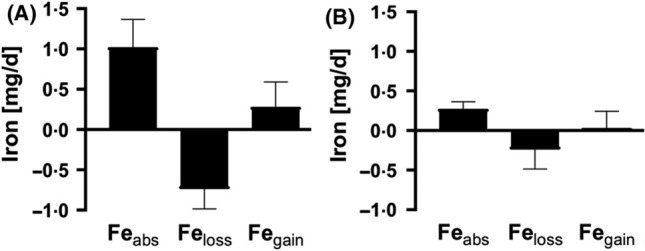
Isotope dilution measurements of iron absorption, iron loss, and iron balance in Gambian toddlers during and after oral iron supplementation. Mean (+ standard deviation) daily amounts of absorbed iron (Feabs), iron loss (Feloss), and net iron gains (Fegain) in 15 Gambian toddlers A during a 12-week supplementation period where they received micronutrient powders containing 12 mg iron daily, and B during a 12-week control period without iron supplementation. Absorbed iron, Feloss, and Fegain were all significantly greater during the supplementation period. From reference [98] with permission
Selection and Dosing of Stable Iron Isotopes
Several points should be considered when purchasing and preparing stable iron isotopes for studies in humans. The chosen dose depends on physiological factors, for example, expected fractional iron absorption, blood volume and erythrocyte mass, as well as analytical factors, such as the mass spectrometer’s accuracy, sensitivity, and limits of detection and quantification. The limit of quantification determines the minimum amount of stable isotope label needed to reliably measure the isotopic enrichment or amount, or to distinguish between two values. It is usually fixed at ten times the relative standard deviation of the mean ratio measurement [67]. A lower relative standard deviation allows for a lower administered dose of the stable isotope to achieve measurable enrichment in the biological sample.
Lower doses are beneficial as they minimize potential perturbations of iron homeostasis and decrease isotope costs. Generally, the added iron tracer should not exceed 20% of the total native iron content in the test condition. Although 58Fe is more expensive than 57Fe or 54Fe, its low natural abundance means a lower dose is needed for adequate enrichment. This is important for studies in infants and young children. The required low dose must be balanced against the mass spectrometer’s accuracy, precision, and sensitivity. However, when applying the isotope dilution method, it is essential that 8 to 12 months after administration the tracer enrichment in the blood is sufficiently high to allow its accurate monitoring. Thus, it is preferable to administer a relatively high dose (typically 12–15 mg of iron stable isotope) and to maximize its absorption by giving it with ascorbic acid.
Isotope costs vary with natural abundance, typically increasing as abundance decreases. For example, in 2024, 57Fe cost approximately US$7 per mg (96% enriched), 54Fe cost about US$5 per mg (99% enriched), and 58Fe, because of its lower natural abundance, cost approximately US$30 per mg (95% enriched). To minimize the total iron needed for dosing, batches with higher enrichment levels are preferred. Stable isotopes are typically purchased in the form of elemental iron, which is used to synthesize the compounds of interest. Purchasing all stable isotopes needed for a study in one batch ensures consistent enrichment, simplifying calculations. Although purchased isotopes come with a certificate of analysis specifying isotopic composition, it is good practice to independently verify isotopic ratios and total iron content of a batch.
For preparation of the isotope doses, all chemicals should be iron free and of pharmaceutical reagent grade. Glassware and storage vials should be acid washed and rinsed with deionized water. Exogenous iron in preparation materials reduces the stable isotope label’s enrichment and introduces errors in calculations. Doses can be packaged in single-use vials for immediate use or in larger batches for multiple volunteers. Each container should be labeled with the isotope and concentration per gram. Accurate measurement of the administered isotope dose is essential for reliable calculations. When the iron isotope is added to a food source, the food should also be pre-weighed and post-weighed to ensure that all food is consumed. Complete food consumption can be facilitated by choosing a test meal and size appropriate for the study group, and by carefully rinsing bowls and utensils with water, which is then consumed. In general, adding the isotope only to liquid portions should be avoided, as this may enhance absorption compared to mixing it into solid foods [108].
Conclusions and Future Research
Stable iron isotope methods are a robust and precise tool for assessing iron kinetics in human studies. These methods offer unique advantages for understanding iron absorption, utilization, and loss in various physiological and pathological conditions. We propose the following recommendations for the future use of stable iron isotope methods in human studies:
Standardization of Protocols: develop standardized protocols for the administration and analysis of stable iron isotopes. This may be particularly important for the isotope dilution method, and includes consistent dosing regimens, labeling techniques, and timepoints for a sample collection to ensure comparability across studies.
Expanded Applications: use stable iron isotope methods to investigate a wider range of conditions affecting iron metabolism. This includes not only iron deficiency and supplementation but also chronic diseases (e.g., obesity, diabetes mellitus, inflammatory disorders), acute infections, and genetic disorders of iron metabolism. Isotope dilution may provide insights into iron partitioning from the mother to the fetus during pregnancy. Stable isotope methods could also be used to assess iron kinetics between body compartments; for example, to identify the source of iron taken up by activated immune cells during proliferation.
Integration with Other Biomarkers: combine stable isotope techniques with other biomarkers of iron status (e.g., serum ferritin, transferrin saturation, hepcidin) to provide a comprehensive assessment of iron kinetics in different physiological states and during interventions. These techniques could help optimize use of conventional iron indices to assess iron interventions in populations.
Longitudinal Studies: exploit isotopic dilution in longitudinal studies to accurately and directly quantify long-term changes in body iron over time, particularly in response to dietary interventions, iron supplementation, and treatments for diseases that affect iron metabolism. The method’s ability to judge the impact of iron interventions in settings of high infection and inflammation, such as in patients with HIV or tuberculosis, should be studied. Isotope dilution may be the ideal method to measure long-term iron bioavailability in free-living individuals, including those with inflammatory disorders and obesity, to better inform recommendations for iron intake.
Mechanistic Insights: use stable isotope methods to gain mechanistic insights into the regulation of iron homeostasis at the cellular and molecular levels. Current stable iron isotopic measurements are typically performed in bulk cells (e.g., erythrocytes) or bodily fluids. These approaches do not capture inter-cell variation in isotopic enrichment. Emerging single-cell isotopic techniques are capable of precisely determining isotope abundances at a detailed spatial level [109]. Combined with -omics data, these techniques may provide new insights by bridging scales from single-cell activity to tissue-level and organism-level responses.
Technology Advancements: encourage the development and validation of advanced analytical techniques for isotope ratio measurements, to improve sensitivity, accuracy, and throughput. Time-resolved inductively coupled plasma mass spectrometry has great potential for single-cell analysis and may be able to monitor iron content at the single-cell level in biological systems, as previously demonstrated for bacteria [110] and red blood cells [111].
Collaborative Research: promote collaborative research efforts and data sharing among institutions and researchers to enhance the understanding of iron kinetics and to accelerate the translation of findings into clinical practice and public health policies.
Acknowledgments
We thank the Bill & Melinda Gates Foundation for their financial assistance in the writing of this manuscript and for sponsoring the open access fee.
Declarations
Funding
Funding from the Bill & Melinda Gates Foundation was received to assist with the preparation of the manuscript. The Bill & Melinda Gates Foundation is the sponsor of the open access fee.
Conflicts of Interest
Nicole U. Stoffel, Christophe Zeder, and Michael B. Zimmermann have no conflicts of interest that are directly relevant to the content of this article.
Ethics Approval
Not applicable.
Consent to Participate
Not applicable.
Consent for Publication
Not applicable.
Availability of Data and Material
Not applicable.
Code Availability
Not applicable.
Authors’ Contributions
NUS developed the concept and outline for the review; NUS, CZ, and MBZ wrote the first draft of the manuscript and edited the manuscript; all authors read and approved the final version.
References
- 1.WHO. Fact sheet: anemia. 2023. Available from https://www.who.int/news-room/fact-sheets/detail/anaemia. Accessed 17 July 2024.
- 2.IHME. Anemia: level 1 impairment. Global Health Metrics 2019. Available from https://www.healthdata.org/research-analysis/diseases-injuries-risks/factsheets/2021-anemia-level-1-impairment. Accessed 2 August 2024.
- 3.Hallberg L. Bioavailability of dietary iron in man. Annu Rev Nutr. 1981;1:123–47. [DOI] [PubMed] [Google Scholar]
- 4.van Dokkum W, Fairweather-Tait SJ, Hurrell R, et al. Study techniques. In: Mellon FA, Sandstrom B, editors. In stable isotopes in human nutrition. London: Academic Press; 1996. p. 23–42. [Google Scholar]
- 5.Wienk KJ, Marx JJ, Beynen AC. The concept of iron bioavailability and its assessment. Eur J Nutr. 1999;38(2):51–75. [DOI] [PubMed] [Google Scholar]
- 6.Fairweather-Tait SJ. Iron. J Nutr. 2001;131(4 Suppl.):1383S-1386S. [DOI] [PubMed] [Google Scholar]
- 7.Davidsson L, Haskell M. Bioavailability of micronutrients: stable isotope techniques to develop effective food-based strategies to combat micronutrient deficiencies. Food Nutr Bull. 2011;32(1 Suppl.):S24–30. [DOI] [PubMed] [Google Scholar]
- 8.Lynch MF, Griffin IJ, Hawthorne KM, et al. Iron absorption is more closely related to iron status than to daily iron intake in 12- to 48-mo-old children. J Nutr. 2007;137(1):88–92. [DOI] [PubMed] [Google Scholar]
- 9.Widdowson EM, McCance RA. The absorption and excretion of iron before, during and after a period of very high intake. Biochem J. 1937;31(11):2029–34. [DOI] [PMC free article] [PubMed] [Google Scholar]
- 10.McCance RA, Widdowson EM. The absorption and excretion of iron following oral and intravenous administration. J Physiol. 1938;94(1):148–54. [DOI] [PMC free article] [PubMed] [Google Scholar]
- 11.Nemeth E, Ganz T. Hepcidin and iron in health and disease. Annu Rev Med. 2023;74:261–77. [DOI] [PMC free article] [PubMed] [Google Scholar]
- 12.Lynch S, Pfeiffer CM, Georgieff MK, et al. Biomarkers of nutrition for development (BOND)—iron review. J Nutr. 2018;148(1):1001S–1067S. [DOI] [PMC free article] [PubMed] [Google Scholar]
- 13.Galy B, Conrad M, Muckenthaler M. Mechanisms controlling cellular and systemic iron homeostasis. Nat Rev Mol Cell Biol. 2024;25(2):133–55. [DOI] [PubMed] [Google Scholar]
- 14.Finch CA, Gibson JG, Peacock WC, et al. Iron metabolism; utilization of intravenous radioactive iron. Blood. 1949;4(8):905–27. [PubMed] [Google Scholar]
- 15.Finch CA, Deubelbeiss K, Cook JD, et al. Ferrokinetics in man. Medicine (Baltimore). 1970;49(1):17–53. [DOI] [PubMed] [Google Scholar]
- 16.Lowman JT, Krivit W. New in vivo tracer method with the use of nonradioactive isotopes and activation analysis. J Lab Clin Med. 1963;61:1042–8. [PubMed] [Google Scholar]
- 17.Barrett JF, Whittaker PG, Fenwick JD, et al. Comparison of stable isotopes and radioisotopes in the measurement of iron absorption in healthy women. Clin Sci (Lond). 1994;87(1):91–5. [DOI] [PubMed] [Google Scholar]
- 18.Turnlund JR. Use of enriched stable isotopes to determine bioavailability of trace elements in humans. Sci Total Environ. 1983;28:385–92. [DOI] [PubMed] [Google Scholar]
- 19.von Siebenthal HK, Moretti D, Zimmermann MB, et al. Effect of dietary factors and time of day on iron absorption from oral iron supplements in iron deficient women. Am J Hematol. 2023;98(9):1356–63. [DOI] [PubMed] [Google Scholar]
- 20.Bothwell TH, Finch CA. Iron metabolism. Boston, MA: Little Brown and Company; 1962. [Google Scholar]
- 21.Fomon SJ, Ziegler EE, Serfass RE, et al. Less than 80% of absorbed iron is promptly incorporated into erythrocytes of infants. J Nutr. 2000;130(1):45–52. [DOI] [PubMed] [Google Scholar]
- 22.Turnlund JR, Michel MC, Keyes WR, et al. Use of enriched stable isotopes to determine zinc and iron-absorption in elderly men. Am J Clin Nutr. 1982;35(5):1033–40. [DOI] [PubMed] [Google Scholar]
- 23.Martinez C, Fox T, Eagles J, et al. Evaluation of iron bioavailability in infant weaning foods fortified with haem concentrate. J Pediatr Gastroenterol Nutr. 1998;27(4):419–24. [DOI] [PubMed] [Google Scholar]
- 24.Minihane AM, Fairweather-Tait SJ. Effect of calcium supplementation on daily nonheme-iron absorption and long-term iron status. Am J Clin Nutr. 1998;68(1):96–102. [DOI] [PubMed] [Google Scholar]
- 25.Fairweather-Tait SJ, Balmer SE, Scott PH, et al. Lactoferrin and iron absorption in newborn infants. Pediatr Res. 1987;22(6):651–4. [DOI] [PubMed] [Google Scholar]
- 26.Bothwell TH, Mallett B, Oliver R, et al. Inability to assess absorption of iron from plasma radioiron curves. Br J Haematol. 1955;1(4):352–7. [DOI] [PubMed] [Google Scholar]
- 27.Zimmermann MB, Troesch B, Biebinger R, et al. Plasma hepcidin is a modest predictor of dietary iron bioavailability in humans, whereas oral iron loading, measured by stable-isotope appearance curves, increases plasma hepcidin. Am J Clin Nutr. 2009;90(5):1280–7. [DOI] [PubMed] [Google Scholar]
- 28.Hoppe M, Hulthen L, Hallberg L. The validation of using serum iron increase to measure iron absorption in human subjects. Br J Nutr. 2004;92(3):485–8. [DOI] [PubMed] [Google Scholar]
- 29.Troesch B, Egli I, Zeder C, et al. Fortification iron as ferrous sulfate plus ascorbic acid is more rapidly absorbed than as sodium iron EDTA but neither increases serum nontransferrin-bound iron in women. J Nutr. 2011;141(5):822–7. [DOI] [PubMed] [Google Scholar]
- 30.Husmann FMD, Stierli L, Bram DS, et al. Kinetics of iron absorption from ferrous fumarate with and without galacto-oligosaccharides determined from stable isotope appearance curves in women. Am J Clin Nutr. 2022;115(3):949–57. [DOI] [PMC free article] [PubMed] [Google Scholar]
- 31.Whittaker PG, Lind T, Williams JG. Iron-absorption during normal human-pregnancy: a study using stable isotopes. Br J Nutr. 1991;65(3):457–63. [DOI] [PubMed] [Google Scholar]
- 32.Paganini D, Uyoga MA, Cercamondi CI, et al. Consumption of galacto-oligosaccharides increases iron absorption from a micronutrient powder containing ferrous fumarate and sodium iron EDTA: a stable-isotope study in Kenyan infants. Am J Clin Nutr. 2017;106(4):1020–31. [DOI] [PubMed] [Google Scholar]
- 33.Cercamondi CI, Stoffel NU, Moretti D, et al. Iron homeostasis during anemia of inflammation: a prospective study of patients with tuberculosis. Blood. 2021;138(15):1293–303. [DOI] [PubMed] [Google Scholar]
- 34.Fomon SJ, Serfass RE, Nelson SE, et al. Time course of and effect of dietary iron level on iron incorporation into erythrocytes by infants. J Nutr. 2000;130(3):541–5. [DOI] [PubMed] [Google Scholar]
- 35.Scheuchzer P, Sinawat S, Donzé A-S, et al. Iron absorption from an iron-fortified follow-up formula with and without the addition of a synbiotic or a human-identical milk oligosaccharide: a randomized cross-over stable isotope study in young Thai children. J Nutr. 2024. 10.1016/j.tjnut.2024.08.016. [DOI] [PubMed] [Google Scholar]
- 36.Miller LL, Hahn PF. The appearance of radioactive iron as hemoglobin in the red cell: the significance of “easily split” iron. J Biol Chem. 1940;134(2):585–90. [Google Scholar]
- 37.Hahn PF, Ross JF, Bale WF, et al. The utilization of iron and the rapidity of hemoglobin formation in anemia due to blood loss. J Exp Med. 1940;71(6):731–6. [DOI] [PMC free article] [PubMed] [Google Scholar]
- 38.Zhang DL, Ghosh MC, Ollivierre H, et al. Ferroportin deficiency in erythroid cells causes serum iron deficiency and promotes hemolysis due to oxidative stress. Blood. 2018;132(19):2078–87. [DOI] [PMC free article] [PubMed] [Google Scholar]
- 39.Stoffel NU, Cercamondi CI, Brittenham G, et al. Iron absorption from oral iron supplements given on consecutive versus alternate days and as single morning doses versus twice-daily split dosing in iron-depleted women: two open-label, randomised controlled trials. Lancet Haematol. 2017;4(11):e524–33. [DOI] [PubMed] [Google Scholar]
- 40.Hackl LS, Abizari AR, Speich C, et al. Micronutrient-fortified rice can be a significant source of dietary bioavailable iron in schoolchildren from rural Ghana. Sci Adv. 2019;5(3):eaau0790. [DOI] [PMC free article] [PubMed] [Google Scholar]
- 41.Lynch SR, Cook JD. Interaction of vitamin C and iron. Ann N Y Acad Sci. 1980;355:32–44. [DOI] [PubMed] [Google Scholar]
- 42.Cook JD, Reddy MB. Effect of ascorbic acid intake on nonheme-iron absorption from a complete diet. Am J Clin Nutr. 2001;73(1):93–8. [DOI] [PubMed] [Google Scholar]
- 43.Hurrell R, Egli I. Iron bioavailability and dietary reference values. Am J Clin Nutr. 2010;91(5):1461S-S1467. [DOI] [PubMed] [Google Scholar]
- 44.Cook JD, Dassenko SA, Lynch SR. Assessment of the role of nonheme-iron availability in iron balance. Am J Clin Nutr. 1991;54(4):717–22. [DOI] [PubMed] [Google Scholar]
- 45.Hunt JR, Roughead ZK. Adaptation of iron absorption in men consuming diets with high or low iron bioavailability. Am J Clin Nutr. 2000;71(1):94–102. [DOI] [PubMed] [Google Scholar]
- 46.Andersen AB, Bonne TC, Hansen J, et al. Validation of a clinically applicable device for fast and accurate quantification of blood volume. J Clin Lab Anal. 2023;37(9–10):e24928. [DOI] [PMC free article] [PubMed] [Google Scholar]
- 47.Ertl AC, Diedrich A, Raj SR. Techniques used for the determination of blood volume. Am J Med Sci. 2007;334(1):32–6. [DOI] [PubMed] [Google Scholar]
- 48.Riley AA, Arakawa Y, Worley S, et al. Circulating blood volumes: a review of measurement techniques and a meta-analysis in children. ASAIO J. 2010;56(3):260–4. [DOI] [PubMed] [Google Scholar]
- 49.Maertzdorf WJ, Aldenhuyzen-Dorland W, Slaaf DW, et al. Circulating blood volume in appropriate and small for gestational age full term and preterm polycythaemic infants. Acta Paediatr Scand. 1991;80(6–7):620–7. [DOI] [PubMed] [Google Scholar]
- 50.Etcheverry P, Carstens GE, Brown E, et al. Production of stable-isotope-labeled bovine heme and its use to measure heme-iron absorption in children. Am J Clin Nutr. 2007;85(2):452–9. [DOI] [PubMed] [Google Scholar]
- 51.Linderkamp O, Versmold HT, Riegel KP, et al. Estimation and prediction of blood volume in infants and children. Eur J Pediatr. 1977;125(4):227–34. [DOI] [PubMed] [Google Scholar]
- 52.Brown E, Bradley B, Wennesland R, et al. Red cell, plasma, and blood volume in healthy women measured by radichromium cell-labeling and hematocrit. J Clin Invest. 1962;41(12):2182–90. [DOI] [PMC free article] [PubMed] [Google Scholar]
- 53.Wennesland R, Brown E, Hopper J, Jr., et al. Red cell, plasma and blood volume in healthy men measured by radiochromium (Cr51) cell tagging and hematocrit: influence of age, somatotype and habits of physical activity on the variance after regression of volumes to height and weight combined. J Clin Invest. 1959;38(7):1065–77. [DOI] [PMC free article] [PubMed] [Google Scholar]
- 54.Stoffel NU, Cepeda-Lopez AC, Zeder C, et al. Measurement of iron absorption and iron gains from birth to 6 months in breastfed and formula-fed infants using iron isotope dilution. Sci Adv. 2024;10(28):eado4262. [DOI] [PMC free article] [PubMed] [Google Scholar]
- 55.Fomon SJ, Nelson SE, Serfass RE, et al. Absorption and loss of iron in toddlers are highly correlated. J Nutr. 2005;135(4):771–7. [DOI] [PubMed] [Google Scholar]
- 56.Walczyk T, Davidsson L, Zavaleta N, et al. Stable isotope labels as a tool to determine the iron absorption by Peruvian school children from a breakfast meal. Fresenius J Anal Chem. 1997;359(4–5):445–9. [Google Scholar]
- 57.Turnlund JR, Keyes WR, Peiffer GL. Isotope ratios of molybdenum determined by thermal ionization mass spectrometry for stable isotope studies of molybdenum metabolism in humans. Anal Chem. 1993;65(13):1717–22. [DOI] [PubMed] [Google Scholar]
- 58.Cercamondi CI, Egli IM, Mitchikpe E, et al. Total iron absorption by young women from iron-biofortified pearl millet composite meals is double that from regular millet meals but less than that from post-harvest iron-fortified millet meals. J Nutr. 2013;143(9):1376–82. [DOI] [PMC free article] [PubMed] [Google Scholar]
- 59.Hosain F, Marsaglia G, Finch CA. Blood ferrokinetics in normal man. J Clin Invest. 1967;46(1):1–9. [DOI] [PMC free article] [PubMed] [Google Scholar]
- 60.Hunt JR. High-, but not low-bioavailability diets enable substantial control of women’s iron absorption in relation to body iron stores, with minimal adaptation within several weeks. Am J Clin Nutr. 2003;78(6):1168–77. [DOI] [PubMed] [Google Scholar]
- 61.Zimmermann MB, Fucharoen S, Winichagoon P, et al. Iron metabolism in heterozygotes for hemoglobin E (HbE), alpha-thalassemia 1, or beta-thalassemia and in compound heterozygotes for HbE/beta-thalassemia. Am J Clin Nutr. 2008;88(4):1026–31. [DOI] [PubMed] [Google Scholar]
- 62.Roe MA, Heath AL, Oyston SL, et al. Iron absorption in male C282Y heterozygotes. Am J Clin Nutr. 2005;81(4):814–21. [DOI] [PubMed] [Google Scholar]
- 63.Tondeur MC, Schauer CS, Christofides AL, al. Determination of iron absorption from intrinsically labeled microencapsulated ferrous fumarate (sprinkles) in infants with different iron and hematologic status by using a dual-stable-isotope method. Am J Clin Nutr. 2004;80(5):1436–44. [DOI] [PubMed] [Google Scholar]
- 64.Roughead ZK, Hunt JR. Adaptation in iron absorption: iron supplementation reduces nonheme-iron but not heme-iron absorption from food. Am J Clin Nutr. 2000;72(4):982–9. [DOI] [PubMed] [Google Scholar]
- 65.O’Brien KO, Zavaleta N, Caulfield LE, et al. Influence of prenatal iron and zinc supplements on supplemental iron absorption, red blood cell iron incorporation, and iron status in pregnant Peruvian women. Am J Clin Nutr. 1999;69(3):509–15. [DOI] [PubMed] [Google Scholar]
- 66.Doherty CP, Cox SE, Fulford AJ, et al. Iron incorporation and post-malaria anaemia. PLoS ONE. 2008;3(5):e2133. [DOI] [PMC free article] [PubMed] [Google Scholar]
- 67.International Atomic Energy Agency (IAEA). Assessment of iron bioavailability in humans using stable iron isotope techniques. IAEA human health series, vol. 21. Vienna: IAEA; 2012. ISSN 2075-3772.
- 68.Taylor P, Martinez-Torres C, Leets I, et al. Relationships among iron absorption, percent saturation of plasma transferrin and serum ferritin concentration in humans. J Nutr. 1988;118(9):1110–5. [DOI] [PubMed] [Google Scholar]
- 69.Walter T, Pizarro F, Abrams SA, et al. Bioavailability of elemental iron powder in white wheat bread. Eur J Clin Nutr. 2004;58(3):555–8. [DOI] [PubMed] [Google Scholar]
- 70.Hallberg L. Perspectives on nutritional iron deficiency. Annu Rev Nutr. 2001;21:1–21. [DOI] [PubMed] [Google Scholar]
- 71.Galetti V, Stoffel NU, Sieber C, et al. Threshold ferritin and hepcidin concentrations indicating early iron deficiency in young women based on upregulation of iron absorption. EClinicalMedicine. 2021;39: 101052. [DOI] [PMC free article] [PubMed] [Google Scholar]
- 72.Namaste SM, Rohner F, Huang J, et al. Adjusting ferritin concentrations for inflammation: Biomarkers Reflecting Inflammation and Nutritional Determinants of Anemia (BRINDA) project. Am J Clin Nutr. 2017;106(Suppl. 1):359S–371S. [DOI] [PMC free article] [PubMed] [Google Scholar]
- 73.Glahn RP, Cheng Z, Giri S. Extrinsic labeling of staple food crops with isotopic iron does not consistently result in full equilibration: revisiting the methodology. J Agric Food Chem. 2015;63(43):9621–8. [DOI] [PubMed] [Google Scholar]
- 74.Cook JD, Layrisse M, Martinez-Torres C, et al. Food iron absorption measured by an extrinsic tag. J Clin Invest. 1972;51(4):805–15. [DOI] [PMC free article] [PubMed] [Google Scholar]
- 75.Bjorn-Rasmussen E, Hallberg L, Walker RB. Food iron absorption in man. I. Isotopic exchange between food iron and inorganic iron salt added to food: studies on maize, wheat, and eggs. Am J Clin Nutr. 1972;25(3):317–23. [DOI] [PubMed] [Google Scholar]
- 76.Hertrampf E, Olivares M. Iron amino acid chelates. Int J Vitam Nutr Res. 2004;74(6):435–43. [DOI] [PubMed] [Google Scholar]
- 77.Sabatier M, Grathwohl D, Beaumont M, et al. The bioavailability of iron picolinate is comparable to iron sulfate when fortified into a complementary fruit yogurt: a stable iron isotope study in young women. Eur J Nutr. 2020;59(4):1371–8. [DOI] [PMC free article] [PubMed] [Google Scholar]
- 78.Mikulic N, Uyoga MA, Mwasi E, et al. Iron absorption is greater from apo-lactoferrin and is similar between holo-lactoferrin and ferrous sulfate: stable iron isotope studies in Kenyan infants. J Nutr. 2020;150(12):3200–7. [DOI] [PubMed] [Google Scholar]
- 79.Davila-Hicks P, Theil EC, Lonnerdal B. Iron in ferritin or in salts (ferrous sulfate) is equally bioavailable in nonanemic women. Am J Clin Nutr. 2004;80(4):936–40. [DOI] [PubMed] [Google Scholar]
- 80.Moretti D, Goede JS, Zeder C, et al. Oral iron supplements increase hepcidin and decrease iron absorption from daily or twice-daily doses in iron-depleted young women. Blood. 2015;126:1981–9. [DOI] [PubMed] [Google Scholar]
- 81.Stoffel NU, Zeder C, Brittenham GM, et al. Iron absorption from supplements is greater with alternate day than with consecutive day dosing in iron-deficient anemic women. Haematologica. 2020;105(5):1232–9. [DOI] [PMC free article] [PubMed] [Google Scholar]
- 82.Schrier SL. So you know how to treat iron deficiency anemia. Blood. 2015;126(17):1971. [DOI] [PubMed] [Google Scholar]
- 83.Stoffel NU, von Siebenthal HK, Moretti D, et al. Oral iron supplementation in iron-deficient women: how much and how often? Mol Aspects Med. 2020;75:100865. [DOI] [PubMed] [Google Scholar]
- 84.Zimmermann MB, Zeder C, Muthayya S, et al. Adiposity in women and children from transition countries predicts decreased iron absorption, iron deficiency and a reduced response to iron fortification. Int J Obes (Lond). 2008;32(7):1098–104. [DOI] [PubMed] [Google Scholar]
- 85.Cepeda-Lopez AC, Melse-Boonstra A, Zimmermann MB, et al. In overweight and obese women, dietary iron absorption is reduced and the enhancement of iron absorption by ascorbic acid is one-half that in normal-weight women. Am J Clin Nutr. 2015;102(6):1389–97. [DOI] [PubMed] [Google Scholar]
- 86.Cepeda-Lopez AC, Allende-Labastida J, Melse-Boonstra A, et al. The effects of fat loss after bariatric surgery on inflammation, serum hepcidin, and iron absorption: a prospective 6-mo iron stable isotope study. Am J Clin Nutr. 2016;104(4):1030–8. [DOI] [PubMed] [Google Scholar]
- 87.Stoffel NU, El-Mallah C, Herter-Aeberli I, et al. The effect of central obesity on inflammation, hepcidin, and iron metabolism in young women. Int J Obes (Lond). 2020;44(6):1291–300. [DOI] [PubMed] [Google Scholar]
- 88.Cercamondi CI, Egli IM, Ahouandjinou E, et al. Afebrile Plasmodium falciparum parasitemia decreases absorption of fortification iron but does not affect systemic iron utilization: a double stable-isotope study in young Beninese women. Am J Clin Nutr. 2010;92(6):1385–92. [DOI] [PMC free article] [PubMed] [Google Scholar]
- 89.McKay AKA, Anderson B, Peeling P, et al. Iron bsorption in highly trained male runners: does it matter when and where you eat your iron? Med Sci Sports Exerc. 2024;56(1):118–27. [DOI] [PubMed] [Google Scholar]
- 90.Barney DE, Ippolito JR, Berryman CE, et al. A prolonged bout of running increases hepcidin and decreases dietary iron absorption in trained female and male runners. J Nutr. 2022;152(9):2039–47. [DOI] [PubMed] [Google Scholar]
- 91.Moretti D, Mettler S, Zeder C, et al. An intensified training schedule in recreational male runners is associated with increases in erythropoiesis and inflammation and a net reduction in plasma hepcidin. Am J Clin Nutr. 2018;108(6):1324–33. [DOI] [PubMed] [Google Scholar]
- 92.Aguilar R, Moraleda C, Quinto L, et al. Challenges in the diagnosis of iron deficiency in children exposed to high prevalence of infections. PLoS ONE. 2012;7(11):e50584. [DOI] [PMC free article] [PubMed] [Google Scholar]
- 93.Phiri KS, Calis JC, Siyasiya A, et al. New cut-off values for ferritin and soluble transferrin receptor for the assessment of iron deficiency in children in a high infection pressure area. J Clin Pathol. 2009;62(12):1103–6. [DOI] [PMC free article] [PubMed] [Google Scholar]
- 94.Hashimoto F, Fujii Y, Toba M, et al. Determination of absorption and endogenous excretion of iron in man by monitoring fecal excretion of a stable iron isotope (58Fe). J Nutr Sci Vitaminol (Tokyo). 1992;38(5):435–49. [DOI] [PubMed] [Google Scholar]
- 95.Janghorbani M, Ting BT, Young VR. Absorption of iron in young men studied by monitoring excretion of a stable iron isotope (58Fe) in feces. J Nutr. 1980;110(11):2190–7. [DOI] [PubMed] [Google Scholar]
- 96.Green R, Charlton R, Seftel H, al. Body iron excretion in man: a collaborative study. Am J Med. 1968;45(3):336–53. [DOI] [PubMed] [Google Scholar]
- 97.Hunt JR, Zito CA, Johnson LK. Body iron excretion by healthy men and women. Am J Clin Nutr. 2009;89(6):1792–8. [DOI] [PubMed] [Google Scholar]
- 98.Speich C, Wegmuller R, Brittenham GM, et al. Measurement of long-term iron absorption and loss during iron supplementation using a stable isotope of iron ((57) Fe). Br J Haematol. 2021;192(1):179–89. [DOI] [PubMed] [Google Scholar]
- 99.Charlton RW, Fatti LP, Lynch SR, et al. Equilibration of tracer radioiron with body iron. Clin Sci (Lond). 1980;58(1):93–100. [DOI] [PubMed] [Google Scholar]
- 100.Finch CA, Huebers H. Perspectives in iron metabolism. N Engl J Med. 1982;306(25):1520–8. [DOI] [PubMed] [Google Scholar]
- 101.Hallberg L, Hulthen L, Garby L. Iron stores in man in relation to diet and iron requirements. Eur J Clin Nutr. 1998;52(9):623–31. [DOI] [PubMed] [Google Scholar]
- 102.Speich C, Brittenham GM, Cercamondi CI, et al. Isotopic measurement of iron requirements in sub-Saharan African children. Am J Clin Nutr. 2021;114(3):986–96. [DOI] [PubMed] [Google Scholar]
- 103.Fomon SJ, Drulis JM, Nelson SE, et al. Inevitable iron loss by human adolescents, with calculations of the requirement for absorbed iron. J Nutr. 2003;133(1):167–72. [DOI] [PubMed] [Google Scholar]
- 104.Cai J, Ren T, Zhang Y, et al. Iron physiological requirements in Chinese adults assessed by the stable isotope labeling technique. Nutr Metab (Lond). 2018;15:29. [DOI] [PMC free article] [PubMed] [Google Scholar]
- 105.Speich C, Mitchikpe CES, Cercamondi CI, et al. Direct assessment of body iron balance in women with and without iron supplementation using a long-term isotope dilution method in Benin and Switzerland. Am J Clin Nutr. 2021;113(6):1657–69. [DOI] [PubMed] [Google Scholar]
- 106.Stoffel NU, Zimmermann MB, Cepeda-Lopez AC, et al. Maternal iron kinetics and maternal-fetal iron transfer in normal-weight and overweight pregnancy. Am J Clin Nutr. 2022;115(4):1166–79. [DOI] [PMC free article] [PubMed] [Google Scholar]
- 107.Giorgetti A, Nyilima S, Stoffel NU, et al. Stable iron ((58)Fe) isotopic measurements in Kenyan toddlers during 3 months of iron supplementation demonstrate that half of the iron absorbed is lost. Br J Haematol. 2024;204(5):2057–65. [DOI] [PubMed] [Google Scholar]
- 108.Bjornrasmussen E, Hallberg L, Magnusson B, et al. Measurement of iron-absorption from composite meals. Am J Clini Nutr. 1976;29(7):772–8. [DOI] [PubMed] [Google Scholar]
- 109.Alcolombri U, Pioli R, Stocker R, et al. Single-cell stable isotope probing in microbial ecology. ISME Commun. 2022;2(1):55. [DOI] [PMC free article] [PubMed] [Google Scholar]
- 110.Amor M, Tharaud M, Gelabert A, et al. Single-cell determination of iron content in magnetotactic bacteria: implications for the iron biogeochemical cycle. Environ Microbiol. 2020;22(3):823–31. [DOI] [PMC free article] [PubMed] [Google Scholar]
- 111.Melczer M, Jimenez Lamana J, Justo-Vega A, et al. Multielement analysis of single red blood cells by single cell - inductively coupled plasma tandem mass spectrometry. Talanta. 2024;267:125226. [DOI] [PubMed] [Google Scholar]