

Abstract
Background and Objective
Tucatinib is a highly selective, oral, reversible, human epidermal growth factor receptor 2 (HER2)-specific tyrosine kinase inhibitor. Tucatinib is approved at a 300-mg twice-daily dose in adults in combination with trastuzumab and capecitabine for advanced HER2-postitive (HER2+) unresectable or metastatic breast cancer and in combination with trastuzumab for RAS wild-type HER2+ unresectable or metastatic colorectal cancer. This study sought to characterize the pharmacokinetics (PK) and assess sources of PK variability of tucatinib in healthy volunteers and in patients with HER2+ metastatic breast or colorectal cancers.
Methods
A population pharmacokinetic model was developed based on data from four healthy participant studies and three studies in patients with either HER2+ metastatic breast cancer or metastatic colorectal cancer using a nonlinear mixed-effects modeling approach. Clinically relevant covariates were evaluated to assess their impact on exposure, and overall model performance was evaluated by prediction-corrected visual predictive checks.
Results
A two-compartment pharmacokinetic model with linear elimination and first-order absorption preceded by a lag time adequately described tucatinib pharmacokinetic profiles in 151 healthy participants and 132 patients. Tumor type was identified as a significant covariate affecting tucatinib bioavailability and clearance, resulting in a 1.2-fold and 2.1-fold increase in tucatinib steady-state exposure (area under the concentration–time curve) in HER2+ metastatic colorectal cancer and HER2+ metastatic breast cancer, respectively, compared with healthy participants. No other covariates, including mild renal or hepatic impairment, had an impact on tucatinib pharmacokinetics.
Conclusions
The impact of statistically significant covariates identified was not considered clinically meaningful. No tucatinib dose adjustments are required based on the covariates tested in the final population pharmacokinetic model.
Clinical Trial Registration
NCT03723395, NCT03914755, NCT03826602, NCT03043313, NCT01983501, NCT02025192.
Supplementary Information
The online version contains supplementary material available at 10.1007/s40262-024-01412-0.
Key Points
| Tucatinib is a highly selective, oral, reversible, human epidermal growth factor receptor 2 (HER2)-specific tyrosine kinase inhibitor approved at a 300-mg twice-daily dose in adults in combination with trastuzumab and capecitabine for advanced HER2-postitive (HER2+) unresectable or metastatic breast cancer and in combination with trastuzumab for RAS wild-type HER2+ unresectable or metastatic colorectal cancer. |
| This population pharmacokinetic analysis was conducted to assess sources of tucatinib pharmacokinetic variability in healthy participants and in patients with HER2+ metastatic breast cancer or HER2+ metastatic colorectal cancer. |
| The final population pharmacokinetic model adequately described tucatinib concentration versus time profiles for healthy subjects and patients with HER2+ metastatic breast cancer or HER2+ metastatic colorectal cancer with no dose adjustments required based on the covariates tested. |
Introduction
Tucatinib is a highly selective, oral, reversible, small-molecule human epidermal growth factor receptor 2 (HER2)-specific tyrosine kinase inhibitor. Tucatinib is approved at a 300-mg twice-daily (BID) oral (PO) dose without regard to food in combination with trastuzumab and capecitabine in adult patients with advanced unresectable or metastatic HER2-postitive (HER2+) breast cancer (including those with brain metastases) who have received at least one prior anti-HER2-based regimen in the metastatic setting [1–3]. Its approval also includes the use of tucatinib 300 mg BID in combination with trastuzumab for the treatment of adult patients with RAS wild-type, HER2+ unresectable or metastatic colorectal cancer (mCRC) that has progressed after treatment with fluoropyrimidine-based, oxaliplatin-based, and irinotecan-based chemotherapy [4, 5].
The maximum tolerated dose of tucatinib was established as PO 300 mg BID in two previously conducted phase Ib studies in patients with HER2+ metastatic breast cancer (mBC), ONT-380-004 (NCT01983501, tucatinib + trastuzumab emtansine [T-DM1]) and ONT-380-005 (NCT02025192, tucatinib + trastuzumab + capecitabine) [6].
In the HER2CLIMB phase II study (ONT-380-206, NCT02614794), tucatinib was evaluated in combination with trastuzumab and capecitabine (tucatinib combination group) or placebo in HER2+ mBC after progression on trastuzumab, pertuzumab, and T-DM1 in any setting [7]. The final study results showed a significant improvement in overall survival (OS) in the tucatinib combination group when compared with the placebo combination group (trastuzumab and capecitabine) [1]. In the global MOUNTAINEER phase II, open-label study (SGNTUC-017, NCT03043313), the activity of tucatinib plus trastuzumab was assessed in patients with HER2+, RAS wild-type, chemotherapy-refractory, unresectable, or metastatic CRC. The tucatinib plus trastuzumab combination demonstrated favorable tolerability and clinically meaningful anti-tumor activity in this patient population [4]. A follow-up randomized, global, phase III study (MOUNTAINEER-03; NCT05253651) comparing the efficacy of tucatinib, trastuzumab, and modified FOLFOX6 in patients with HER2+ mCRC is currently ongoing.
Tucatinib is approved as either a 50-mg or 150-mg tablet and is rapidly absorbed after a single PO 300-mg dose with a median time to maximum observed plasma concentration (Tmax) of 1–2 h. Tucatinib is metabolized predominantly by the cytochrome P450 (CYP) 2C8 (75%) to the metabolite ONT-993 and to a lesser extent by CYP3A4 (10%), with the majority of tucatinib subsequently excreted in the feces (approximately 86% following a single oral dose of 300 mg of radiolabeled tucatinib) and only a minor amount recovered in urine (4.1%) [6, 8].
The pharmacokinetics (PK) of tucatinib have been evaluated in healthy participants in four phase I studies, which were included in this model development. Tucatinib exposure was highly variable in healthy participant studies and in patients with cancer [8–11]. Thus, the population pharmacokinetic (popPK) analysis described in this study was conducted to assess the sources of PK variability and any clinically relevant covariates in healthy participants and in patients with HER2+ mBC or HER2+ mCRC. The current analysis is based on four phase I studies in healthy participants, one phase II study in patients with HER2+ mCRC, and two phase I studies in patients with HER2+ mBC.
Methods
Study Populations and Clinical Data
This popPK analysis included data from seven phase I and phase II studies; four in healthy participants (studies ARRAY-380-103, ONT-380-012 [NCT03723395] [9], SGNTUC-015 [NCT03914755] [10], and SGNTUC-020 [NCT03826602] [11]), one in patients with HER2+ mCRC (study SGNTUC-017 [NCT03043313] [4]), and two in patients with HER2+ mBC (studies ONT-380-004 [NCT01983501] [12] and ONT-380-005 [NCT02025192]) (Table S1 of the Electronic Supplementary Material [ESM]). All studies were conducted in accordance with the Declaration of Helsinki and the International Conference of Harmonization Guideline for Good Clinical Practice. All studies were approved by an institutional review board or ethics committee at each site. All participants provided written informed consent for study-related treatments and procedures.
Data from HER2CLIMB (ONT-380-206) were not included in the popPK model development as time from the dose prior to the PK samples was not recorded, preventing determination of the time of the PK sample collection after the preceding dose. Data from the healthy participant studies only included tucatinib PK data from those administered the currently marketed tablet formulation in the fasted state. Population pharmacokinetic evaluable participants had received at least one tucatinib dose and had at least one measurable tucatinib concentration that included dose and sampling time information. ARRAY-380-103 was a study conducted in healthy participants to evaluate tucatinib PK following a 300-mg single PO dose comparing fasted and fed states, in combination with omeprazole and with a previous formulation (powder-in-capsule, not the approved formulation) [6]. ONT-380-012 was a drug–drug interaction study conducted in healthy participants evaluating tucatinib (300 mg PO single dose or BID) as a victim and perpetrator [9]. SGNTUC-015 was a study evaluating the PK of tucatinib between Caucasian and Japanese subjects at 50, 150, and 300 mg PO BID [10]. SGNTUC-020 was a study evaluating the impact of tucatinib (300 mg BID) as a perpetrator on metformin PK in healthy volunteers [11].
Base popPK Model
A nonlinear mixed-effects modeling approach was used for the popPK model. A two-compartment model with linear elimination and first-order absorption with lag time (Tlag) was developed. FOCE INTER was the primary method used for the estimation of model parameters.
Throughout model development, model diagnostic plots were used to assess the ability of the model to describe observed data. The plots included observed (DV) versus individual (IPRED) and population (PRED) predictions, as well as conditional/individual weighted residuals (CWRES/IWRES) and their absolute values versus PRED/IPRED. Diagnostic plot utility was dependent on a reasonable level of the inter-individual random effects and residual error. If shrinkage estimates were > 30%, plots based on random effects or residuals were interpreted cautiously.
Random Effects in the PopPK Model
The inter-individual random effects on the model parameters were introduced and retained when they did not cause model instability and when their estimates were not close to zero. They were modeled assuming a log-normal distribution described as follows:
where θki denoted the parameter value for the ith subject, θk denoted the typical parameter value, and ηki denoted the inter-individual random effect for the ith subject, assumed to have a mean of 0 and a variance
The vector of random effects (across the parameters indexed by k) had the covariance matrix Ω. Covariance matrix structures, including diagonal and blocked diagonal structures, were evaluated after the completion of covariate model building.
The residual error structure was assumed to follow an additive, proportional, or combined additive and proportional error model described as follows:
where Yij is the jth observed concentration for the ith subject, Cij is the corresponding predicted concentration, and (proportional) and (additive) are the residual errors under the assumption that ε~N (0, σ2). The residual error model was optimized until no trends were visible in the residual plots (in particular, absolute values of IWRES vs IPRED).
Covariates
Baseline covariates tested were focused mainly on clinically relevant covariates and included body weight, sex, race, tumor type, age, and albumin on apparent clearance (CL/F) and apparent central volume of distribution (Vc/F); creatinine clearance, National Cancer Institute liver dysfunction category, and Eastern Cooperative Oncology Group (ECOG) performance status on CL/F; sex and tumor type on relative bioavailability (Frel); and sex on first-order absorption rate constant (Ka). Tumor type was classified as no tumor, i.e., healthy participants (reference population), mBC, or mCRC. The CYP2C8-modifying drugs were prohibited in tucatinib studies and therefore not tested in the model. Creatinine clearance was calculated according to the Cockcroft–Gault equation [13]. Covariates included in the final model were required to be available in ≥ 80% of the participants, with a minimum of 15 in each categorical covariate category. Only one of any covariates with a correlation of > 0.5 was included in the formal analysis based on the level of clinical significance or influence.
Modest increases in serum creatinine have been reported in tucatinib clinical trials including the HER2CLIMB study (HER2+ mBC). The increases were reversible, were not clinically significant, and did not result in kidney damage or treatment discontinuation. In a phase I study (SGNTUC-020), tucatinib was shown to inhibit tubular secretion of creatinine through inhibition of the organic cation transporter 2 (OCT2) and multidrug and toxin extrusion (MATE) protein renal transporters, which may cause mild increases in serum creatinine that do not result from renal impairment [11]. Thus, only baseline creatinine was included as a covariate to assess the impact of renal impairment on tucatinib PK.
Given that the effect of food on tucatinib PK was not clinically meaningful, along with the limited number of fed participants available (ARRAY-380-103, n = 11), only fasted tablet data were included and food effect was not assessed in the current popPK model [14]. ARRAY-380-103 assessed the effect of food on tucatinib PK data from 11 participants either fasted or fed a standard high-fat meal 30 min prior to administration of 300 mg of tucatinib in a crossover design. A prandial state was found to only modestly influence tucatinib exposure. The mean area under the plasma concentration–time curve from time 0 extrapolated to infinity (AUC0-inf) after a high-fat meal was increased by 1.5-fold and the Tmax shifted from 1.5 to 4 h, while Cmax was not changed [14]; this was determined to be not clinically meaningful, and tucatinib may be administered without regard to food. In the remaining studies included in the current model, all participants received their doses either in the fasted state (studies in healthy participants) or in an unknown prandial state (studies in patients with cancer where they were instructed to take their doses with or without food). Therefore, the data for tucatinib administered in the fed state in Study ARRAY-380-103 were not sufficient to assess the food effect using the popPK analysis.
A univariable screening process was used to select parameter-covariate relationships that were to be tested in the stepwise covariate search. Each parameter-covariate relationship was added one at a time to the structural model, and only parameter-covariate relationships significant at the 0.05 level in this univariable screening step or that were deemed to be of clinical significance were taken forward into the full stepwise covariate search process.
In the stepwise covariate search, covariate-parameter relationships were assessed based on forward addition with a significance level of 0.01 and backward elimination with a significance level of 0.001. During the forward addition steps, covariate-parameter relationships were added one at a time if addition led to a statistically significant model improvement, starting with the most significant relationship first. Covariate-parameter relationships were removed one at a time during the backward elimination step if deletion led to insignificant model deterioration, starting with the most insignificant relationship first.
The mathematical structures of the covariate models are shown below: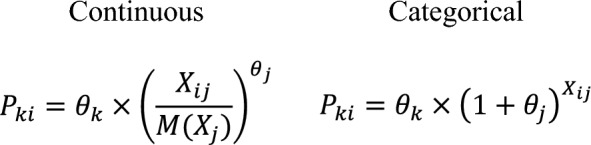 where Pki is the population estimate of the parameter Pk for subject i, Xij is the value of continuous covariate Xj for subject i (or an indicator variable for subject i for categorical covariate Xj with values of 1 for the non-reference category and 0 for the reference category), M(Xj) is the median of covariate Xj in the analysis dataset, θk is the typical value of the parameter Pk, and θj is a coefficient that reflects the effect of covariate Xj on the parameter.
Final PopPK Model
After covariate testing, alternative variance-covariance structures for Ω, including partial and full block structures, were evaluated. Suitable structures would provide a statistically significant (p < 0.001) improvement in the model objective function and improved model stability as measured by the condition number and/or a successful covariance step to arrive at the final model. The final popPK model criteria included successful minimization; no estimates close to the boundary; relative standard error of the estimates < 30% for fixed-effect parameters and < 50% for random-effect parameters.
Evaluation of the Final Model
A nonparametric bootstrap analysis, performed with 1000 replicates of the dataset generated by random sampling, was used to evaluate the stability of the final model and estimate confidence intervals (CIs) for model parameters [15]. Visual predictive checks were used for internal qualification and to evaluate the predictability of the final model [16]. Visual predictive checks were performed with prediction correction [17]. A total of 500 trial replicates were simulated using each participant’s observed covariates and dose regimens with simulated individual-specific, inter-individual, and residual variability.
PK Simulations
Simulations were performed using the final popPK model to predict typical PK parameters and covariate effects on tucatinib steady-state PK. Tucatinib disposition was found to be linear; therefore, the steady-state area under the plasma concentration–time curve (AUCss) was calculated using the following:
where Dose is tucatinib dose and CL/F is apparent clearance of tucatinib, incorporating any covariate effects on Frel. Steady-state tucatinib Cmax and trough concentration (Ctrough) were obtained from simulated steady-state concentration–time profiles using each individual’s post-hoc parameter estimates from the final model.
Simulations of concentration–time profiles over sufficient days of BID dosing to reach steady state were performed using typical model-estimated PK parameters without including between-subject variability or residual unexplained variability to assess time to steady-state and accumulation ratios. When the AUC over the last dosing interval was ≥ 98% of the theoretical AUCss, steady-state was assumed. Area under the plasma concentration–time curve accumulation ratio was calculated as the ratio of AUC from time 0–12 h (AUC0-12) at steady-state to AUC0-12 after the first dose. The Cmax and Ctrough accumulation ratios were calculated as the ratio of the simulated maximum and trough steady-state concentration to the corresponding values after first dose. Time to steady-state was the first day that Ctrough was ≥ 95% of the simulated steady-state Ctrough.
Software
NONMEM® versions 7.3.0 and 7.4.3 (ICON, Hanover, MD, USA) were used for popPK modeling, and the first-order conditional estimation with interaction algorithm was used for parameter estimation. R version 4.0.4 was used for simulations. SAS version 9.4 was used for data preparation. R versions 3.6.3 and 4.0.4 were used for graphical analysis, model diagnostics, and statistical summaries. Xpose® and Pearl speaks NONMEM (PsN®) version 4.8.1 (Department of Pharmacy, Uppsala University, Uppsala, Sweden) were used for model diagnostics and facilitation of tasks such as covariate testing and bootstrap.
Results
Data Summary
The dataset included 283 participants, with 151 (53.4%) healthy participants, 63 (22.3%) patients with HER2+ mBC, and 69 (24.4%) patients with HER2+ mCRC for a total of 3942 quantifiable observations. A summary of the categorical and continuous covariates for the population in each study is shown in Tables S2 and S3 of the ESM.
Base PopPK Model
The tucatinib base popPK model was a two-compartment model with linear elimination and first-order absorption with absorption Tlag. An additive and proportional residual model was selected. All parameters for the base model were precisely estimated with a relative standard error of ≤12%. Goodness-of-fit plots indicated an adequate fit to the data (Fig. S1 of the ESM). Parameter estimates for the final base popPK model are shown in Table S4 of the ESM.
Covariate Analysis
The covariate–parameter relationships taken into the stepwise covariate analysis included age, albumin, body weight, creatinine clearance, ECOG performance status, National Cancer Institute (NCI) hepatic dysfunction category, race, sex, and tumor type on CL/F; age, albumin, race, and tumor type on Vc/F; and sex and tumor type on Frel. The Ka-tumor-type relationship met the significance criteria for the univariable screening step with a p value of 0.0286; however, it was not included in the stepwise covariate analysis because of sparse HER2+ mCRC data and the fact that the estimated effect on absorption for HER2+ mBC was only a 2% increase in Ka.
Because physiological status can be altered in patients with cancer, the forward addition process was split into two sequential steps, a primary and a secondary forward addition step. The primary forward addition step included all the parameter-covariate relationships that were selected from the univariate screening step except for tumor type. The secondary step examined the effect of tumor type (healthy participants vs patients with HER2+ mBC vs patients with HER2+ mCRC) on tucatinib PK based on reports of tumor type-related PK differences in small-molecule cancer therapies [18–21]. A backward elimination step was performed after the secondary forward addition step. The covariate effects added to the model during the primary forward addition were sex on CL/F, albumin on Vc/F, NCI hepatic dysfunction category on CL/F, race on CL/F, and ECOG performance status on CL/F, in that order. All covariate effects, except for tumor type on CL/F and Frel, dropped out of the model during the backward elimination step. The objective function value decreased by 207.02 from the base model after backward elimination.
The model was refined by removing the effect of breast cancer on Frel, as it was poorly estimated with a relative standard error of 50.4% and an increase in objective function value. Next, a full between-subject variability covariance matrix was applied to the model, but it was not supported. In a final step, between-subject variability covariance was applied successfully between CL/F and Vc/F, resulting in a decrease of 21.1 in objective function value.
Final Model
The final tucatinib popPK model was a two-compartment model with linear elimination, first-order absorption with Tlag, effects of HER2+ mBC and HER2+ mCRC on CL/F, and an effect of HER2+ CRC on Frel. Goodness-of-fit plots for the final model indicated a good overall fit of the model to the observations and are presented in Fig. 1. The random-effects versus covariate plots for the final model showed no remaining covariate effects (data not shown).
Fig. 1.

Goodness-of-fit plots for the final tucatinib population pharmacokinetic model. Dots are individual data points, and red solid lines are smoothed LOESS lines. Dashed lines represent lines of identity in the observations versus predictions plots and y = 0 in the conditional weighted residual plots. GOF goodness of fit, LOESS locally estimated scatterplot smoothing
Table 1 presents the final model parameter estimates and the median and 95% CIs of the PK parameter estimates from 958 (95.8%) of 1000 bootstrap runs that minimized successfully. Median parameter estimates from the bootstrap were comparable to the parameter estimates of the final model, indicating the stability of the final tucatinib popPK model. Covariate effects were all statistically significant as the 95% CIs all excluded the null value.
Table 1.
Final model parameter and bootstrap estimates for the final tucatinib population PK model (successful minimization)
| Parameter | Final population PK model estimate (%RSE) | Bootstrap median estimate (95% CI) |
|---|---|---|
| CL/F (L/h), healthy participants | 112 (4.3) | 112 (105, 119) |
| Vc/F (L) | 125 (11.3) | 104 (62.4, 145) |
| Q/F (L/h) | 89.9 (5.4) | 83.4 (72.4, 97) |
| Vp/F (L) | 635 (4.0) | 659 (594, 740) |
| Ka (1/h) | 0.424 (5.3) | 0.385 (0.333, 0.453) |
| Tlag (h) | 0.392 (0.56) | 0.395 (0.385, 0.445) |
| Fractional change in CL/F in participants with HER2+ mBC | − 0.519 (6.3) | − 0.523 (− 0.578, − 0.456) |
| Fractional change in CL/F in participants with HER2+ mCRC | − 0.705 (3.6) | − 0.730 (− 0.819, − 0.618) |
| Fractional change in Frel in participants with HER2+ mCRC | − 0.637 (3.8) | − 0.673 (− 0.789, − 0.512) |
| BSV | ||
| BSV CV CL/F | 45% (4.6) | 43.6% (39.2, 49.5) |
| BSV CV Vc/F | 135% (5.7) | 160% (122, 221) |
| BSV CV Vp/F | 42.2% (7.4) | 50.9% (36.9, 67.8) |
| BSV CV Q/F | 43.9% (7.6) | 55.1% (39.4, 73.7) |
| BSV correlations | ||
| Cov (CL/F, Vc/F) | 0.470 (6.8) | 0.274 (0.0326, 0.507) |
| Residual variability | ||
| Additive residual error SD (ng/mL) | 1.07 (2.14) | 1.06 (0.0693, 1.57) |
| Proportional residual error CV | 0.329 (0.73) | 0.326 (0.309, 0.343) |
Bootstrap results were calculated from 958 successful runs out of 1000. BSV CV% is calculated as sqrt(exp(variance) − 1) × 100%. The reference participant is a healthy participant
BSV between-subject variability, CI confidence interval, CL/F apparent clearance, Cov(X,Y) X, Y covariance, CV coefficient of variation, Frel relative bioavailability, h hour, HER2+ human epidermal growth factor 2 positive, Ka first-order absorption rate constant, mBC metastatic breast cancer, mCRC metastatic colorectal cancer, PK pharmacokinetic, Q/F apparent intercompartmental clearance, RSE relative standard error, SD standard deviation, Tlag lag time, Vc/F apparent central volume, Vp/F apparent peripheral volume of distribution
The model-estimated effects of tumor type predicted that patients with HER2+ mBC have a 51.9% lower clearance and, therefore, a lower CL/F compared with healthy participants. In addition, patients with HER2+ mCRC have a 70.5% lower clearance and 63.7% lower Frel relative to healthy participants, resulting in an 18.7% lower CL/F. The visual predictive check plot (Fig. 2) shows that the final tucatinib popPK model adequately predicted the central tendency and variability of plasma tucatinib concentrations.
Fig. 2.

Prediction-corrected visual predictive check of the final tucatinib population pharmacokinetic model (linear). Black circles represent observed data points. The black solid line is the observed median, and the black dashed lines are the observed 5th and 95th percentiles. The blue line and blue-shaded region represent the simulated median and corresponding 95% confidence interval, respectively. The red lines represent the simulated 5th and 95th percentiles, which are the lower and upper bounds, respectively, of the simulated PI. The red-shaded areas are the 95% confidence intervals of the simulated 5th and 95th percentiles. PI prediction interval
Disease Effects on Tucatinib Pharmacokinetics
Patients with HER2+ mBC were predicted to have a higher tucatinib exposure compared with healthy participants with AUCss and Cmax ratios (90% CI) of 2.1 (1.9, 2.3) and 1.6 (1.5, 1.7), respectively. Patients with HER2+ mCRC were also predicted to have a higher tucatinib exposure compared with healthy participants with an AUCss ratio (90% CI) of 1.2 (1.0, 1.4). Patients with HER2+ mCRC were predicted to have a lower Cmax ratio (90% CI) relative to healthy participants of 0.8 (0.7, 0.9) due to model-predicted reduced bioavailability of tucatinib in patients with HER2+ mCRC. Mild renal or hepatic impairment had no effect on tucatinib PK. Insufficient data prevented the evaluation of moderate or severe renal or hepatic impairment on the PK of tucatinib in the popPK analysis.
Figure 3 compares the distribution of model-predicted CL/F in patients with HER2+ mBC and HER2+ mCRC. Patients with HER2+ mCRC had a higher model-predicted CL/F with a geometric mean of 89.0 L/h compared with patients with HER2+ mBC with a geometric mean of 53.4 L/h. The CL/F for HER2+ mCRC incorporated the effect of HER2+ mCRC on Frel.
Fig. 3.

Tucatinib clearance stratified by tumor type. GM geometric mean, N number of participants
Although model-predicted tucatinib PK parameters and steady-state exposures for patients with HER2+ mBC and HER2+ mCRC overlapped, lower exposures were predicted for patients with HER2+ mCRC compared with patients with HER2+ mBC, reflective of the higher CL/F (a factor of the impact on both CL and Frel) in patients with HER2+ mCRC (Table 2). The median terminal half-life was 16.2 and 21.3 h for patients with HER2+ mBC and HER2+ mCRC, respectively. The estimated effective half-life based on the geometric mean AUC accumulation ratios [22] was 11.9 and 16.4 h, for patients with HER2+ mBC and HER2+ mCRC, respectively.
Table 2.
Model-predicted pharmacokinetic parameters and steady-state exposure measures of tucatinib in healthy participants and patients with HER2+ mCRC and HER2+ mBC receiving a starting dose of 300 mg BID
| HER2+ mBC N = 52 |
HER2+ mCRC N = 68 |
Healthy participants (300 mg BID) N = 128 |
||||
|---|---|---|---|---|---|---|
| Median [min, max] | Geometric mean (%CV) | Median [min, max] | Geometric mean (%CV) | Median [min, max] | Geometric mean (%CV) | |
| AUCss (ng·h/mL) | 5770 [2100, 14,200] | 5620 (42.7) | 3230 [1310, 9210] | 3370 (48.7) | 2730 [541, 5760] | 2560 (42.3) |
| Cmax,ss (ng/mL) | 759 [221, 1840] | 747 (44.5) | 402 [141, 960] | 405 (44.9) | 480 [59, 1120] | 447 (43.8) |
| Ctrough,ss (ng/mL) | 303 [102, 870] | 288 (58.5) | 188 [42.9, 675] | 197 (62.5) | 88.4 [20.3, 263] | 84 (60.2) |
| Rac, AUC | 1.94 [1.36, 4.59] | 1.99 (26.4) | 2.45 [1.38, 5.32] | 2.51 (27.9) | 1.34 [1.13, 2.38] | 1.35 (11.3) |
| Rac, Cmax | 1.59 [1.14, 3.99] | 1.64 (24.9) | 1.92 [1.16, 3.53] | 1.95 (25.1) | 1.19 [1.07, 2.12] | 1.21 (8.72) |
| Rac, Ctrough | 2.38 [1.49, 5.94] | 1.64 (24.9) | 2.96 [1.94, 6.81] | 1.95 (25.1) | 1.57 [1.23, 2.76] | 1.63 (18.8) |
| CL/F (L/h) | 52 [21.2, 143] | 53.4 (42.7) | 92.9 [32.6, 230] | 89 (48.7) | 110 [52.1, 555] | 117 (42.3) |
| Vss/F (L) | 838 [257, 2190] | 903 (42.2) | 2130 [1680, 4690] | 829 (20.9) | 752 [409, 5650] | 793 (38) |
| T1/2, β (h) | 16.2 [7.48, 58.9] | 16.7 (41.6) | 21.3 [11.9, 53.5] | 23.1 (32.6) | 8.76 [5.22, 21] | 9.16 (32.4) |
AUC area under the concentration–time curve, AUCss area under the concentration–time curve at steady state, BID twice daily, Cmax maximum concentration, Cmax,ss maximum concentration at steady-state, CL/F apparent clearance, Ctrough trough concentration, Ctrough,ss trough concentration at steady-state, CV coefficient of variation, h hour, HER2+ human epidermal growth factor 2 positive, max maximum, mBC metastatic breast cancer, mCRC metastatic colorectal cancer, min minimum, N number of participants, Rac accumulation ratio, T1/2, β terminal half-life, Vss/F apparent steady-state volume of distribution
Discussion
A popPK model was developed for tucatinib, combining data from seven clinical studies including healthy participants and patients with HER2+ mBC and HER2+ mCRC. A two-compartment model with linear elimination and first-order absorption preceded by a Tlag adequately described tucatinib PK profiles. Disease status was identified as a significant covariate on tucatinib PK parameters (bioavailability and CL) resulting in a 1.22-fold and 2.1-fold increase in tucatinib steady-state exposures (AUCss) in HER2+ mCRC and HER2+ mBC, respectively, compared with healthy participants. Patients with HER2+ mCRC were predicted to have a lower Cmax ratio (90% CI) for tucatinib relative to healthy participants of 0.80 (0.66, 0.93). No other covariates, including mild renal and hepatic impairment, had an impact on tucatinib PK.
Some limitations of this study include the fact that only sparse PK data were available for the phase II SGNTUC-017 study in HER2+ mCRC and observed PK in ONT-380-004 and ONT-380-005 was only collected up to 6 h post-dose (potentially leading to an exaggerated effect on exposure due to extrapolation from 6 to 12 h post-dose). While it is not likely that the structure of the popPK model is different in patients with HER2+ mCRC or mBC, the sparse data did not permit evaluation of other popPK model structures in these populations. In addition, the dosing history in the SGNTUC-017 study was mostly from patient-reported diaries, which can be unreliable.
Tucatinib is a moderately lipophilic base that exhibits a high degree of plasma protein binding. In a ‘fit-for-purpose’ physiologically-based PK model (PBPK) used to characterize clinical exposure of tucatinib in healthy participants, a first-order absorption model with a Tlag was used to predict oral absorption kinetics; Ka for tucatinib was manually optimized based on observed healthy participant data. Overall, the Tlag and Ka values in the physiologically-based PK study (Tlag = 0.5 h; Ka = 0.6 h−1) [6] were in agreement with the values obtained in this popPK model (Tlag = 0.4 h; Ka = 0.4 h−1). Although both models generally predicted the mean tucatinib oral absorption profiles well using the first-order absorption models with a Tlag, the high degree of inter-individual variability in healthy participants was captured and was even more pronounced in patients with cancer. Healthy participant studies that also looked at parent-to-metabolite ratios for the predominant metabolite (ONT-993, formed via CYP2C8) were unable to conclusively show that differences in CYP2C8 metabolism (including during first-pass absorption) could account for the high variability in tucatinib Cmax [8, 9]. The effect of food on the PK of tucatinib is not clinically meaningful and would not account for the observed variability even in those with unknown prandial states [14].
PK differences in healthy participants versus patients with cancer have been demonstrated for other targeted cancer therapies [19]. For example, a decrease in bioavailability in patients with gastric cancers and a decrease in clearance in patients with cancer in general compared with healthy participants have been demonstrated for the small-molecule tyrosine kinase inhibitor apatinib [18]. In addition, cabozantinib and motesanib clearance is higher in certain types of cancer [20, 21].
The results of this popPK analysis that mild hepatic impairment did not have an effect on tucatinib PK were consistent with previous results [23]. The recommended dose for patients with severe hepatic impairment is 200 mg BID [14].
In summary, despite high variability in tucatinib exposures in patients, tucatinib has demonstrated efficacy at the same approved 300-mg dose in combination with trastuzumab and capecitabine in patients with prior-treated HER2+ breast cancer with brain metastases [2] and in combination with trastuzumab in patients with mCRC [4]. Additionally, exposure–response analyses in the HER2CLIMB (HER2+ mBC) study showed no clear correlations between safety events and tucatinib exposure [14]. None of the covariates investigated in this analysis requires tucatinib dose adjustment. It has also been demonstrated that no dose adjustment is needed in patients with mild or moderate hepatic impairment; however, the prescribing information suggests a reduced dose of 200 mg BID in patients with severe hepatic impairment [8]. Findings from SGNTUC-015 demonstrated similar tucatinib PK in Japanese and Caucasian participants at all doses tested, suggesting that there is no need for tucatinib dose adjustment based on ethnicity [10]. The linear PK assumed for the present analysis is further supported by findings from SGNTUC-015 [10].
Conclusions
Tucatinib is a highly selective, oral, reversible, small-molecule HER2-specific tyrosine kinase inhibitor approved at a 300-mg BID dose in adults in combination with trastuzumab and capecitabine for advanced HER2+ unresectable breast cancer or mBC and in combination with trastuzumab for RAS wild-type HER2+ unresectable colorectal cancer or mCRC. The final popPK model adequately captured tucatinib exposures and PK parameters for healthy subjects and patients with HER2+ mBC or mCRC. No dose adjustments are required based on the covariates tested.
Supplementary Information
Below is the link to the electronic supplementary material.
Acknowledgements
Medical writing support was provided by Amy C. Porter, Ph.D., CMPPTM, and Linda J. Cornfield, Ph.D., of Certara Synchrogenix under the direction of the authors in accordance with Good Publication Practice guidelines (Ann Intern Med. 2015; 163:461–4) and was funded by Pfizer Inc.
Declarations
Funding
This study was sponsored by Seagen, which was acquired by Pfizer Inc. in December 2023.
Conflict of interest
Daping Zhang, Christopher J. Endres, and Ariel Topletz-Erickson are employees of Pfizer Inc. Adekemi Taylor and Jie Janet Zhao are employees of Certara USA, which was a paid consultant to Pfizer Inc. in connection with the development of this manuscript.
Ethics approval
All studies were conducted in accordance with the Declaration of Helsinki and the International Conference of Harmonization Guideline for Good Clinical Practice. All studies were approved by an institutional review board or ethics committee at each site.
Consent to participate
All participants provided written informed consent for study-related treatments and procedures.
Consent for publication
Not applicable.
Availability of data and material
Upon request, and subject to review, Pfizer Inc. will provide the data that support the findings of this study. Subject to certain criteria, conditions, and exceptions, Pfizer Inc. may also provide access to the related individual de-identified participant data. See https://www.pfizer.com/science/clinical-trials/trial-data-and-results for more information.
Code availability
The model code is available in the supplemental material.
Authors’ contributions
All authors contributed to the analysis and interpretation of data. All authors contributed to critical reviews and revisions of the article and provided their final approval for publication.
Footnotes
The original online version of this article was revised to correct an entry in Table 2.
Change history
11/27/2024
The original online version of this article was revised to correct an entry in Table 2.
Change history
12/11/2024
A Correction to this paper has been published: 10.1007/s40262-024-01458-0
References
- 1.Curigliano G, Mueller V, Borges V, Hamilton E, Hurvitz S, Loi S, et al. Tucatinib versus placebo added to trastuzumab and capecitabine for patients with pretreated HER2+ metastatic breast cancer with and without brain metastases (HER2CLIMB): final overall survival analysis. Ann Oncol. 2022;33(3):321–9. 10.1016/j.annonc.2021.12.005. [DOI] [PubMed] [Google Scholar]
- 2.Lin NU, Borges V, Anders C, Murthy RK, Paplomata E, Hamilton E, et al. Intracranial efficacy and survival with tucatinib plus trastuzumab and capecitabine for previously treated HER2-positive breast cancer with brain metastases in the HER2CLIMB trial. J Clin Oncol. 2020;38(23):2610–9. 10.1200/jco.20.00775. [DOI] [PMC free article] [PubMed] [Google Scholar]
- 3.Lin NU, Murthy RK, Abramson V, Anders C, Bachelot T, Bedard PL, et al. Tucatinib vs placebo, both in combination with trastuzumab and capecitabine, for previously treated erbb2 (HER2)-positive metastatic breast cancer in patients with brain metastases: updated exploratory analysis of the HER2CLIMB randomized clinical trial. JAMA Oncol. 2023;9(2):197–205. 10.1001/jamaoncol.2022.5610. [DOI] [PMC free article] [PubMed] [Google Scholar]
- 4.Strickler JH, Cercek A, Siena S, André T, Ng K, Van Cutsem E, et al. Tucatinib plus trastuzumab for chemotherapy-refractory, HER2-positive, RAS wild-type unresectable or metastatic colorectal cancer (MOUNTAINEER): a multicentre, open-label, phase 2 study. Lancet Oncol. 2023;24(5):496–508. 10.1016/s1470-2045(23)00150-X. [DOI] [PubMed] [Google Scholar]
- 5.Casak SJ, Horiba MN, Yuan M, Cheng J, Lemery SJ, Shen YL, et al. FDA approval summary: tucatinib with trastuzumab for advanced unresectable or metastatic, chemotherapy refractory, HER2 positive RAS wild type colorectal cancer. Clin Cancer Res. 2023;29(21):4326–30. 10.1158/1078-0432.Ccr-23-1041. [DOI] [PMC free article] [PubMed] [Google Scholar]
- 6.CDER. NDA/BLA multi-disciplinary review and evaluation: NDA 213411 (tucatinib). 2020. https://www.accessdata.fda.gov/drugsatfda_docs/nda/2020/213411Orig1s000MultidisciplineR.pdf. Accessed 21 Aug 2024.
- 7.Murthy RK, Loi S, Okines A, Paplomata E, Hamilton E, Hurvitz SA, et al. Tucatinib, trastuzumab, and capecitabine for HER2-positive metastatic breast cancer. N Engl J Med. 2020;382(7):597–609. 10.1056/NEJMoa1914609. [DOI] [PubMed] [Google Scholar]
- 8.Topletz-Erickson AR, Lee AJ, Mayor JG, Sun H, Abdulrasool LI, Rustia EL, et al. The pharmacokinetics and safety of tucatinib in volunteers with hepatic impairment. Clin Pharmacokinet. 2022;61(12):1761–70. 10.1007/s40262-022-01183-6. [DOI] [PMC free article] [PubMed] [Google Scholar]
- 9.Topletz-Erickson A, Lee A, Rustia EL, Sun H, Mayor JG, Abdulrasool LI, et al. Evaluation of safety and clinically relevant drug-drug interactions with tucatinib in healthy volunteers. Clin Pharmacokinet. 2022;61(10):1417–26. 10.1007/s40262-022-01144-z. [DOI] [PMC free article] [PubMed] [Google Scholar]
- 10.Topletz-Erickson AR, Lee AJ, Mayor J, Liu H, Abdulrasool LI, Walker L, et al. Pharmacokinetics and safety of tucatinib in healthy Japanese and Caucasian volunteers: results from a phase I study. Jpn J Clin Pharmacol Ther. 2023;54(5):187–96. [Google Scholar]
- 11.Topletz-Erickson AR, Lee AJ, Mayor JG, Rustia EL, Abdulrasool LI, Wise AL, et al. Tucatinib inhibits renal transporters oct2 and mate without impacting renal function in healthy subjects. J Clin Pharmacol. 2021;61(4):461–71. 10.1002/jcph.1750. [DOI] [PMC free article] [PubMed] [Google Scholar]
- 12.Borges VF, Ferrario C, Aucoin N, Falkson C, Khan Q, Krop I, et al. Tucatinib combined with ado-trastuzumab emtansine in advanced erbb2/HER2-positive metastatic breast cancer: a phase 1b clinical trial. JAMA Oncol. 2018;4(9):1214–20. 10.1001/jamaoncol.2018.1812. [DOI] [PMC free article] [PubMed] [Google Scholar]
- 13.Cockcroft DW, Gault MH. Prediction of creatinine clearance from serum creatinine. Nephron. 1976;16(1):31–41. 10.1159/000180580. [DOI] [PubMed] [Google Scholar]
- 14.US FDA. Tucatinib product label. 2023. https://www.accessdata.fda.gov/drugsatfda_docs/label/2023/213411s004lbl.pdf. Accessed 21 Aug 2024.
- 15.Yafune A, Ishiguro M. Bootstrap approach for constructing confidence intervals for population pharmacokinetic parameters. I: a use of bootstrap standard error. Stat Med. 1999;18(5):581–99. 10.1002/(sici)1097-0258(19990315)18:5%3c581::aid-sim47%3e3.0.co;2-1. [DOI] [PubMed] [Google Scholar]
- 16.Karlsson MO, Savic RM. Diagnosing model diagnostics. Clin Pharmacol Ther. 2007;82(1):17–20. 10.1038/sj.clpt.6100241. [DOI] [PubMed] [Google Scholar]
- 17.Bergstrand M, Hooker AC, Wallin JE, Karlsson MO. Prediction-corrected visual predictive checks for diagnosing nonlinear mixed-effects models. AAPS J. 2011;13(2):143–51. 10.1208/s12248-011-9255-z. [DOI] [PMC free article] [PubMed] [Google Scholar]
- 18.Yu M, Gao Z, Dai X, Gong H, Zhang L, Chen X, et al. Population pharmacokinetic and covariate analysis of apatinib, an oral tyrosine kinase inhibitor, in healthy volunteers and patients with solid tumors. Clin Pharmacokinet. 2017;56(1):65–76. 10.1007/s40262-016-0427-y. [DOI] [PubMed] [Google Scholar]
- 19.Reyner E, Lum B, Jing J, Kagedal M, Ware JA, Dickmann LJ. Intrinsic and extrinsic pharmacokinetic variability of small molecule targeted cancer therapy. Clin Transl Sci. 2020;13(2):410–8. 10.1111/cts.12726. [DOI] [PMC free article] [PubMed] [Google Scholar]
- 20.Lu JF, Claret L, Sutjandra L, Kuchimanchi M, Melara R, Bruno R, et al. Population pharmacokinetic/pharmacodynamic modeling for the time course of tumor shrinkage by motesanib in thyroid cancer patients. Cancer Chemother Pharmacol. 2010;66(6):1151–8. 10.1007/s00280-010-1456-0. [DOI] [PubMed] [Google Scholar]
- 21.Lacy S, Yang B, Nielsen J, Miles D, Nguyen L, Hutmacher M. A population pharmacokinetic model of cabozantinib in healthy volunteers and patients with various cancer types. Cancer Chemother Pharmacol. 2018;81(6):1071–82. 10.1007/s00280-018-3581-0. [DOI] [PMC free article] [PubMed] [Google Scholar]
- 22.Boxenbaum H, Battle M. Effective half-life in clinical pharmacology. J Clin Pharmacol. 1995;35(8):763–6. 10.1002/j.1552-4604.1995.tb04117.x. [DOI] [PubMed] [Google Scholar]
- 23.Topletz-Erickson AR, Lee A, Mayor JG, Sun H, Abdulrasool LI, Rustia EL, et al. Abstract 1371: pharmacokinetics of tucatinib in healthy and hepatically-impaired volunteers. Cancer Res. 2021;81(13_Suppl):1371. 10.1158/1538-7445.Am2021-1371. [Google Scholar]
Associated Data
This section collects any data citations, data availability statements, or supplementary materials included in this article.