

Abstract
Capsule endoscopy (CE) is non-invasive and painless during gastrointestinal examination. However, capsule endoscopy can increase the workload of image reviewing for clinicians, making it prone to missed and misdiagnosed diagnoses. Current researches primarily concentrated on binary classifiers, multiple classifiers targeting fewer than four abnormality types and detectors within a specific segment of the digestive tract, and segmenters for a single type of anomaly. Due to intra-class variations, the task of creating a unified scheme for detecting multiple gastrointestinal diseases is particularly challenging. A cascade neural network designed in this study, Cascade-EC, can automatically identify and localize four types of gastrointestinal lesions in CE images: angiectasis, bleeding, erosion, and polyp. Cascade-EC consists of EfficientNet for image classification and CA_stm_Retinanet for lesion detection and location. As the first layer of Cascade-EC, the EfficientNet network classifies CE images. CA_stm_Retinanet, as the second layer, performs the target detection and location task on the classified image. CA_stm_Retinanet adopts the general architecture of Retinanet. Its feature extraction module is the CA_stm_Backbone from the stack of CA_stm Block. CA_stm Block adopts the split-transform-merge strategy and introduces the coordinate attention. The dataset in this study is from Shanghai East Hospital, collected by PillCam SB3 and AnKon capsule endoscopes, which contains a total of 7936 images of 317 patients from the years 2017 to 2021. In the testing set, the average precision of Cascade-EC in the multi-lesions classification task was 94.55%, the average recall was 90.60%, and the average F1 score was 92.26%. The mean mAP@ 0.5 of Cascade-EC for detecting the four types of diseases is 85.88%. The experimental results show that compared with a single target detection network, Cascade-EC has better performance and can effectively assist clinicians to classify and detect multiple lesions in CE images.
Keywords: Capsule endoscopy, Lesion detection and location, Cascade-EC, Split-transform-merge strategy
Introduction
According to the statistics of the World Health Organization, gastrointestinal diseases have posed a great threat to human health. More than 10 million patients die of gastrointestinal diseases every year [1]. Early detection, diagnosis, and treatment of digestive tract diseases are the key to prevent their further deterioration. As an invasive examination method, traditional gastrointestinal endoscopy is often accompanied by nausea and pain. Therefore, patients are not willing to take the initiative to check, which leads to the development of gastrointestinal diseases. The small intestine is the largest immune organ of the human body. At the same time, the small bowel structure is complex, curved, and long. The operation of enteroscopy is complex, making it difficult to detect small intestinal diseases. Capsule endoscopy (CE) is a new non-invasive examination method with small volume [2]. It is swallowed and achieves full examination of the digestive tract by the gastrointestinal peristalsis. A complete examination of capsule endoscopy takes about 8 h to produce about 60,000 pictures [3]. Clinicians review the recorded images through the image workstation, and then make a diagnosis of diseases. Among the massive images, the number of images containing lesions is very small. In order to reduce missed diagnosis and misdiagnosis, medical staff usually have to check repeatedly, which is heavy workload and inefficient.
In recent years, more and more researchers have used artificial intelligence–assisted diagnosis to automatically detect the lesions of CE images. This reduces the time for clinicians to read images and improves the diagnostic efficiency. Samir Jain et al. have made numerous achievements in the field of automatic classification [4, 5], segmentation [6, 7], and localization of gastrointestinal anomalies [8] in CE images. The study by Samir Jain et al. [4] utilizes a random forest ensemble-based classifier to detect abnormal images of CE. Additionally, a CNN with meta-feature learning [5] is introduced for CE image classification, allowing for extracting a rich pool of meaningful features by using diverse convolution operations. The CNN effectively categorizes CE images as either normal or abnormal by managing intra-class variability. Furthermore, the localization of polyps is examined by analyzing four prominent deep learning–based segmentation models—UNet, SegNet, PSPNet, and fully convolutional network—on the CVC-ClinicDB and ETIS-Larib datasets [6]. The proposed CoInNet model [7] for polyp segmentation leverages convolution and involution operations to enhance the learning of feature map relationships via a statistical feature attention unit. Additionally, the WCENet model [8], based on a deep CNN, is presented for the automatic identification and localization of polyps, vascular, and inflammation in CE images. Shanhui Fan et al. [9] changed the multiplex output of AlexNet to bidirectional output to indicate the lesion and normal tissue, and detected the ulcer and erosion lesion respectively. Jang Hyung Lee et al. [10] conducted transfer learning and fine-tuning on the three networks of Perception, ResNet, and VGGNet, and constructed three independent binary classifiers. They were used to classify normal and ulcer, normal and cancer, and cancer and ulcer respectively. The results showed that the normal and abnormal images were easy to distinguish, while the ulcer and cancer with high similarity were difficult to distinguish from each other in appearance. Yan Wang et al. [11] proposed a multi-classification method for colonoscopy images. Transferring learning for AlexNet, VGGNet, and ResNet networks was used to classify polyps, inflammation, tumors, and normal images. Keita Otani et al. [12] proposed an artificial intelligence system based on Retinanet and SSD network to detect erosion, ulcer, vascular, and tumors in endoscopic images. Chanting Cao et al. [13] proposed a feature extraction fusion module with YOLOv3 network to improve the detection and feature extraction capabilities of small polyps. The improved model is superior to other methods in detecting small polyps on the stomach polyp dataset created by them. Xiao Jia et al. [14] proposed a two-stage polyp identification method. The improved Faster-RCNN is used as the first stage of polyp detection. The suggestion box of polyp in the first stage is transmitted to the second stage as input to realize the segmentation task. Based on the rich feature information of jump connection, a deep convolution neural network is used to realize the pixel-level recognition of polyps. Tonmoy Ghosh et al. [15] used the pre-trained AlexNet model to classify bleeding and non-bleeding images in capsule endoscopy and bleeding zones in a bleeding-identified image are also delineated.
In summary, researchers have applied various classification and segmentation models rooted in deep learning methodologies to analyze CE images. Research efforts primarily concentrated on classifying fewer than four distinct abnormality types [4, 5, 8–13], segmenting a single type of anomaly [6, 7], or detecting lesion zones within a specific segment of the digestive tract [14, 15]. Despite the performance enhancements achieved through deep learning techniques, the complexity of textures and diversity of patterns presented in abnormalities continue to pose challenges in the field. For automatic classification and localization of multiple abnormal regions, a single method in one shot that can cover most of the anomalies in the whole digestive tract is highly useful. In this study, a cascade neural network named Cascade-EC has been proposed to automatically classify and localize four different types of gastrointestinal lesions, including angiectasis, bleeding, erosion, and polyp in CE images. The CA_stm_Retinanet uses the CA_stm_Backbone as the feature extraction module, which includes the stack of CA_stm Block. The CA_stm Block adopts the split-transform-merge strategy and introduces the coordinate attention. A dataset collected by PillCam SB3 and AnKon capsule endoscopes is established from Shanghai East Hospital, which contains a total of 7936 images of 317 patients from 2017 to 2021. Compared with a single target detection network, the Cascade-EC has better performance and can effectively assist clinicians to classify and detect multiple lesions within the whole digestive tract.
Material and Methods
Cascade-EC Network Design
Cascade-EC concatenates two subnet works. The first subnetwork is EfficientNet, and the second subnetwork is CA_stm_Retinanet. The overall structure is shown in Fig. 1. First, EfficientNet classifies the input images. Correctly classified images are saved. Then, their xml annotation files are inputted to the CA_stm_Retinanet network to complete the lesion location work. The final output of Cascade-EC includes the location box of the lesion, the category label, and the confidence level of the category.
Fig. 1.

Structure diagram of Cascade-EC
EfficientNet Sub-network with Transfer Learning
EfficientNet [16] has a good balance among the depth, width, and image resolution of the network. It adjusts the three dimensions uniformly through a set of fixed scaling factors. This paper selects EfficientNet-B0 network to classify images. Its depth and width coefficients are 1.0. The image resolution is 224 × 224. The specific structure of EfficientNet-B0 is shown in Fig. 2. First, the down-sampling layers perform preliminary feature extraction on the input image. Then the mobile inverted bottleneck convolutions (MBConv) with 16 layers of different steps are used. Finally, the full connection layer acts as a classifier to obtain the output results of the network.
Fig. 2.

Structure diagram of EfficientNet-B0
Owing to the limited size of available clinical samples, pre-trained CNN architectures based on transfer learning were considered [17]. The EfficientNet-B0 model was pre-trained with ImageNet. The ImageNet dataset is currently the largest image recognition database, containing 14 million images and covering the common things in life categories. Loading the pre-trained weights in ImageNet into the EfficientNet-B0 model significantly reduces the training difficulty. All the weights in the fully connected layers were initialized with random values and trained using the stochastic gradient descent algorithm. The other layers were fine-tuned.
CA_stm_Retinanet Network Design
The CA_stm_Retinanet network is improved based on the Retinanet [18], consisting of CA_stm_Backbone, feature pyramid network (FPN), and detection head. The CA_stm_Backbone is used as the feature extraction. The FPN is the neck feature fusion module, and detection head is composed of a classification and a regression branch. Five effective feature layers share each branch to realize weight sharing. The structure of CA_stm_Retinanet is shown in Fig. 3.
Fig. 3.

Structure diagram of CA_stm_Retinanet
In the proposed model, the CA_stm_Backbone is incorporated as the backbone network for feature extraction, including B1, B2, B3, B4, and B5. B1 realizes simple feature extraction, including a convolution layer with a kernel size of 7 × 7 and a maximum pooling layer with a kernel size of 3 × 3. The other four parts, B2 to B5, are mainly composed of CA_stm Block. The CA_stm Block of the four parts are repeated three, four, six, and three times, respectively. If the feature maps are of consistent size, each CA_stm Block will share identical super parameters, thereby mitigating the risk of overfitting and enhancing the model’s generalization capabilities. The initial CA_stm Block within B2, B3, B4, and B5 incorporates a down-sampling layer to alter the feature layer’s dimensions, while subsequent CA_stm Blocks do not feature such a layer.
In CA_stm Block, both the split-transform-merge strategy and the identity shortcut connection are introduced. Split-transform-merge is used to reduce the channel dimension through 32 convolution layers with a kernel size of 1 × 1, and generates 32 feature maps with the same number of channels. The convolution layers with a kernel size of 3 × 3 for each group are used to extract more detailed image features. The convolution layers with a kernel size of 1 × 1 are used to rise back to the original dimension. Finally, the outputs of the 32 groups with the same dimension are added. In this way, the model parameters decrease with an increase in the number of filter groups, which enhances the training speed of the model. The incorporation of the identity shortcut connection from the residual structure in the CA_stm Block aids in addressing the issue of network degradation in deep networks.
Additionally, the CA_stm Block integrates coordinate attention [19] (CA) to extract more detailed image features by embedding location information into channel attention, thereby improving the model’s ability to accurately locate and identify objects of interest. The specific operation of CA is divided into two steps: coordinate information embedding and coordinate attention generation. In Fig. 3, W, H, and C are the width, height, and channel number of input feature F. Each channel is divided into two parallel feature coding processes along the vertical and horizontal directions, and two independent feature maps of directional sensing are generated. This operation can reduce the loss of location information caused by global pooling. The output in the height H direction is shown in expression (1), which corresponds to X Avg pool in Fig. 3. Similarly, the output in the width W direction is expression (2), which corresponds to the Y Avg pool in Fig. 3. At this point, the coordinate information embedding is completed.
| 1 |
| 2 |
Concatenate the features of (1) and (2) into the convolution layer with the size of 1 × 1. The result is shown in expression (3).
| 3 |
As shown in Fig. 3, r is the network scaling ratio for controlling overhead. Subsequently, the intermediate vector f is decomposed into two vectors and along the spatial dimension. Then the sum of attention weights in both directions is obtained by activating the Sigmoid. The calculation expressions (4) and (5) are listed as follows:
| 4 |
| 5 |
Finally, the output formula of CA is as follows:
| 6 |
The CA_stm_Backbone network undergoes compression by factors of 3, 4, and 5 to create FPN, denoted as C3, C4, and C5, respectively. Following two convolution operations, C5 yields the effective feature layer P3. Moreover, C5 undergoes up-sampling post-convolution, and is combined with C4 post-convolution to generate the fusion feature T2. Subsequently, T2 is convolved to produce the effective feature layer P2. The fusion feature T1 is derived by combining T2 post-up-sampling with C3 post-convolution. T1 is then convolved to yield P1. The construction of the PFN has been successfully completed, enabling the realization of multi-scale feature fusion.
Experimental Results and Analysis
Dataset and Augmentation
The dataset used in this study is from Shanghai East Hospital, collected by PillCam SB3 and AnKon capsule endoscopes. The clinical dataset comprises 317 patients spanning the years 2017 to 2021, encompassing a total of 7936 images. Within the dataset, there are 56 patients diagnosed with angiectasis, 34 patients with bleeding, 169 patients exhibiting erosion, and 58 patients presenting with polyps. To uphold the integrity and dependability of the experimental outcomes, the patients are randomly allocated into training, validation, and testing sets, ensuring that each patient’s image is exclusively present in one dataset. The training, validation, and testing sets consist of 6465, 709, and 762 samples, respectively. The distribution of samples across each category is detailed shown in Table 1. The research in this paper includes two tasks: image classification and lesion localization; thus, it is necessary to label all images. The process of image labeling was conducted with the supervision of gastroenterologists, utilizing the LabelImg tool to accurately delineate the lesion area and produce the corresponding xml file for each image.
Table 1.
Dataset division
| Case | Original training set (patients) | Expanded training set | Verification set (patients) | Test set (patients) | |
|---|---|---|---|---|---|
| Angiectasis | 56 | 1352 (45) | 2904 | 150 (5) | 167 (6) |
| Bleeding | 34 | 1112 (27) | 3336 | 109 (3) | 111 (4) |
| Erosion | 169 | 3124 (136) | 3124 | 352 (16) | 379 (17) |
| Polyp | 58 | 877 (47) | 2631 | 98 (5) | 105 (6) |
| Total | 317 | 6465 (255) | 11,995 | 709 (29) | 762 (33) |
The number of clinical images is affected by the incidence rate, and the distribution among categories is uneven and the number is limited. The performance of the network will be affected. Therefore, it is necessary to increase the number of samples. The three types of images of angiectasis, bleeding, and polyp in the training set were expanded twice, and the number of expanded images is recorded in Table 1. The methods of data augmentation are as follows. First, each original image is rotated or mirrored randomly. The rotation angles include 90, 180, and 270. Mirroring includes horizontal and vertical flipping. Then, the expanded image is mixed with the original image to create images of different proportions. The random amplification or reduction is adopted. In order to avoid becoming smaller after reduction and increase the detection difficulty for small targets, 10% and 20% reductions are selected. And 10% enlargement is selected for images. Then, the enlarged images are clipped back to the original image size. In order to avoid damaging the target at the four edges of the image frame, the target box is reserved when clipping this type of images. We reduce the size of the images within the clipping range. The expanded training dataset has 11,995 images. Despite the augmentation, the images remain uncorrelated since all the images from a patient are only in one set.
Evaluation Indicators
In order to fully evaluate the effectiveness of the model, the evaluation indicators used for image classification include Precision [20], Recall [21], and F1 score.
For the problem of target detection, the average precision [22] (AP) is added as the evaluation metric. IoU measures the overlapping degree of the two boxes of prediction box A and real box B. When IoU is set to 0.5, the mean average precision (mAP) for object detection, denoted by mAP@0.5, can be calculated.
Comparison of Different Classification Networks
In order to verify the classification performance of Cascade-EC, a comparative experiment was completed on the dataset with Densenet, Mobilenetv2, Vgg16, and Cascade-EC. The results are recorded in Table 2. Cascade-EC has achieved the best results in the three evaluation indicators of mean precision (m-Precision), mean recall (m-Recall), and mean F1 score (m-F1), and the standard deviation (STD) is the smallest. The p-values of the independent-sample t-tests for mean F1-score between Cascade-EC and different classification networks are presented in Table 2. The Cascade-EC was statistically significant compared with the Densenet (p = 0.0018), the Mobilenetv2 (p = 0.00053), and the Vgg16 (p = 0.000018). Therefore, the Cascade-EC model has improved the feature extraction capabilities and achieved superior performance in image classification.
Table 2.
Classification results
| m-Recall (± STD) |
m-Precision (± STD) |
m-F1 (± STD) |
p-value | |
|---|---|---|---|---|
| Densenet | 79.92% ± 15.42% | 87.48% ± 7.75% | 81.36% ± 12.04% | 0.0018 |
| Mobilenetv2 | 77.01% ± 15.85% | 81.09% ± 9.79% | 78.74% ± 10.50% | 0.00053 |
| Vgg16 | 69.48% ± 13.05% | 69.08% ± 9.92% | 69.12% ± 13.59% | 0.000018 |
| Cascade-EC | 90.60% ± 7.17% | 94.55% ± 3.37% | 92.26% ± 6.81% | / |
Figure 4 shows the confusion matrix of Cascade-EC on the test set. In total, 137 angiectasis, 99 bleeding, 378 erosion, and 96 polyp images in the testing set were correctly classified. All the above correctly classified images and their corresponding xml files form the testing set for target detection. The experimental results show that Cascade-EC can complete image classification efficiently and accurately. It reduces the labor intensity of clinicians and provides a basis for auxiliary diagnosis.
Fig. 4.
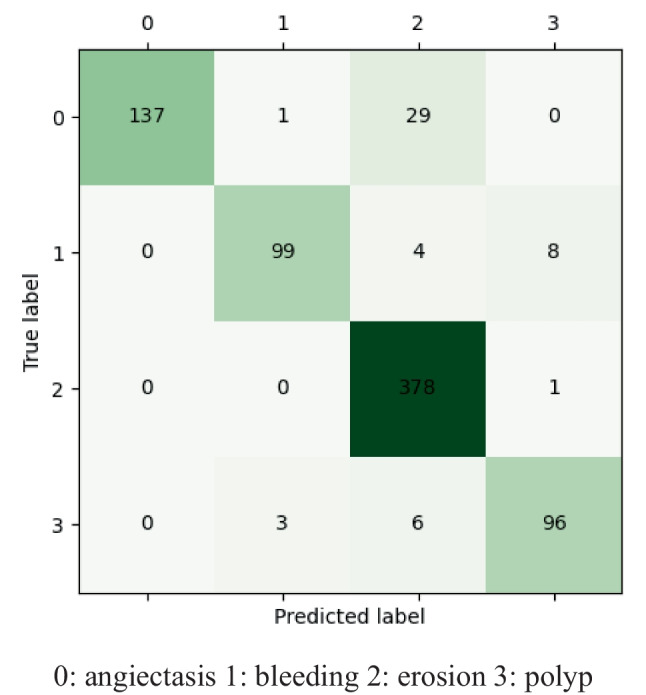
Confusion matrix of Cascade-EC on the test set. 0, angiectasis; 1, bleeding; 2, erosion; 3, polyp
Ablation Experiments
To verify the effect of each module on the Cascade-EC performance, the ablation experiments were conducted on the dataset. The modules are composed of Stm Block, CA_stm Block, and classification subnet. The Stm Block consists of split transform merge and identity shortcut connection. It not only deepens the network depth, but also reduces model parameters and accelerates the training speed of the model. The CA_stm Block has added a coordinate attention mechanism in the backbone network of Stm_Retinanet, which aims to improve sensitivity to location information of lesions. The classification subnet refers to EfficientNet with transfer learning, which can improve classification performance.
To ensure consistency, the experiments were conducted under the same experimental parameters. Table 3 records the mean value and STD of mAP@0.5 of different networks in five experiments for four types of lesions. As for angiectasis, the mAP@0.5 is 68.35% when only the Retinanet is available, and it becomes 75.93% when the Retinanet is combined with EfficientNet, which is 7.58% higher than the former result. Similarly, there was an increase of 8.90% in bleeding, 8.85% in erosion, and 8.42% in polyp.
Table 3.
mAP@0.5 for ablation experiments
| Angiectasis | Bleeding | Erosion | Polyp | |
|---|---|---|---|---|
| Retinanet | 68.35% ± 0.67% | 69.46% ± 0.23% | 70.91% ± 0.11% | 83.43% ± 0.10% |
| EfficientNet + Retinanet | 75.93% ± 0.27% | 78.36% ± 0.17% | 79.76% ± 0.07% | 91.85% ± 0.13% |
| EfficientNet + Stm_Retinanet | 77.82% ± 0.51% | 80.86% ± 0.32% | 81.23% ± 0.02% | 93.63% ± 0.21% |
| EfficientNet + CA_stm_Retinanet (Cascade-EC) | 80.57% ± 0.13% | 83.26% ± 0.39% | 84.36% ± 0.09% | 95.31% ± 0.12% |
When the Stm_Retinanet is combined with EfficientNet, the overall mAP@0.5 increased by 1.89% in angiectasis, 2.50% in bleeding, 1.47% in erosion, and 1.78% in polyps. After combining the CA_stm_Retinanet with Retinanet (i.e., Cascade-EC), the detection accuracy is further improved. The mAP@0.5 of the Cascade-EC is 80.57% for angiectasis, which is 2.75% higher than EfficientNet combining with Stm_Retinanet. Similarly, the mAP@0.5 for bleeding is 83.26%, with an increase of 2.4%. The mAP@0.5 of erosion was 84.36%, with an increase of 3.13%. The mAP@0.5 of polyp was 95.31%, with an increase of 1.68%.
Compared with Retinanet on detecting the four types of lesions, the Cascade-EC significantly improves the mAP@0.5. Specifically, the mAP@0.5 value for angiectasis increased by 12.22%, for bleeding increased by 13.80%, for erosion increased by 13.45%, and for polyps increased by 11.88%.
In Table 4, the mean values of the mAP@0.5 for angiectasis, bleeding, erosion, and polyp (m-mAP) have been calculated for each model. Then, an independent-sample t-test was performed to demonstrate the difference in the statistical significance of m-mAP@0.5 between the Cascade-EC network and the EfficientNet + Stm_Retinanet, EfficientNet + Retinanet, and Retinanet models, respectively.
Table 4.
The p-values of the independent-sample t-tests for m-mAP between Cascade-EC and other models
| EfficientNet + CA_stm_Retinanet (Cascade-EC) | EfficientNet + Stm_Retinanet | EfficientNet + Retinanet | Retinanet | |
|---|---|---|---|---|
| m-mAP | 85.88% ± 6.91% | 83.39% ± 6.54% | 81.48% ± 8.17% | 73.04% ± 2.01% |
| p-value | / | 0.036 | 0.0301 | 0.00834 |
In addition, both Retinanet and CA_stm_Retinanet are trained and tested on the same dataset. The number of iterations of Retinanet is 120, and the number of iterations of CA_stm_Retinanet is 150. The pre-training weights of the backbone network are frozen in the first 50 training sessions. The remaining training is unfrozen, and all parameters of the network participate in the training. At this time, the occupied graphics memory will increase. When the batch_size is halved, the loss will have a significant change. Both use the Adam optimizer with a momentum of 0.9. The initial learning rate is set to 0.0001 and the adjustment method of learning rate is cosine annealing. Retinanet’s loss tends to balance after 100 iterations, while CA_stm_Retinanet’s loss tends to balance after 120 iterations. The training curves of Retinanet and CA_stm_Retinanet are shown in Fig. 5.
Fig. 5.

Training curve. a Retinanet. b CA_stm_Retinanet
As shown in Table 5, the values of mAP@0.5 have been recorded in angiectasis, bleeding, erosion, and polyp detection by Retinanet and CA_stm_Retinanet. Moreover, an independent-sample t-test was performed to demonstrate the difference in the statistical significance of mAP@0.5 between the CA_stm_Retinanet network and Retinanet.
Table 5.
The mAP@0.5 and p-value between Retinanet and CA_stm_Retinanet
| Angiectasis | Bleeding | Erosion | Polyp | |
|---|---|---|---|---|
| Retinanet | 68.35% ± 0.67% | 69.46% ± 0.23% | 70.91% ± 0.11% | 83.43% ± 0.10% |
| CA_stm_Retinanet | 73.59% ± 0.29% | 74.37% ± 0.61% | 76.55% ± 0.52% | 88.50% ± 0.09% |
| p-value | 0.0094 | 0.010 | 0.0092 | 0.0095 |
Model Performance Comparison on the Dataset
To analyze the effectiveness of Cascade-EC in detecting and locating digestive tract lesions, comparative experiments were conducted. Compared with the Cascade-EC, seven networks, namely YOLOX-s, Retinanet, Faster-RCNN, CenterNet, SSD300, YOLOv5-s, and YOLOv3, were trained, validated, and tested. Five experiments were conducted on each type of network, and the mAP@0.5 ± STD for each type of lesion is recorded in Table 6.
Table 6.
The mAP@0.5 of the eight networks
| Angiectasis | Bleeding | Erosion | Polyp | |
|---|---|---|---|---|
| YOLOX-s | 68.63% ± 0.33% | 64.82% ± 0.29% | 72.53% ± 0.20% | 79.85% ± 0.71% |
| Retinanet | 68.35% ± 0.67% | 69.46% ± 0.23% | 70.91% ± 0.11% | 83.43% ± 0.10% |
| Faster-RCNN | 69.01% ± 0.27% | 68.37% ± 0.35% | 66.80% ± 0.57% | 77.34% ± 0.39% |
| CenterNet | 61.48% ± 0.97% | 72.74% ± 0.99% | 66.01% ± 0.68% | 83.61% ± 0.21% |
| SSD300 | 58.81% ± 0.46% | 69.46% ± 0.79% | 57.09% ± 0.52% | 80.77% ± 0.41% |
| YOLOv5-s | 63.09% ± 1.23% | 68.81% ± 1.13% | 59.48% ± 0.91% | 78.50% ± 0.83% |
| YOLOv3 | 61.38% ± 0.93% | 73.05% ± 0.82% | 51.77% ± 0.78% | 81.85% ± 0.09% |
| Cascade-EC | 80.57% ± 0.13% | 83.26% ± 0.39% | 84.36% ± 0.09% | 95.31% ± 0.12% |
From Table 6, it can be seen that compared to the other seven networks, the Cascade-EC has better detection performance. In angiectasis detection, the mAP@0.5 of Cascade-EC is 80.57%, which is 11.56% higher than that of Faster-RCNN network. Similarly, it is 10.21% higher than YOLOv3 in bleeding detection. In erosion detection, Cascade-EC shows an increase of 11.83% in mAP@0.5 compared to YOLOX-s. The mAP@0.5 of Cascade-EC in polyp detection reaches 95.31% with significant improvement.
Table 7 presents the m-mAP values for angiectasis, bleeding, erosion, and polyp for each model. Subsequently, an independent-sample t-test was performed to demonstrate the significant differences in m-mAP between the Cascade-EC network and the models YOLOX-s, Retinanet, Faster-RCNN, CenterNet, SSD300, YOLOv5-s, and YOLOv3, respectively.
Table 7.
The m-mAP values of the eight networks and the p-value between Cascade-EC and the other networks
| Cascade-EC | YOLOv3 | YOLOv5-s | SSD300 | CenterNet | Faster-RCNN | Retinanet | YOLOX-s | |
|---|---|---|---|---|---|---|---|---|
| m-mAP | 85.88% ± 6.91% | 67.01% ± 3.87% | 67.47% ± 6.94% | 66.53% ± 8.47% | 70.96% ± 6.39% | 70.38% ± 7.54% | 73.04% ± 2.01% | 71.46% ± 3.78% |
| p-value | / | 0.00034 | 0.00052 | 0.00039 | 0.00169 | 0.00133 | 0.00834 | 0.00163 |
The Cascade-EC has achieved good results in detecting four types of lesions in the digestive tract. The final output effect of the Cascade-EC is shown in Fig. 6, including the location boxes of the lesion, category labels, and confidence level of the category.
Fig. 6.
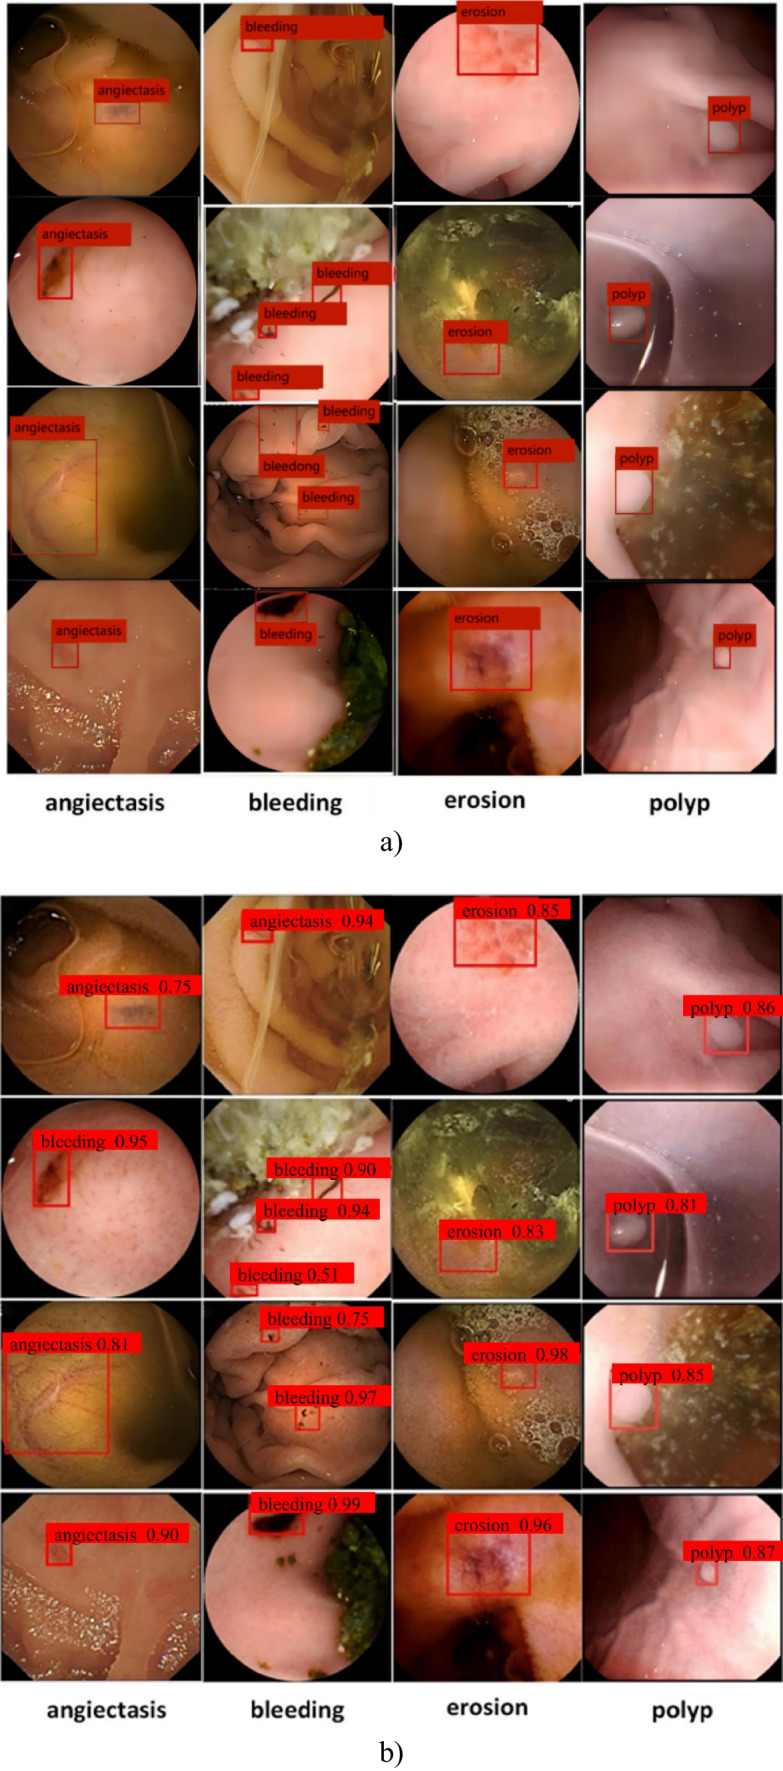
The detection results of Cascade-EC. a Ground truth. b Detection results
Discussion
Deep learning techniques for detecting gastrointestinal abnormalities are widely utilized in CE image analysis. Particularly, gastrointestinal abnormalities have highly irregular characteristic patterns, and some appear to be visually similar to normal regions. Recent researches have predominantly focused on the advancement and assessment of binary classifiers [5, 23–26], multiple classifiers targeting fewer than four abnormality types and detectors for lesion zones within a specific segment of the digestive tract [8, 27], and segmenters tailored for a singular type of anomaly [6, 7]. These models have been trained and tested on publicly available datasets [5–8, 25–27]. However, the limited number of cases in these datasets and the restricted variety of diseases pose challenges for comprehensive research in this field.
Due to intra-class variations, the task of creating a unified scheme for detecting multiple gastrointestinal diseases is particularly challenging. This study introduces the Cascade-EC model, designed to automatically detect and localize four distinct types of gastrointestinal diseases in CE images: angiectasis, bleeding, erosion, and polyp. The dataset used in this study consists of CE images from 317 patients at Shanghai East Hospital between 2017 and 2021, totaling 7936 images. These images typically exhibit low contrast, intricate backgrounds, and variations in lesion shape and color, all of which can impact the precision of classification and localization. The dataset was curated by a team of experienced gastroenterologists and medical assistants, with the image labeling process overseen by gastroenterologists. The network demonstrates adeptness in handling intra-class variance and proficiently identifying and localizing gastrointestinal abnormalities. The Cascade-EC performs preliminary lesion identification through a classification network, and then performs lesion detection.
To verify the effectiveness of Cascade-EC, both the ablation experiments and the comparative experiments were conducted. The ablation experiment is based on Retinanet and includes three components: classification subnet of EfficientNet with transfer learning, stm Block, and CA_stm Block. The experimental results indicate that each component has resulted in differing levels of performance improvement in the localization and recognition the four types of lesions. Then, a comparative experiment was conducted with the mainstream object detection networks. The mainstream network with best performance is Retinanet, with a mean mAP@0.5 of 73.04% for the four types of lesions on the test set. In a comparative analysis, the mean mAP@0.5 of seven state-of-the-art models, namely YOLOX-s, Retinanet, Faster-RCNN, CenterNet, SSD300, YOLOv5-s, and YOLOv3, was evaluated. YOLOX-s demonstrated the highest mean mAP@0.5 at 71.46%, followed closely by CenterNet at 70.96% and Faster-RCNN at 70.38%. Conversely, other networks tested exhibited lower mean mAP@0.5 values, with YOLOv5-s at 67.47%, YOLOv3 at 67.01%, and SSD300 at 66.53%. Notably, Cascade-EC exhibited significant improvement in lesion detection accuracy, achieving a mean mAP@0.5 of 85.88% for four types of lesions on the test set.
The Cascade-EC model, as proposed for identifying and localizing multiple gastrointestinal lesions, has demonstrated efficacy in aiding physicians in reviewing numerous CE images. However, there are variations in the accuracy of lesion detection across different categories, with angiectasis exhibiting the lowest accuracy. Although the clinical datasets containing real-time and authentic data are utilized, limitations exist due to the restricted quantity of clinical images in the dataset, which is influenced by the incidence rate. Moreover, the dataset exhibits an uneven distribution among categories. To address this issue, additional images may be collected for categories exhibiting restricted sample sizes. Furthermore, new dataset and model should be constructed and trained to better learning the characteristics of different disease variants.
Conclusions and Future Work
In order to reduce the workload of reading the CE images for clinicians and reduce the missed diagnosis and misdiagnosis caused by visual fatigue, a cascade neural network, Cascade-EC, is proposed for lesion classification and detection of CE images. The Cascade-EC automatically identifies and locates four lesions of the digestive tract: angiectasis, bleeding, erosion, and polyp. The classification precision achieved 94.55%, and the recall rate reached 90.60%. The existing target detection network has poor performance in classifying and localizing multiple lesions in CE images. The Cascade-EC adopted the method of task decomposition and re-integration to improve the mean mAP@0.5 of lesion localization to 85.88%. The model demonstrated an average processing time of approximately 0.9 ms per instance for automatically classifying and locating images, while running on a PC equipped with a fourth-generation Intel(R) Core i7 processor, 16 GB of RAM, and an NVIDIA GeForce RTX3060 graphics card with 12 GB of VRAM. It can assist clinicians to classify and label the lesions in CE images, and realize artificial intelligence–assisted diagnosis.
The proposed model can be applied for identifying and localizing a wide range of anomalies in CE images, which is expected to help physicians in reviewing a large number of CE images to diagnose different GI diseases. Moreover, the area of the anomalies can be labeled by the model. Anomaly localization is the prime requirement for computer-aided diagnostic systems in the current scenario of emerging digital healthcare. Additionally, the establishment of datasets for anomaly segmentation and recognition can be beneficial. Clinicians can simply review the labeled images and make adjustments to the segmentation error without needing to begin the process anew. The model has the potential to enhance the efficiency of automated image labeling and classification.
In the next step, more clinical images of CE can be collected in combination with clinical multiple centers to further expand the dataset. Input more training data to enhance the feature learning of the network and improve the generalization ability of the network.
Author Contribution
Xudong Guo, Lei Xu, and Shengnan Li contributed to the study conception and design. Image collection and annotation were performed by Meidong Xu, Yuan Chu, and Qinfen Jiang. The first draft of the manuscript was written by Xudong Guo and Shengnan Li. All authors commented on previous versions of the manuscript. All authors read and approved the final manuscript.
Funding
This work was supported by the National Natural Science Foundation of China (grant number 62373253), Science and Technology Innovation Plan of Shanghai Science and Technology Commission (grant number 22S31902200), Shanghai Municipal Science and Technology Major Project (grant number 2021SHZDZX), and Shanghai Engineering Research Center of Interventional Medical Device (grant number 18DZ2250900).
Data Availability
The data contained in this article cannot be shared publicly due to the fact that the data comes from the hospital clinic and the need to protect patient privacy.
Declarations
Ethics Approval
This is a retrospective study. This article does not contain any studies with human participants performed by any of the authors.
Competing Interests
The authors declare no competing interests.
Footnotes
Publisher's Note
Springer Nature remains neutral with regard to jurisdictional claims in published maps and institutional affiliations.
Contributor Information
Xudong Guo, Email: guoxd@usst.edu.cn.
Meidong Xu, Email: 1800512@tongji.edu.cn.
References
- 1.Fitzmaurice C, Allen C, Abbasi N et al: Global, Regional, and National Cancer Incidence, Mortality, Years of Life Lost, Years Lived With Disability, and Disability-Adjusted Life-years for 32 Cancer Groups, 1990 to 2015: A Systematic Analysis for the Global Burden of Disease Study. JAMA Oncol, 3: 524-48, 2017. [DOI] [PMC free article] [PubMed] [Google Scholar]
- 2.Park J, Cho Y K, Kim J H: Current and Future Use of Esophageal Capsule Endoscopy. Clin Endosc, 51: 317-22, 2018. [DOI] [PMC free article] [PubMed] [Google Scholar]
- 3.Xiao Z, Feng L N.: A Study on Wireless Capsule Endoscopy for Small Intestinal Lesions Detection Based on Deep Learning Target Detection. IEEE Access, 8: 159017-26, 2020. [Google Scholar]
- 4.Samir J, Ayan S, Aparajita O, et al: Detection of abnormality in wireless capsule endoscopy images using fractal features. Comput Biol Med, 127: 104094, 2020. [DOI] [PubMed] [Google Scholar]
- 5.Samir J, Ayan S, Aparajita O: A Convolutional Neural Network with Meta-feature Learning for Wireless Capsule Endoscopy Image Classification. J Med Biol Eng, 43: 475-494, 2023. [Google Scholar]
- 6.Samir J, Ayan S, Aparajita O: Localization of Polyps in WCE Images Using Deep Learning Segmentation Methods: A Comparative Study. Commun Comput Inf Sci, 1567: 538-549, 2021. [Google Scholar]
- 7.Samir J, Rohan A, Anubhav G, et al: CoInNet: A Convolution-Involution Network with a Novel Statistical Attention for Automatic Polyp Segmentation. IEEE Trans Med Imag, 42: 3987-4000, 2023. [DOI] [PubMed] [Google Scholar]
- 8.Samir J, Ayan S, Aparajita O, et al: A deep CNN model for anomaly detection and localization in wireless capsule endoscopy images. Comput Biol Med, 137: 104789, 2021. [DOI] [PubMed] [Google Scholar]
- 9.Fan S, Xu L, Fan Y, et al: Computer-aided detection of small intestinal ulcer and erosion in wireless capsule endoscopy images. Phys Med Biol, 63: 165001, 2018. [DOI] [PubMed] [Google Scholar]
- 10.Lee J H, Kim Y J, Kim Y W, et al: Spotting malignancies from gastric endoscopic images using deep learning. Surg Endosc, 33: 3790-7, 2019. [DOI] [PubMed] [Google Scholar]
- 11.Wang Y, Feng Z, Song L, et al: Multiclassification of Endoscopic Colonoscopy Images Based on Deep Transfer Learning. Comput Math Methods Med, 10.1155/2021/2485934, Jul 3, 2021. [DOI] [PMC free article] [PubMed] [Google Scholar]
- 12.Otani K, Nakada A, Kurose Y, et al: Automatic detection of different types of small-bowel lesions on capsule endoscopy images using a newly developed deep convolutional neural network. Endoscopy, 52: 786-91, 2020. [DOI] [PubMed] [Google Scholar]
- 13.Cao C, Wang R, Yu Y, et al: Gastric polyp detection in gastroscopic images using deep neural network. PLoS One, 16: e0250632, 2021. [DOI] [PMC free article] [PubMed] [Google Scholar]
- 14.Jia X, Mai X, Cui Y, et al: Automatic Polyp Recognition in Colonoscopy Images Using Deep Learning and Two-Stage Pyramidal Feature Prediction. IEEE Trans Autom Sci Eng, 17:1570-1584, 2020. [Google Scholar]
- 15.Ghosh T, Chakareski J: Deep Transfer Learning for Automated Intestinal Bleeding Detection in Capsule Endoscopy Imaging. J Digit Imaging, 34: 404-17, 2021. [DOI] [PMC free article] [PubMed] [Google Scholar]
- 16.Tan M, Le Q: Efficientnet: Rethinking model scaling for convolutional neural networks[C]// Int. Conf. Mach. Learn.. PMLR: 6105–6114, 2019.
- 17.Tajbakhsh N, Shin J, Gurudu S, et al: Convolutional neural networks for medical image analysis: Full training or fine tuning? IEEE Trans. Med. Imag. 35:1299–1312, 2016. [DOI] [PubMed] [Google Scholar]
- 18.Lin T Y, Goyal P, Girshick R, et al: Focal loss for dense object detection[C]//Proceedings of the IEEE Int. Conf. Comput. Vis.: 2980–2988, 2017.
- 19.Zhang J, Wang K, He Y, et al: Visual Object Tracking via Cascaded RPN Fusion and Coordinate Attention. Comput Model Eng Sci, 132: 909-27, 2022. [Google Scholar]
- 20.Xiong X, Duan L, Liu L, et al: Panicle-SEG: a robust image segmentation method for rice panicles in the field based on deep learning and superpixel optimization. Plant Methods, 13: 104, 2017. [DOI] [PMC free article] [PubMed] [Google Scholar]
- 21.Ma B, Liu Z, Jiang F, et al: Vehicle Detection in Aerial Images Using Rotation-Invariant Cascaded Forest. IEEE Access, 7: 59613-23, 2019. [Google Scholar]
- 22.Salton G, McGill MJ: Introduction to Modern Information Retrieval. United States NY: McGraw-Hill, 1986. [Google Scholar]
- 23.Pogorelov K, Suman S, and Azmadi Hussin F, et al: Bleeding detection in wireless capsule endoscopy videos - Color versus texture features. J Appl Clin Med Phys, 20(8):141-154, 2019. [DOI] [PMC free article] [PubMed] [Google Scholar]
- 24.Vieira PM, Silva CP, Costa D, Vaz IF, Rolanda C, Lima CS: Automatic Segmentation and Detection of Small Bowel Angioectasias in WCE Images. Ann Biomed Eng, 47(6):1446-1462, 2019. [DOI] [PubMed] [Google Scholar]
- 25.Alaskar H, Hussain A, Al-Aseem N, Liatsis P, Al-Jumeily D: Application of Convolutional Neural Networks for Automated Ulcer Detection in Wireless Capsule Endoscopy Images. Sensors (Basel), 19:1265, 2019. [DOI] [PMC free article] [PubMed]
- 26.Krenzer A, Heil S, Fitting D, Matti S, Zoller WG, Hann A, Puppe F: Automated classification of polyps using deep learning architectures and few-shot learning. BMC Med Imaging, 23:59, 2023. [DOI] [PMC free article] [PubMed] [Google Scholar]
- 27.Kundu AK, Fattah SA, Wahid KA: Multiple Linear Discriminant Models for Extracting Salient Characteristic Patterns in Capsule Endoscopy Images for Multi-Disease Detection. IEEE J Transl Eng Health Med, 8: 3300111, 2020. [DOI] [PMC free article] [PubMed] [Google Scholar]
Associated Data
This section collects any data citations, data availability statements, or supplementary materials included in this article.
Data Availability Statement
The data contained in this article cannot be shared publicly due to the fact that the data comes from the hospital clinic and the need to protect patient privacy.