Abstract
Background
Acute Stanford Type A Aortic Dissection (ATAAD) is a critical medical emergency characterized by significant morbidity and mortality. This study aims to identify specific gene expression patterns and RNA modification associated with ATAAD.
Methods
The GSE153434 dataset was obtained from the Gene Expression Omnibus (GEO) database. Differential expression analysis was conducted to identify differential expression genes (DEGs) associated with ATAAD. To validate the involvement of RNA modification in ATAAD, RNA modification-related genes (M6A, M1A, M5C, APA, A-to-I) were acquired from GeneCards, following by Least Absolute Shrinkage and Selection Operator (LASSO) regression analysis. A gene prediction signature consisting of key genes was established, and Real-time PCR was used to validate the gene expression in clinical samples. The patients were then divided into high and low-risk groups, and subsequent enrichment analysis, including Gene Ontology (GO), Kyoto Encyclopedia of Genes and Genomes (KEGG), Gene Set Enrichment Analysis (GSEA), Gene Set Variation Analysis (GSVA), and assessments of immune infiltration. A co-expression network analysis (WGCNA) was performed to explore gene-phenotype relationships and identify key genes.
Results
A total of 45 RNA modification genes were acquired. Six gene signatures (YTHDC1, WTAP, CFI, ADARB1, ADARB2, TET3) were developed for ATAAD diagnosis and risk stratification. Enrichment analysis suggested the potential involvement of inflammation and extracellular matrix pathways in the progression of ATAAD. The incorporation of pertinent genes from the GSE147026 dataset into the six-gene signature further validated the model's effectiveness. A significant upregulation in WTAP, ADARB2, and TET3 expression, whereas YTHDC1 exhibited a noteworthy downregulation in the ATAAD group.
Conclusion
Six-gene signature could serve as an efficient model for predicting the diagnosis of ATAAD.
INTRODUCTION
Acute Stanford Type A aortic dissection (ATAAD) represents a critical condition with life-threatening implications, contributing significantly to aorta-related mortality.[1,2] Preventing premature fatalities from ATAAD hinges on early identification of high-risk individuals, vigilant monitoring of aortic aneurysm dilatation, medication to mitigate aneurysm growth, and prompt surgical intervention.[3] Recent research has unveiled intricate interplays among dyslipidemia, hypertension, vascular inflammation, as well as autoimmune and infectious diseases, all contributing to the development and progression of ATAAD.[4] Despite the remarkable strides in genetic and genomic technologies over the past decades,[5-7] a dependable early diagnostic method for ATAAD remains elusive. Consequently, the exploration of gene-related models for ATAAD diagnosis assumes paramount significance.
RNA modifications are essential for regulating various biological processes within living cells,[8] constituting the third layer of epigenetics that governs RNA production and metabolism. An expanding array of modification modes has been identified, including 5-methylcytosine (m5C), N1-methyl adenine (m1A), and N6-methyl adenine (m6A), among others.[9] Recent investigations have unveiled the involvement of RNA-m6A modifications in the pathophysiology and development of ATAAD,[10,11] suggesting that modifications in RNA could influence aortic wall integrity and response to mechanical stress. However, despite these insights, the association between ATAAD and other RNA modifications remains uncharted territory. These modifications like m6A could potentially impact gene expression profiles critical for aortic tissue homeostasis and integrity. Hence, this study aimed to systematically assess the diagnostic potential of a gene signature consisting of differentially expressed genes (DEGs) linked to RNA modification in ATAAD. Subsequently, we delved into the underlying mechanisms through functional enrichment analysis and consensus cluster analysis. Finally, the validity of these 6 RNA modification-related DEGs was confirmed by clinical samples, reinforcing the potential of RNA modification studies in improving diagnostic precision for ATAAD.
METHODS
Data and Clinical Tissues Source
The GSE153434[12] dataset based on the GPL20795 was downloaded from the GEO database (https://www.ncbi.nlm.nih.gov/geo/) utilizing the R package GEOquery.[13] The dataset was classified as Expression profiling by high throughput sequencing. This dataset consisted of 20 samples, including 10 ATAAD tissues and 10 normal tissues, all of which were included in this study. The dataset GSE147026[14] was also retrieved from the GEO database, including 4 ATAAD tissues and 4 normal tissues. A total of 45 RNA modification-related genes (M6A, M1A, M5C, APA, A-to-I) were acquired from the GeneCards database (https://www.genecards.org/) (Table S1). Ascending aortic tissue samples were collected from five patients who had undergone surgical procedures for ATAAD (ATAAD group). Meanwhile, we also obtained the ascending aortic tissue from five patients who had undergone coronary artery bypass grafting (control group). The collection of clinical tissues was carried out at the Second Affiliated Hospital of Harbin Medical University. All procedures were approved by the Institutional Ethics Committee of the Second Affiliated Hospital of Harbin Medical University (No. KY2023-116). Informed consent was obtained from all individual participants included in the study.
Differentially Expressed Genes
The expression profiles in the GSE153434 dataset were subjected to normalization using R ‘Limma’ package.[15] Differentially expressed genes (DEGs) were defined as genes displaying significant expression variations in ATAAD tissues compared to normal tissues (|log Fold Change| > 1 and adjusted P-value < 0.05). The R package 'edgeR'[16] was utilized for the screening of DEGS, and the results were illustrated with a volcano plot.
GSEA and GSVA analysis
Gene set enrichment analysis (GSEA)[17] is employed to assess the distribution pattern of a predefined gene set within a gene expression dataset, which is ranked based on its correlation with a phenotype. This analysis helps in ascertaining the gene set’s contribution to the phenotype. GSEA analysis was performed separately on the ATAAD and control groups in the gene sets ‘c2.cp.kegg.v7.0.entrez.gmt’ and ‘c5.all.v7.0.entrez.gmt’ from the MSigDB database (http://www.gsea-msigdb.org/) by the R package clusterProfiler. Additionally, GSVA analysis was performed on the gene set ‘C2.cp.kegg.v7.0.entrez.gmt’ through the GSVA package[18] to further investigate differences in pathways between the ATAAD and control groups.
Differential Expression of RNA Modification Genes and Construction of PPI Network
The expression disparities in RNA modification molecules between the ATAAD and control groups were detected. The outcomes were visually presented through box plots and heat maps. Following this, a differential analysis was performed between two groups employing the edgeR package.[6] Genes with logFC > 1 and P-value < 0.05 were designated as upregulated DEGs, while logFC < 1 and P-value < 0.05 were classified as downregulated DEGs. These findings were effectively visualized using volcano plots. Furthermore, the STRING database is a repository encompassing 2031 species, comprising 9.6 million proteins and 138 million protein-protein interactions.[19] We utilized the STRING database to create a protein-protein interaction (PPI) network for RNA modification molecules, facilitating a comprehensive exploration of gene regulatory relationships.
LASSO Regression
The Least Absolute Shrinkage and Selection Operator (LASSO) regression is one of the extensively employed machine learning algorithms in current diagnostic model construction. It utilizes regularization techniques to address the issue of potential overfitting in curve fitting, thereby enhancing the accuracy of the model. We performed dimension reduction and model construction using 45 RNA modification genes by 'glmnet' package in R.[20] In logistic regression, the independent variable was the expression matrix of candidate RNA modification-related DEGs, and the response variable was ATAAD status in the GSE153434 dataset. We selected the penalty parameter (λ) through ten-fold cross-validation, choosing the λ value with the lowest partial likelihood deviance. Scores were computed by multiplying each gene′s expression by its respective coefficient in the GSE153434 dataset and then summing them up.[12] Patients were grouped into high-score and low-score categories, with the division determined by the median value of their scores. Subsequently, the same computational approach was applied to validate the effectiveness of the score on GSE17026.[14]
GO and KEGG Enrichment Analysis
Comprehensive gene function enrichment studies, including encompassing biological processes (BP), molecular functions (MF), and cellular components (CC), were conducted through the Gene Ontology (GO) functional annotation analysis. The Kyoto Encyclopedia of Genes and Genomes (KEGG) is an extensively utilized database containing information on genomes, biological pathways, diseases, and drugs. We performed GO and KEGG enrichment analysis on the DEGs in both high-score and low-score groups by R package ‘clusterProfiler’.[21]
ssGSEA Immune Infiltration Analysis
ssGSEA analysis was conducted on the ATAAD samples using the R package ‘gsva’ [18] to estimate the composition and abundance of 28 immune cell types. Subsequent comparisons were made between the immune cell profiles of the high-score and low-score groups associated with RNA modification genes. Furthermore, the correlation between significant RNA modification genes in ATAAD and immune cells was assessed.
Weighted Correlation Network Analysis (WGCNA)
The expression profile data from the GSE153434 dataset underwent normalization, and genes with zero expression values were excluded. A weighted correlation network was established for genes within cluster 1 and cluster 2, utilizing the R package ‘WGCNA’.[22] The double weight middle correlation was employed as the correlation method across all WGCNA functions. For network construction and module identification, we employed the Topology Overlap Metric (TOM) with calculation parameters set to “minModuleSize” = 50 and “mergeCutHeight” = 1000. Subsequently, genes with the highest significance were selected from the identified modules.
Real-time quantitative polymerase chain reaction (RT-qPCR)
Aortic tissue samples were collected from five patients undergoing surgery for ATAAD and five coronary artery bridge graft (CABG) patients. Total mRNA was extracted from these tissues using TRIpure reagent (RP1001, BioTeke). Subsequently, mRNA was reverse transcribed with a cDNA Synthesis for qPCR kit (D7160L, Beyotime), and cDNA amplification was performed using the qPCR MasterMix kit (PC1150, Solarbio) on the Exicycler 96 system (BIONEER). β-actin served as an internal standard, and the primer sequences for real-time PCR were detailed in Table 1. The 2-ΔΔCT method was employed for data analysis.
Table 1. Primers sequence for real-time PCR.
| Genes | Primers |
| YTHDC1 | F: AAGCGAAGGGTGTATGG |
| YTHDC1 | R: TCCTCCGTGATGTGATT |
| WTAP | F: ACTAAAGCAACAACAGCAGG |
| WTAP | R: CGTAAACTTCCAGGCACTC |
| TET3 | F: GGACCAGCATAACCTCTACA |
| TET3 | R: TTCTCCTCGCTACCAAAC |
| CFI | F: GATTTCGCTGATGTGGTT |
| CFI | R: AGCCTTGAATTGTAGGATGT |
| ADARB1 | F: CACGCTCTTCAATGGTTT |
| ADARB1 | R: GGTGGGAATGGTGGTAA |
| ADARB2 | F: GTGCGGTTAAAAGAAGGT |
| ADARB2 | R: CTGACGAGGTGTTTGCTG |
| β-actin | F: GGCACCCAGCACAATGAA |
| β-actin | R: TAGAAGCATTTGCGGTGG |
Statistical Analysis
All data calculations and statistical analyses were conducted using R software (version 4.0.3). To compare continuous variables between two groups, we employed the independent Student t-test for normally distributed variables and the Mann-Whitney U test (i.e., Wilcoxon rank-sum test) for non-normally distributed variables. All statistical tests utilized two-sided P-value. P < 0.05 was regarded as statistically significant.
RESULTS
Identification of DEGs and Enrichment Analysis in GSE153434 Dataset
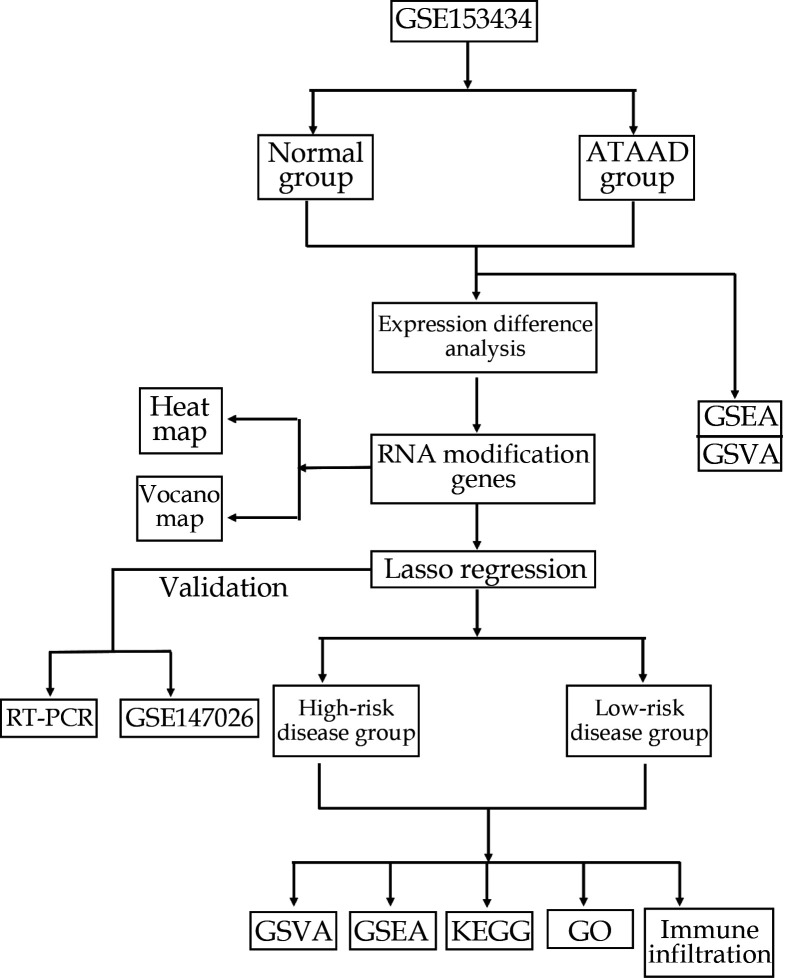
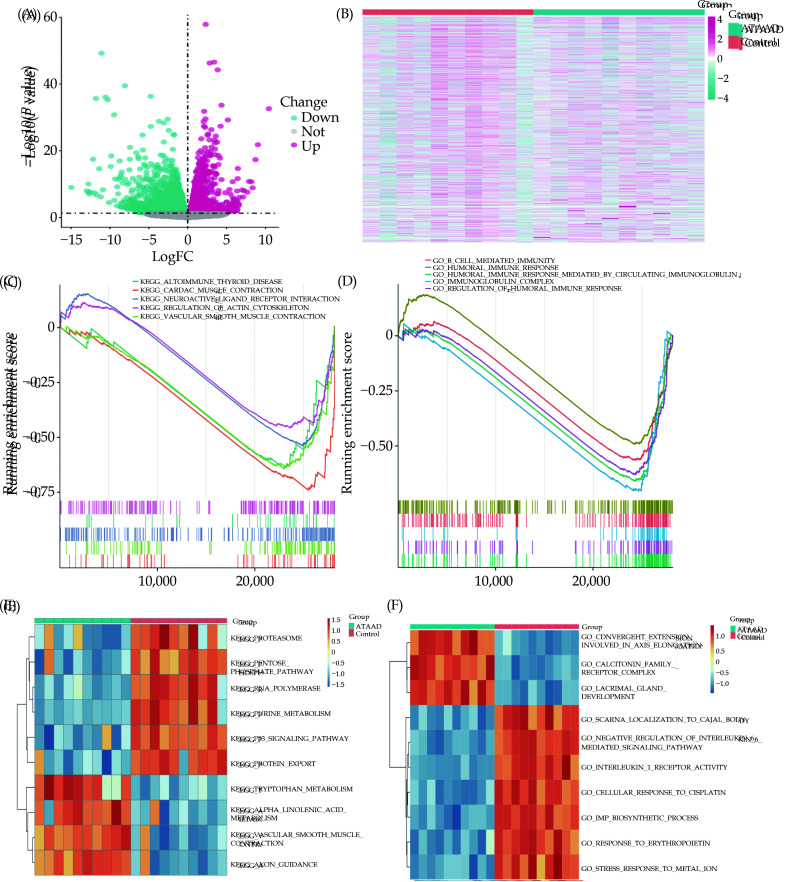
The flowchart of our study was shown in Figure 1. DEGs between the ATAAD and normal groups in the GSE153434 dataset were obtained through differential analysis. A total of 2484 upregulated genes and 2477 downregulated genes were included. Volcano plot and heatmap were created for the visualization of the DEGs (Figure 2A, 2B). GSEA analysis revealed significant enrichment of pathways associated with ATAAD, including cardiac muscle contraction, vascular smooth muscle contraction, neuroactive ligand receptor interaction, autoimmune thyroid disease, and regulation of actin cytoskeleton (Figure 2C, 2D). GSVA results revealed the top 10 significantly different pathways and GO functional sets (Figure 2E, 2F).
Figure 1.
The flowchart of study.
Figure 2.
Differential expression of DEGs and enrichment analysis in GSE153434 dataset.
(A-B): Volcano plot (A) and heatmap (B) of 45 DEGs between the ATAAD and control groups. For volcano plot, pink point represents the up-regulated DEGs, blue represents the down-regulated DEGs, and gray represents the non-differential genes. (C-D): KEGG pathways (C) and GO functional sets (D) significantly enriched associated with ATAAD were searched using GSEA analysis. (E-F): The top 10 pathways (E) and the top 10 GO functional sets (F) with the most significant differences between the ATAAD and control group, were obtained using the GSVA algorithm. ATAAD: acute Stanford type A aortic dissection; DEGs: differentially expressed genes; GO: Gene Ontology; GSEA: Gene Set Enrichment Analysis; GSVA: Gene Set Variation Analysis; KEGG: Kyoto Encyclopedia of Genes and Genomes.
Differential Expression Analysis of RNA Modification-related DEGs
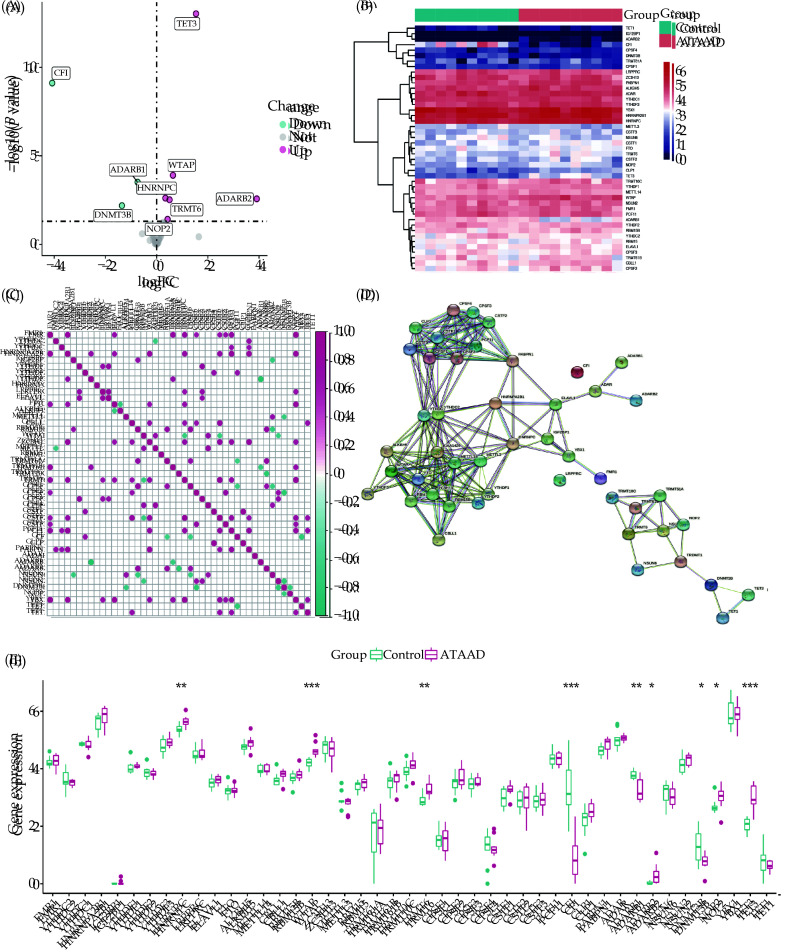
We integrated the DEGs of the GSE153434 dataset and 45 RNA modification-related genes (Table S1). Nine RNA modification-related DEGs were recognized, including three upregulated and six downregulated genes. The volcano plot and heatmap showed the differential expression of these 9 RNA modification-related DEGs (Figure 3A, 3B). We further presented a co-expression heatmap of these RNA modification-related genes (Figure 3C) and a protein-protein interaction network (Figure 3D). A boxplot displayed the expression profiles of 45 RNA modification-related genes. Among them, the genes HNRNPC, WTAP, TRMT6, CFI, ADARB1, ADARB2, DNMT3B, NOP2, and TET3 showed statistically significant differences between the ATAAD and control groups (Figure 3E).
Figure 3.
Differential expression of RNA modification genes.
(A): The volcano plot illustrates the differences in RNA modification genes between the ATAAD and control groups. Pink representing upregulated genes, blue representing downregulated genes, and gray representing genes with no significant difference. (B, C): Heatmaps and boxplots depict the transcriptomic expression profiles of the 45 DEGs. (D): Protein-protein interaction network diagram of RNA modification genes. (E): Boxplot displays the differential expression of 45 DEGs between the ATAAD and control groups.
LASSO Logistics Regression
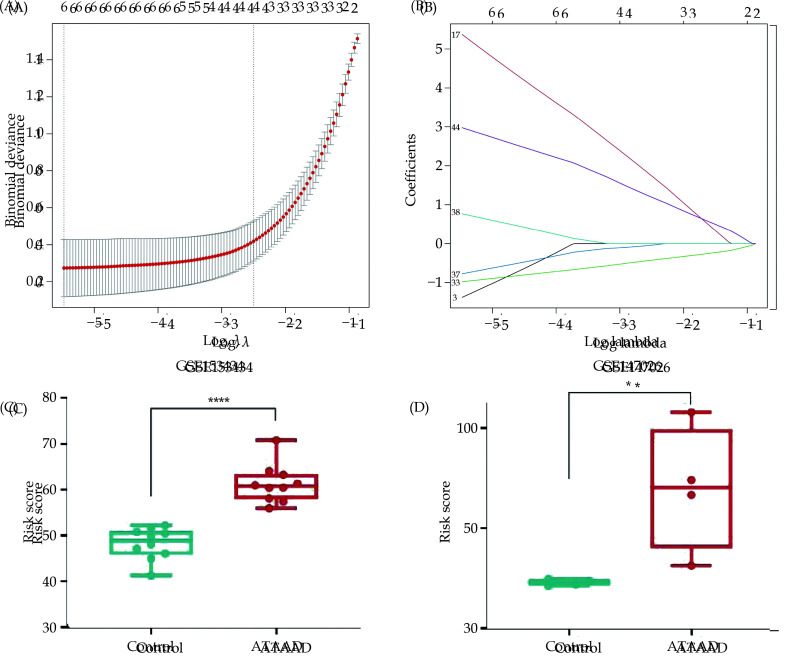
To further identify RNA modification molecules associated with ATAAD, LASSO regression analysis was employed to screen the RNA modification-related genes (Figure 4A, 4B). The results revealed that six RNA modification-related genes (YTHDC1, WTAP, CFI, ADARB1, ADARB2, TET3) were considered relevant genes for ATAAD. Based on these six genes, a LASSO regression model was established. The score was calculated by summing specific coefficients multiplied by the expression levels of respective genes (-1.38 * YTHDC1 + 5.37 * WTAP - 0.98 * CFI - 0.78 * ADARB1 + 0.77 * ADARB2 + 2.98 * TET3), resulting in patient categorization into high-score (n = 5, < median) and low-score (n = 5, > median) groups based on the median cut-off value. Compared with the control group, patients with ATAAD had higher scores in both the GSE153434 and GSE147026 datasets (Figure 4C, 4D).
Figure 4.
LASSO logistics regression model.
(A): LASSO coefficient of 9 RNA modification-related genes. (B): 10-fold cross-validation for tuning parameter selection in the LASSO regression. (C-D) The risk score of ATAAD and control group in both the GSE153434 (C) and GSE147026 datasets (D). *P < 0.05; ***P < 0.01. LASSO: Least absolute shrinkage and selection operator.
Enrichment Analysis of RNA Modification DEGs on the High-risk and Low-risk Groups
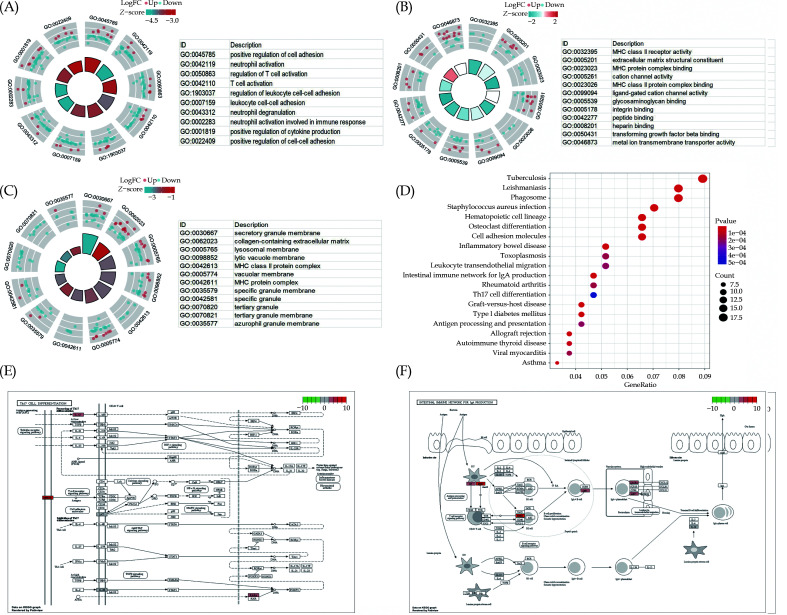
To reveal the relationships between RNA modification DEGs and diseases, GO and KEGG analysis were performed on the high and low-score groups of RNA modification DEGs in ATAAD (Table S2). The BP primarily enriched in association with ATAAD-related RNA modification DEGs included positive regulation of cell adhesion, neutrophil activation, T cell activation, and regulation of leukocyte cell-cell adhesion (Figure 5A). Additionally, they were enriched in MF, including extracellular matrix structural constituent, MHC protein complex binding, cation channel activity, and MHC class II protein complex binding (Figure 5B), and the CC of RNA contained secretory granule membrane, collagen-containing extracellular matrix lysosomal membrane, and MHC class II protein complex (Figure 5C). KEGG pathway enrichment analysis results showed significant enrichment in biological pathways such as Phagosome, Tuberculosis, Leishmaniasis, Staphylococcus aureus infection, and Inflammatory bowel disease (Figure 5D, Table S3). Additionally, the most significantly enriched pathways, namely Th17 cell differentiation and intestinal immune network for IgA production, were displayed by KEGG analysis (Figure 5E, 5F).
Figure 5.
Enrichment analysis of GO and KEGG.
(A-C): The top ten items of biological processes (A), molecular functions (B) and cell components (C) associated with ATAAD were analyzed by GO analysis. The node color represents the gene expression level: red represents the up-regulated gene, and blue represents the down-regulated gene. The quadrilateral color indicates the z-score of the GO terms. Blue indicates that the z-score is negative and more likely to be suppressed in the corresponding GO terms. Red indicates that the z-score is positive and more likely to be activated in the corresponding GO terms. (D): KEGG Pathway enrichment analysis was used to investigate the biological pathways associated with ATAAD. Abscissa is gene ratio, ordinate is pathway name, node size represents the number of genes enriched in the pathway. (E-F) Pathway diagram of enriched Th17 cell differentiation pathway (E) and ‘intestinal immune network for IgA production pathway (F).
GSEA Analysis of RNA Modification DEGs on the High-risk and Low-risk Groups
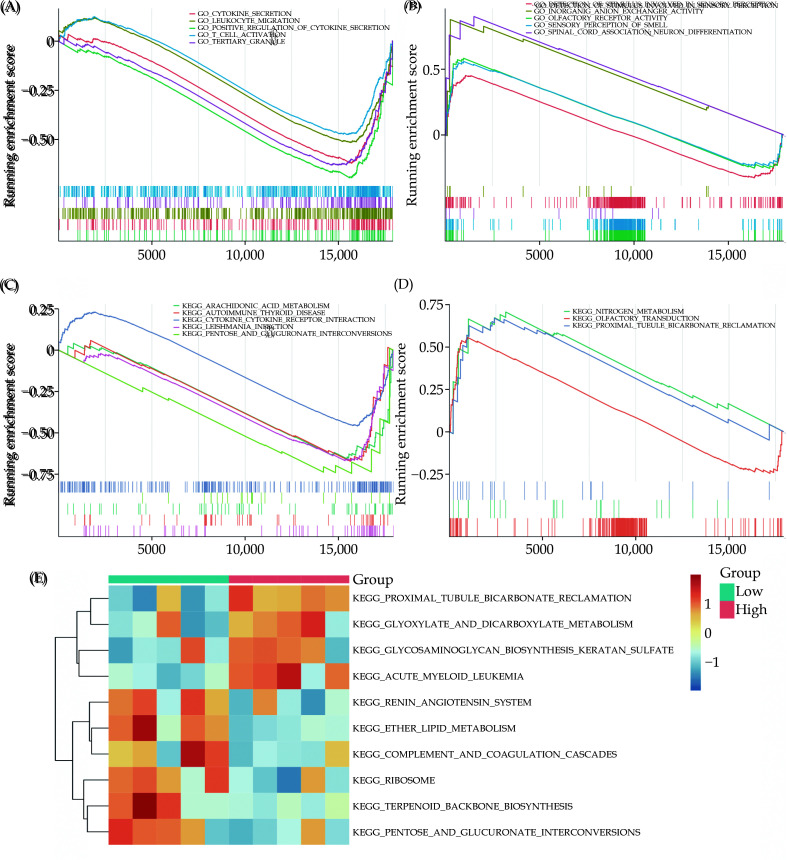
GSEA analyzed the related functional pathways between the high-score and low-score groups to verify the results of GO and KEGG. Firstly, based on the GSEA results of GO-related functions, gene sets such as OLFACTORY RECEPTOR ACTIVITY, SENSORY PERCEPTION OF SMELL, SPINAL CORD ASSOCIATION NEURON DIFFERENTIATION, and others were notably enriched in the high-score group related to RNA modification (Figure 6A). Conversely, gene sets like CYTOKINE SECRETION, LEUKOCYTE MIGRATION, TERTIARY GRANULE, T CELL ACTIVATION, and others were significantly enriched in the RNA modification low-score group (Figure 6B, Table S4). Furthermore, based on the GSEA results related to KEGG pathways, it was observed that biologically relevant pathways such as OLFACTORY TRANSDUCTION, NITROGEN METABOLISM, and PROXIMAL TUBULE BICARBONATE RECLAMATION were significantly enriched in the RNA modification high-score group (Figure 6C). Pathways including LEISHMANIA INFECTION, AUTOIMMUNE THYROID DISEASE, ARACHIDONIC ACID METABOLISM, PENTOSE AND GLUCURONATE INTERCONVERSIONS, and CYTOKINE RECEPTOR INTERACTION were significantly enriched in the RNA modification low-score group (Figure 6D, Table S5). The GSVA heatmap showed that pathways like TERPENOID BACKBONE BIOSYNTHESIS, ETHER LIPID METABOLISM, PENTOSE AND GLUCURONATE INTERCONVERSIONS, PROXIMAL TUBULE BICARBONATE RECLAMATION, and RIBOSOME exhibited significant differences between two groups (Figure 6E, Table S6).
Figure 6.
GSEA and GSVA enrichment analysis.
(A-B): Enriched GO gene sets significantly associated with the RNA modification gene high-risk group and low-risk group; (C-D): enriched KEGG gene sets significantly associated with the RNA modification gene high-risk group and low-risk group; (E): differential pathways between high and low-risk RNA modification genes in the ATAAD group was analyzed using GSVA analysis.
Immune Infiltration Analysis of ssGSEA on the High-risk and Low-risk Groups
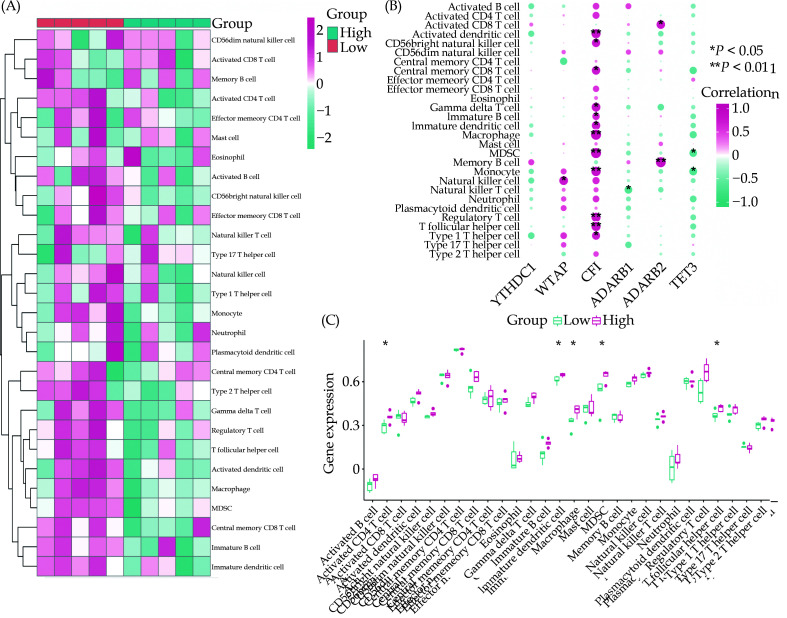
The immune cells were assessed in both high-score and low-score groups of ATAAD patients using the ssGSEA algorithm, and the results were visualized in Figure 7A. Additionally, correlation analyses were conducted between six key RNA modification-associated DEGs (YTHDC1, WTAP, CFI, ADARB1, ADARB2, TET3) and various immune cells. The findings revealed that gene CFI exhibited a correlation with 12 immune cell types with a p-value less than 0.05 (Figure 7B). Further analysis was conducted using the rank-sum test to access the relationship between CFI and 28 immune cells, uncovering a considerable association between CFI expression and 5 immune cells (Figure 7C).
Figure 7.
The correlation between RNA modification genes and immune infiltration.
(A): Immune cell analysis in high-risk and low-risk patients with RNA modification genes of ATAAD; (B) Correlation analysis of six key RNA modification-related molecules with different immune cells; and (C) Level differences of 28 immune cells in ATAAD patients’ CFI gene high and low expression groups. ATAAD: Acute Stanford Type A Aortic Dissection.
WGCNA Analysis of RNA Modification DEGs on the High-risk and Low-risk Groups
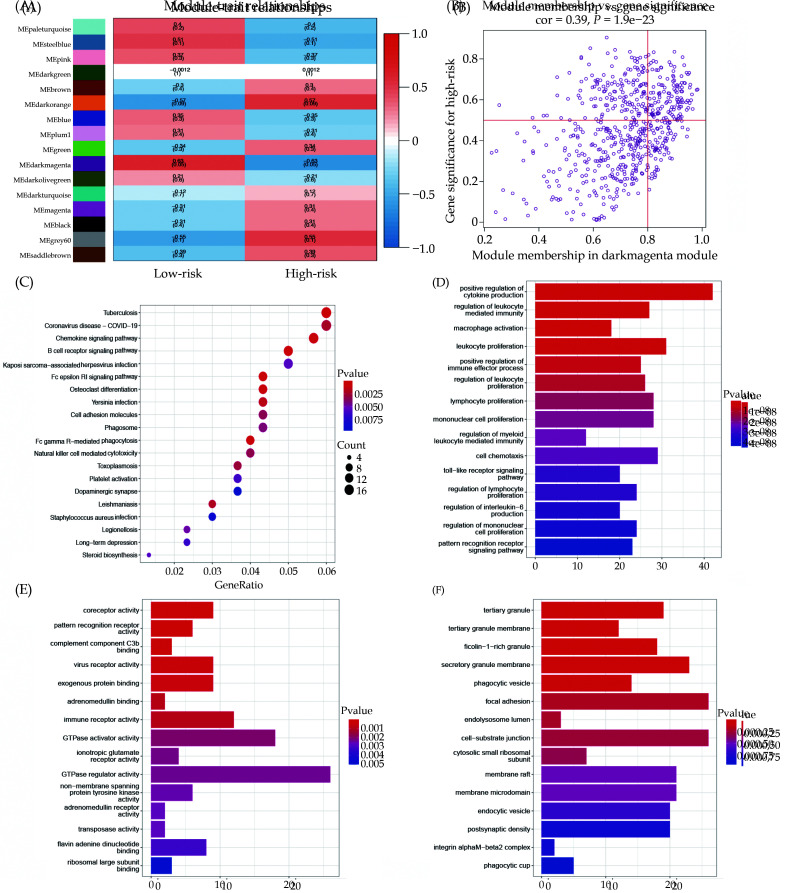
To further identify key genes involved in RNA modification and mRNA-associated modules, we applied the WGCNA algorithm to construct co-expression modules. The results demonstrated a significant association between the MEdarkmagenta module and the RNA modification high-score group (r = –0.63, P = 0.05). Figure 8A depicted the relationship between RNA modification subcluster 1 and MEdarkmagenta. The correlation between genes within the MEdarkmagenta module and the RNA modification high-score group was illustrated (Figure 8B). Enrichment analysis of these genes within the MEdarkmagenta module, based on KEGG pathways, was presented in Figure 8C. The functional analysis related to BP, MF, and CC from the GO analysis was shown in Figure 8D-F.
Figure 8.
WGCNA analysis of RNA modification high-risk and low-risk groups.
(A): The WGCNA heatmap displays the correlation between different modules and high-low risk groups; (B): correlation between darkmagenta module genes and RNA modification high-risk group; (C): KEGG enrichment analysis of darkmagenta module genes; and (D-F): enrichment analysis of darkmagenta module genes of BP, MF, and CC were analyzed by GO analysis. BP: biological processes; MF: molecular functions; CC: cellular components.
Validation of DEGs Expression in ATAAD Tissues
We validated the expression of DEGs in ATAAD tissues by RT-qPCR. In comparison to the control group, WTAP, ADARB2, and TET3 exhibited significant upregulation in ATAAD patients, whereas YTHDC1 was notably downregulated (Figure 9).
Figure 9.
The relative expression of the six DEGs in ATAAD tissues.
The expression of DEGs in ATAAD and control tissues were detected by RT-qPCR. *P < 0.05; **P < 0.01. NS: no significance.
DISCUSSION
ATAAD is a medical emergency characterized by a high mortality rate, with patient outcomes significantly influenced by time-dependent effects since early and accurate diagnosis is crucial for successful intervention.[23,24] The development of a 6-gene signature, as described in this study, demonstrates its promise as an innovative diagnostic tool for ATAAD. Employing LASSO regression analysis, known for its effectiveness in variable selection, we narrowed a broad set of RNA modification-associated DEGs to six crucial biomarkers intimately linked with ATAAD: YTHDC1(m6A), WTAP(m6A), CFI(APA), ADARB1(A-I), ADARB2(A-I), and TET3 (m5C). The selection of these six genes was guided by a stringent analytical process. Initially, a comprehensive list of RNA modification-associated genes was evaluated for their differential expression between ATAAD and control samples. Subsequent LASSO regression analysis helped in selecting genes that contribute most significantly to the model’s predictive accuracy. The inclusion of each gene was further validated by its statistical significance and relevance in prognosis, reinforcing the multigene signature’s reliability and biological pertinence to the condition’s phenotypic outcomes. By introducing the 6-gene signature, we address a gap in noninvasive diagnostics for ATAAD and establish a foundation for in-depth molecular research into this life-threatening condition.
Our validation methodology, incorporating an expansive approach, has substantiated the credibility of the 6-gene signature in diagnosing ATAAD. This verification procedure employed an external gene expression dataset (GSE147026 from the GEO database) and subsequent assay through real-time PCR. The diagnostic capability of the 6-gene signature received support from the GSE147026 dataset, demonstrating its relevance for diverse patients. Real-time PCR provided quantitative support, manifesting significant regulation—upregulation of WTAP, ADARB2, and TET3, along with YTHDC1 downregulation within patient samples—thereby validating our computational predictions. Although not all six genes displayed the anticipated expression profiles in the real-time PCR results, the concordance of four genes’ expression with the bioinformatic analysis offers compelling evidence of the signature's biological importance. Such precision in expression of these key genes underscores their potential significance for clinical diagnostic accuracy. By integrating dataset cross-validation with real-time PCR, our approach not only confirms our in silico findings but also establishes the practical merit of the 6-gene signature. Rigorous validation is crucial for ensuring diagnostic reliability and advancing the application of genomic discoveries to clinical platforms for managing intricate medical conditions such as ATAAD.
The functional elucidation of the key genes YTHDC1, WTAP, ADARB2, and TET3 provides insight into the biological landscape of ATAAD, underscoring their potential roles in the condition’s pathogenesis. YTHDC1, a crucial reader of N6-methyladenosine (m6A) modified transcripts, plays a key role in RNA splicing and nucleocytoplasmic transport.[25,26] In ATAAD, its expression is notably down-regulated, hinting at its potential role in modulating oxidative stress pathways, which are significant to the disease’s etiology.[27] Diminished YTHDC1 levels disrupt the nuclear export of m6A-modified mRNA, evidenced by altered nuclear-cytoplasmic distribution patterns, potentially disrupting the transcriptome and contributing to ATAAD’s pathology.[28] Further investigation is needed to define YTHDC1’s exact molecular functions in vascular integrity and its impact on ATAAD susceptibility.
WTAP, another vital m6A-related modulator, functions as part of the methyltransferase complex, influencing RNA splicing, cell proliferation, cell cycle, and embryonic development.[29] The significant upregulation of WTAP observed in ATAAD indicates a possible linkage to aberrant signaling pathways that underpin vascular remodeling—an essential element in the progression of aortic dissection. ADARB2 encodes a protein that is a member of the double-stranded RNA adenosine deaminases, which are implicated in the adenosine-to-inosine (A-to-I) RNA editing process. Although classified within the ADAR family of RNA-editing enzymes, ADARB2 is characterized by an inactive RNA editing function, the significance of which remains an enigma, indicating a frontier in RNA biology that warrants further exploration.[30] Despite its undefined activity in RNA editing, ADARB2 is predominantly expressed in the brain and its association with cognitive functions suggests a vital neurological role.[31] To date, the correlation between ADARB2 and ATAAD has not been documented, presenting an open inquiry into the gene’s involvement in vascular diseases and its potential impact on the pathogenesis of ATAAD.
TET3 is a member of the ten-eleven translocation (TET) family of enzymes involved in DNA demethylation. It plays a role in the epigenetic regulation of gene expression.[32,33] Changes in TET3 expression may reflect alterations in the epigenetic landscape that contribute to the maladaptive vascular remodeling and compromised structural integrity characteristic of ATAAD. The synthesis of these individual gene roles presents a panoramic view of the multilayered molecular interplay in ATAAD. Understanding the influence of these key genes in RNA modification, immune response, and epigenetic regulation allows us to dissect the complex molecular interactions at play and paves the way for therapeutic insights that target these foundational processes within ATAAD.
Emerging evidence increasingly underscores the crucial function of RNA modifications in shaping immune functionality, encompassing both the innate and adaptive branches.[34,35] With the recent surge of interest from the scientific community, the impact of RNA modifications on immune dynamics, particularly within the tumor microenvironment and among tumor-infiltrating leukocytes, has been more acutely recognized. Studies have elucidated a complex interplay of RNA modifications in governing cancer-associated immune mechanisms.[36,37] In the context of our research, we observed a negative association between high-risk genetic profiles and the infiltration of T cells and macrophages in patients with ATAAD. This correlation echoes the findings of antecedent investigations, which have identified CD4+ T cells as pivotal elements in vascular pathologies, notably atherosclerosis, hypertension, and ATAAD.[38] The prevalence of inflammatory cells, such as assorted T lymphocytes and macrophages, is implicated in the propagation of ATAAD via the release of cytokines and their interactions with other immunocytes, contributing to the complex inflammatory milieu. This insight into the role of RNA modifications as a regulatory axis in immune cell activity within vascular inflammatory conditions offers a promising avenue for potential therapeutic strategies targeting ATAAD.
Our study has several limitations. Primarily, the development and validation of our model depended on retrospective datasets obtained from GEO, characterized by limited sample sizes. Additionally, the prognostic model was constructed based on a single feature, which may not capture the complexity of the disease process. The lack of clinical parameters, including patient symptoms and comorbidities, in the databases also curtailed the depth of our signature’s representation. To confirm the clinical utility and significance of our model, further research involving prospective studies with larger cohorts is imperative.
Conclusion
Our study identified that six gene signatures (YTHDC1, WTAP, CFI, ADARB1, ADARB2, TET3) were developed for ATAAD diagnosis and risk stratification. The continuing investigation into the molecular roles of WTAP, ADARB2, and TET3, along with YTHDC1, will refine our understanding of ATAAD and may lead to tailored therapeutic interventions.
DECLARATIONS
SUPPLEMENTARY DATA
Supplementary data to this article can be found online.
Author Contributions
JC and HT conceptualized and designed the research study. TZ and QL conducted data analysis and carried out visual processing. CL curated the GEO database. WC and ZL handled the PCR processing. JC and TZ drafted the initial manuscript. All authors have contributed to the article, reviewed the final manuscript, and collectively take responsibility for all aspects of the research.
Ethics Approval and Consent to Participate
The research involving human participants underwent review and approval by the Research Ethics Committee of the Second Affiliated Hospital of Harbin Medical University (Ethics Number: KY2023-116). Written informed consent was obtained from all patients who participated in this study.
Acknowledgements
The authors express their gratitude to the members of the Future Medical Laboratory for their valuable insights and helpful suggestions.
Funding Statement
This study was supported by the Funding for Wu Jieping Medical Foundation’s special funding fund for clinical research (No.320.6750.2022-11-26), Scientific Research Project of Heilongjiang Provincial Health Commission (No. 20220404021089), Open Project Program of Key Laboratory of Preservation of Human Genetic Resources and Disease Control in China (Harbin Medical University) Ministry of Education (No. LPHGRD2022-002).
Conflict of Interests
None.
Availability of Data and Materials
All data used in this study are publicly available. All results of the analyses in this study are available from the corresponding author upon reasonable request. The datasets ANALYZED for this study can be found in the GEO datasets (https://www.ncbi.nlm.nih.gov/geo/query/acc.cgi?acc=GSE153434).
References
- 1.Hiratzka LF, Bakris GL, Beckman JA, et al. 2010 ACCF/AHA/AATS/ACR/ASA/SCA/SCAI/SIR/STS/SVM Guidelines for the diagnosis and management of patients with thoracic aortic disease. A Report of the American College of Cardiology Foundation/American Heart Association Task Force on Practice Guideines, American Association for Thoracic Surgery, American College of Radiology, American Stroke Association, Society of Cardiovascular Anesthesiologists, Society for Cardiovascular Angiography and Interventions, Society of Interventional Radiology, Society of Thoracic Surgeons, and Society for Vascular Medicine. J Am Coll Cardiol 2010; 55: e27-e129.
- 2.Nienaber CA, Clough RE, Sakalihasan N, et al Aortic dissection. Nat Rev Dis Primers. 2016;2:16053. doi: 10.1038/nrdp.2016.53. [DOI] [PubMed] [Google Scholar]
- 3.Mokashi SA, Svensson LG Guidelines for the management of thoracic aortic disease in 2017. Gen Thorac Cardiovasc Surg. 2019;67:59–65. doi: 10.1007/s11748-017-0831-8. [DOI] [PubMed] [Google Scholar]
- 4.Gudbjartsson T, Ahlsson A, Geirsson A, et al Acute type A aortic dissection - a review. Scand Cardiovasc J. 2020;54:1–13. doi: 10.1080/14017431.2019.1660401. [DOI] [PubMed] [Google Scholar]
- 5.Li Y, Ren P, Dawson A, et al Single-Cell Transcriptome Analysis Reveals Dynamic Cell Populations and Differential Gene Expression Patterns in Control and Aneurysmal Human Aortic Tissue. Circulation. 2020;142:1374–1388. doi: 10.1161/CIRCULATIONAHA.120.046528. [DOI] [PMC free article] [PubMed] [Google Scholar]
- 6.Luo S, Kong C, Zhao S, et al Endothelial HDAC1-ZEB2-NuRD Complex Drives Aortic Aneurysm and Dissection Through Regulation of Protein S-Sulfhydration. Circulation. 2023;147:1382–1403. doi: 10.1161/CIRCULATIONAHA.122.062743. [DOI] [PubMed] [Google Scholar]
- 7.Zhang W, Wang M, Gao K, et al Pharmacologic IRE1alpha kinase inhibition alleviates aortic dissection by decreasing vascular smooth muscle cells apoptosis. Int J Biol Sci. 2022;18:1053–1064. doi: 10.7150/ijbs.63593. [DOI] [PMC free article] [PubMed] [Google Scholar]
- 8.Malbec L, Zhang T, Chen YS, et al Dynamic methylome of internal mRNA N(7)-methylguanosine and its regulatory role in translation. Cell Res. 2019;29:927–41. doi: 10.1038/s41422-019-0230-z. [DOI] [PMC free article] [PubMed] [Google Scholar]
- 9.Arguello AE, DeLiberto AN, Kleiner RE RNA Chemical Proteomics Reveals the N(6)-Methyladenosine (m(6)A)-Regulated Protein-RNA Interactome. J Am Chem Soc. 2017;139:17249–17252. doi: 10.1021/jacs.7b09213. [DOI] [PubMed] [Google Scholar]
- 10.Peng X, Li Z, Cai L, et al A bioinformatics analysis of the susceptibility genes in Stanford type A aortic dissection. J Thorac Dis. 2023;15:1694–1703. doi: 10.21037/jtd-23-308. [DOI] [PMC free article] [PubMed] [Google Scholar]
- 11.Wang P, Wang Z, Zhang M, et al KIAA1429 and ALKBH5 oppositely influence aortic dissection progression via regulating the maturation of Pri-miR-143-3p in an m6A-dependent manner. Front Cell Dev Biol. 2021;9:668377. doi: 10.3389/fcell.2021.668377. [DOI] [PMC free article] [PubMed] [Google Scholar]
- 12.Zhou Z, Liu Y, Zhu X, et al Exaggerated autophagy in Stanford type A aortic dissection: a transcriptome pilot analysis of human ascending aortic tissues. Genes. 2020;11:1187. doi: 10.3390/genes11101187. [DOI] [PMC free article] [PubMed] [Google Scholar]
- 13.Davis S, Meltzer PS GEOquery: a bridge between the Gene Expression Omnibus (GEO) and BioConductor. Bioinformatics. 2007;23:1846–1847. doi: 10.1093/bioinformatics/btm254. [DOI] [PubMed] [Google Scholar]
- 14.Zhou X, Chen Z, Zhou J, Liu Y, Fan R, Sun T Transcriptome and N6-Methyladenosine RNA Methylome Analyses in Aortic Dissection and Normal Human Aorta. Front Cardiovasc Med. 2021;8:627380. doi: 10.3389/fcvm.2021.627380. [DOI] [PMC free article] [PubMed] [Google Scholar]
- 15.Ritchie ME, Phipson B, Wu D, et al limma powers differential expression analyses for RNA-sequencing and microarray studies. Nucleic Acids Res. 2015;43:e47. doi: 10.1093/nar/gkv007. [DOI] [PMC free article] [PubMed] [Google Scholar]
- 16.Robinson MD, McCarthy DJ, Smyth GK edgeR: a Bioconductor package for differential expression analysis of digital gene expression data. Bioinformatics (Oxford, England) 2010;26:139–140. doi: 10.1093/bioinformatics/btp616. [DOI] [PMC free article] [PubMed] [Google Scholar]
- 17.Subramanian A, Tamayo P, Mootha VK, et al Gene set enrichment analysis: a knowledge-based approach for interpreting genome-wide expression profiles. Proc Natl Acad Sci U S A. 2005;102:15545–15550. doi: 10.1073/pnas.0506580102. [DOI] [PMC free article] [PubMed] [Google Scholar]
- 18.Hänzelmann S, Castelo R, Guinney J GSVA: gene set variation analysis for microarray and RNA-seq data. BMC Bioinformatics. 2013;14:7. doi: 10.1186/1471-2105-14-7. [DOI] [PMC free article] [PubMed] [Google Scholar]
- 19.Szklarczyk D, Morris JH, Cook H, et al The STRING database in 2017: quality-controlled protein-protein association networks, made broadly accessible. Nucleic Acids Res. 2017;45:D362–D368. doi: 10.1093/nar/gkw937. [DOI] [PMC free article] [PubMed] [Google Scholar]
- 20.Friedman J, Hastie T, Tibshirani R Regularization Paths for Generalized Linear Models via Coordinate Descent. J Stat Softw. 2010;33:1–22. [PMC free article] [PubMed] [Google Scholar]
- 21.Yu G, Wang LG, Han Y, He QY clusterProfiler: an R package for comparing biological themes among gene clusters. OMICS. 2012;16:284–287. doi: 10.1089/omi.2011.0118. [DOI] [PMC free article] [PubMed] [Google Scholar]
- 22.Langfelder P, Horvath S WGCNA: an R package for weighted correlation network analysis. BMC Bioinformatics. 2008;9:559. doi: 10.1186/1471-2105-9-559. [DOI] [PMC free article] [PubMed] [Google Scholar]
- 23.Rylski B, Schilling O, Czerny M Acute aortic dissection: evidence, uncertainties, and future therapies. Eur Heart J. 2023;44:813–821. doi: 10.1093/eurheartj/ehac757. [DOI] [PubMed] [Google Scholar]
- 24.Matthews CR, Madison M, Timsina LR, Namburi N, Faiza Z, Lee LS Impact of time between diagnosis to treatment in Acute Type A Aortic Dissection. Sci Rep. 2021;11:3519. doi: 10.1038/s41598-021-83180-6. [DOI] [PMC free article] [PubMed] [Google Scholar]
- 25.Qiao Y, Sun Q, Chen X, et al Nuclear m6A reader YTHDC1 promotes muscle stem cell activation/proliferation by regulating mRNA splicing and nuclear export. Elife. 2023;12:e82703. doi: 10.7554/eLife.82703. [DOI] [PMC free article] [PubMed] [Google Scholar]
- 26.Jiang X, Liu B, Nie Z, et al The role of m6A modification in the biological functions and diseases. Signal Transduct Target Ther. 2021;6:74. doi: 10.1038/s41392-020-00450-x. [DOI] [PMC free article] [PubMed] [Google Scholar]
- 27.Yin F, Liu K, Peng W, et al The Effect of N6-Methyladenosine Regulators and m6A Reader YTHDC1-Mediated N6-Methyladenosine Modification Is Involved in Oxidative Stress in Human Aortic Dissection. Oxid Med Cell Longev. 2023;2023:3918393. doi: 10.1155/2023/3918393. [DOI] [PMC free article] [PubMed] [Google Scholar]
- 28.Roundtree IA, Luo GZ, Zhang Z, et al YTHDC1 mediates nuclear export of N(6)-methyladenosine methylated mRNAs. Elife. 2017;6:e31311. doi: 10.7554/eLife.31311. [DOI] [PMC free article] [PubMed] [Google Scholar]
- 29.Fan Y, Li X, Sun H, et al Role of WTAP in Cancer: From Mechanisms to the Therapeutic Potential. Biomolecules. 2022;12:1224. doi: 10.3390/biom12091224. [DOI] [PMC free article] [PubMed] [Google Scholar]
- 30.Vesely C, Jantsch MF An I for an A: Dynamic Regulation of Adenosine Deamination-Mediated RNA Editing. Genes (Basel) 2021;12:1026. doi: 10.3390/genes12071026. [DOI] [PMC free article] [PubMed] [Google Scholar]
- 31.Wang Y, Chung DH, Monteleone LR, et al RNA binding candidates for human ADAR3 from substrates of a gain of function mutant expressed in neuronal cells. Nucleic Acids Res. 2019;47:10801–10814. doi: 10.1093/nar/gkz815. [DOI] [PMC free article] [PubMed] [Google Scholar]
- 32.Cao T, Pan W, Sun X, Shen H Increased expression of TET3 predicts unfavorable prognosis in patients with ovarian cancer-a bioinformatics integrative analysis. J Ovarian Res. 2019;12:101. doi: 10.1186/s13048-019-0575-4. [DOI] [PMC free article] [PubMed] [Google Scholar]
- 33.Ponnaluri VK, Maciejewski JP, Mukherji M A mechanistic overview of TET-mediated 5-methylcytosine oxidation. Biochem Biophys Res Commun. 2013;436:115–120. doi: 10.1016/j.bbrc.2013.05.077. [DOI] [PubMed] [Google Scholar]
- 34.Ma S, Yan J, Barr T, et al The RNA m6A reader YTHDF2 controls NK cell antitumor and antiviral immunity. J Exp Med. 2021;218:e20210279. doi: 10.1084/jem.20210279. [DOI] [PMC free article] [PubMed] [Google Scholar]
- 35.Zheng Q, Hou J, Zhou Y, et al The RNA helicase DDX46 inhibits innate immunity by entrapping m(6)A-demethylated antiviral transcripts in the nucleus. Nat Immunol. 2017;18:1094–1103. doi: 10.1038/ni.3830. [DOI] [PubMed] [Google Scholar]
- 36.Du J, Ji H, Ma S, et al m6A regulator-mediated methylation modification patterns and characteristics of immunity and stemness in low-grade glioma. Brief Bioinform. 2021;22:bbab013. doi: 10.1093/bib/bbab013. [DOI] [PubMed] [Google Scholar]
- 37.Yang S, Wei J, Cui YH, et al m(6)A mRNA demethylase FTO regulates melanoma tumorigenicity and response to anti-PD-1 blockade. Nat Commun. 2019;10:2782. doi: 10.1038/s41467-019-10669-0. [DOI] [PMC free article] [PubMed] [Google Scholar]
- 38.Ye J, Wang Y, Wang Z, et al Circulating Th1, Th2, Th9, Th17, Th22, and Treg Levels in Aortic Dissection Patients. Mediators Inflamm. 2018;2018:5697149. doi: 10.1155/2018/5697149. [DOI] [PMC free article] [PubMed] [Google Scholar]
Associated Data
This section collects any data citations, data availability statements, or supplementary materials included in this article.
Supplementary Materials
Supplementary data to this article can be found online.
Data Availability Statement
All data used in this study are publicly available. All results of the analyses in this study are available from the corresponding author upon reasonable request. The datasets ANALYZED for this study can be found in the GEO datasets (https://www.ncbi.nlm.nih.gov/geo/query/acc.cgi?acc=GSE153434).


