Abstract
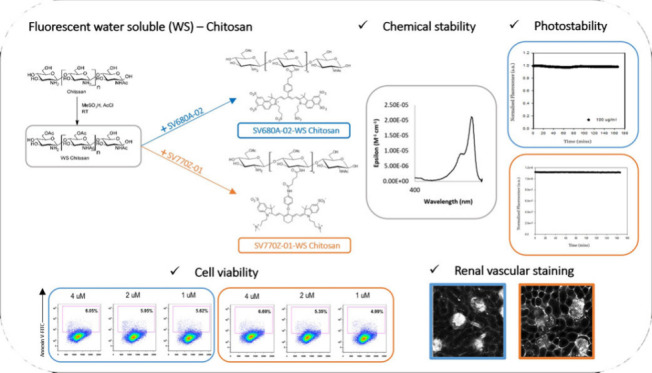
Over the last decades, various tissue-clearing techniques have broken the ground for the optical imaging of whole organs and whole-organisms, providing complete representative data sets of three-dimensional biological structures. Along with advancements in this field, the development of fluorescent markers for staining vessels and capillaries has offered insights into the complexity of vascular networks and their impact on disease progression. Here we describe the use of a modified water-soluble chitosan linked to cyanine dyes in combination with ethyl cinnamate-based optical tissue clearing for the 3D visualization of tissue vasculature in depth. The water-soluble fluorescent Chitosans have proven to be an optimal candidate for labeling both vessels and capillaries ex vivo thanks to their increased water solubility, high photostability, and optical properties in the near-infrared window. In addition, the nontoxicity of these markers broadens their applicability to in vitro and in vivo biological applications. Despite the availability of other fluorescent molecules for vascular staining, the present study, for the first time, demonstrates the potential of fluorescent chitosans to depict vessels at the capillary level and opens avenues for advancing the diagnostic field by reducing the complexity and costs of the currently available procedures.
Keywords: fluorescent chitosan, fluorescent microscopy, vascular imaging, fluorescent polymer, whole-organ staining, capillary imaging, tissue clearing
Introduction
The study of complex vascular networks plays a key role in the identification of kidney’s physiological and pathophysiological mechanisms. Structural alterations and malfunction of the vessels can be responsible for impairment of renal function and progression to kidney diseases.1 The three-dimensional (3D) spatial distribution of vascular structures can be investigated by using sophisticated imaging modalities such as magnetic resonance imaging (MRI),2 micro-CT3 and high-end microscopy.4 For instance, micro-CT is applied to visualize the renal vascular structures in 3D and for determining the density of microvessels; however, the features of small-sized blood vessels with a diameter smaller than 10 μm, cannot be determined with accuracy.5 Alternatively, small vessels can be assessed by MRI; however, these techniques require access to high-field-strength MRI scanners and complex regulatory procedures that need to be undertaken for in vivo applications.6 In recent years, the use of advanced microscopy-based techniques in combination with optical tissue clearing (OTC) has gained popularity. These methods allow the acquisition of 3D data that can fully depict the complexity of the vascular architecture, overcoming the limitations related to two-dimensional (2D) information provided by normal histology.7
The introduction of new OTC methods for processing big-sized samples poses new challenges for the selection of effective staining techniques. Overall, vessel labeling can be achieved by using endothelial-specific markers through immunohistochemistry (IHC) protocols or by genetically encoded fluorescent proteins.7−9 Nevertheless, these approaches exhibit some technical limitations when combined with an OTC, such as poor antibody penetration and quenching.
Instead, the introduction of new fluorescent markers for tracking vessels and capillaries offers the possibility to stain whole organisms in depth with the advantage of accelerating the sample preparation.10−12 Recently, fluorescent polymers have emerged as an innovative and a more feasible strategy toward vascular staining. They provide a cheaper, faster, and chemically more stable way to study vascular morphology with a better resolution as compared to the previous state of art.13−16 Fluorescently labeled wheat germ agglutinin (WGA) has been studied in detail for its use alone and in combination with other markers in studying vasculature.16 However, WGA remains an expensive marker and is limited to imaging small blood vessels.15 More recently, Huang et al. showed that the polymer polyethylenimine (PEI) conjugated with a cyanine 7 dye (MHI-148) can efficiently stain blood vessels in the kidneys (Figure 1A).17 The design of MHI-148-PEI was based on the structure and composition of the glomerular capillaries, where a polymer containing positive charges interacts electrostatically with the negatively charged glycosaminoglycans (GAGs).18 Also, a polymer like PEI, with a molecular weight of 70 kDa, and a hydrodynamic diameter of more than 6 nm, cannot cross the glomerular tuft.17,19 Furthermore, the dye MHI-148 is a cyanine 7 dye with spectral features lying in the near-infrared (NIR) region. This provides a better signal-to-noise ratio and deeper tissue penetration when compared to the most common dyes used for fluorescence imaging, such as fluorescein isothiocyanate (FITC).14 The use of MHI-148-PEI in combination with ethyl cinnamate (ECi) clearing has been shown to be effective for displaying large vessels and glomeruli in renal tissue. In this regard, Huang et al. demonstrated that ECi can clear the tissue quickly and in an automated way while preserving the NIR fluorescence of MHI-148.17 Nevertheless, MHI-148-PEI comes with many disadvantages: First and foremost is the cytotoxicity of PEI, which limits its use in life science research and diagnostics.20 Second, PEI is a highly basic polymer with secondary amines with a high pKa (11) in water. It is well-known that cyanine 7 dyes are not stable at high pH due to the formation of an electron-deficient iminium group which is prone to nucleophilic attack, thereby degrading the dye and creating a nonfluorescent marker.21 This has been observed in the absorption spectra of MHI-148-PEI, where, in addition to an Absmax peak around 620 nm, there is a small peak centered at 465 nm, due to the partially degraded dye formed after its conjugation with PEI. This peak subsequently increases in intensity, ultimately leading to the complete degradation of the dye over time under continuous illumination at room temperature (Figure 1B).
Figure 1.
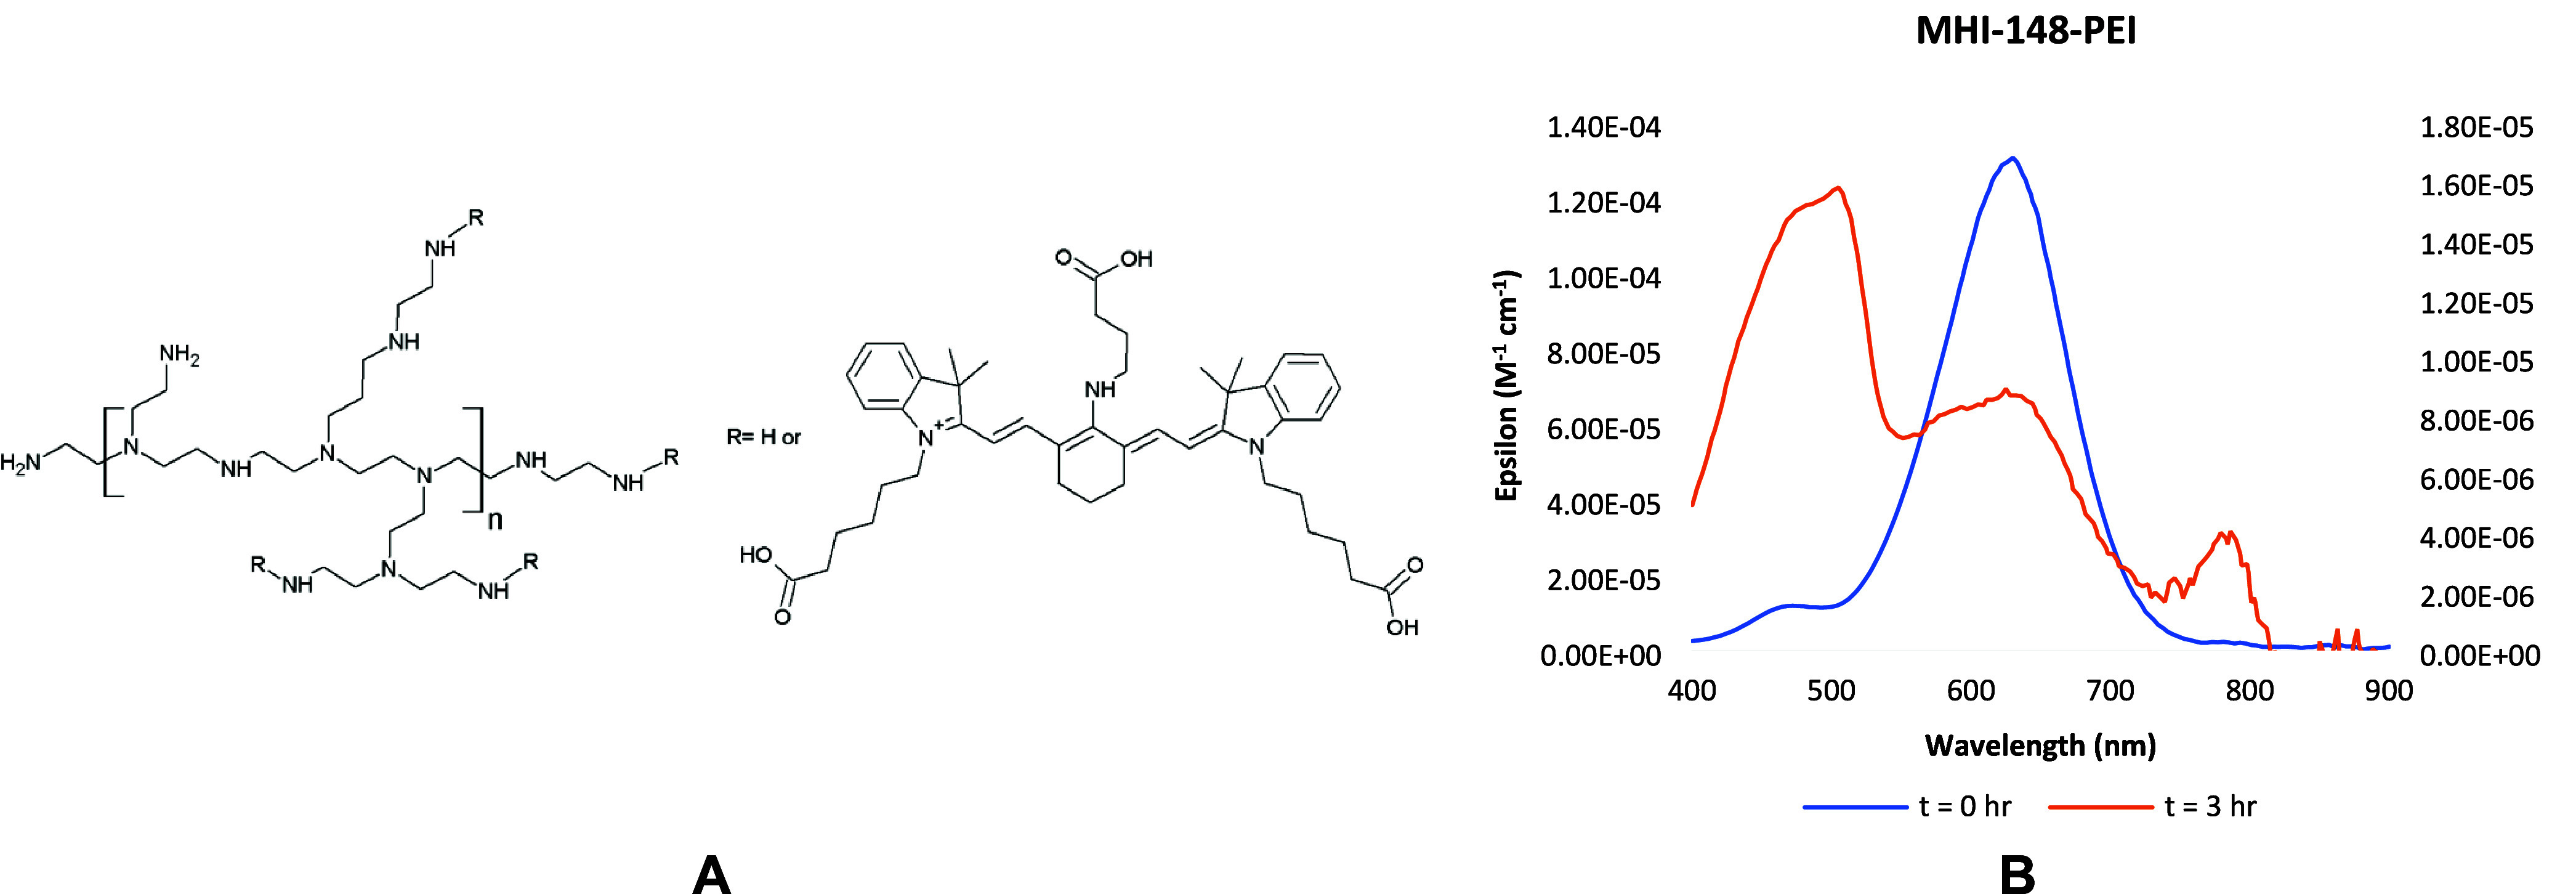
A. Structure of MHI-148-PEI;17 B. Absorption spectra of MHI-148-PEI with a peak at 465 nm coming from the partially degraded dye at t = 0 h (in blue corresponding to the y-axis on the left) and at the end of 3 h (in orange corresponding to the y-axis on the right) of continuous illumination.
The photo- and chemical instability of MHI-148-PEI is also due to the dye itself. The cyanine 7 dye has an aliphatic amine at the meso- position with a lone pair of electrons that can delocalize into the electron-deficient carbon atom and form an iminium cation.21 This renders a nonemissive dye. Moreover, MHI-148 is hypothesized to undergo photoinduced decomposition in aqueous solutions, the same as all the cyanine dyes with meso-aliphatic amine chains.22 Apart from these reasons, MHI-148-PEI has reproducibility issues. MHI-148 contains three end-carboxylic acid groups, each capable of forming an amide bond with PEI, resulting in uncontrolled regioselectivity (Figure 1A). Moreover, we discovered by dialyzing a mixture of the dye and PEI in a solution that at physiological pH the carboxylic acids of the dye and the amines of PEI are charged and can interact with each other electrostatically (data shown in Supporting Information). Therefore, the polymer remains stained with the dye even after 36 h. Moreover, although MHI-148-PEI has been employed in previous studies for staining the renal vasculature and glomeruli, the peritubular capillaries are poorly labeled in the kidney.
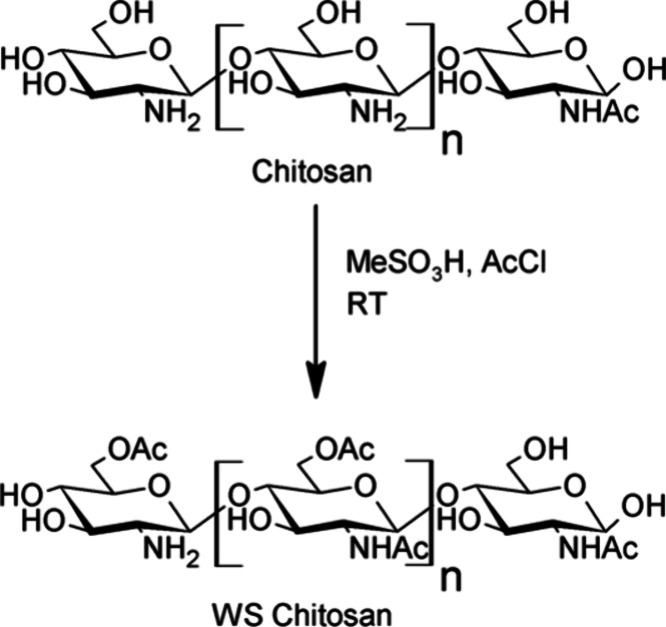
To overcome the shortcomings of the previously used techniques, we focused on developing a nontoxic fluorescent cationic polymer as a tool for visualizing the vascular system, including the small vessels. Among various cationic polymers available, Chitosan was chosen, first because it is a nontoxic naturally occurring polycationic polymer with FDA approval for use as a food additive.23 Then, it is also a weaker base when compared to PEI, without the presence of secondary amines (pKa 6.3).24 Due to its weakly basic nature, chitosan is naturally insoluble in water and organic solvents.25 Therefore, a water-soluble version of chitosan, from here on referred to as WS Chitosan, was synthesized by partial acetylation of the amino and the hydroxyl groups (Figure 2).26 The WS Chitosan was then labeled with cyanine 7-like NIR dyes carrying varying surface charges and optical properties.
Figure 2.
Reaction scheme for synthesizing WS Chitosan26
Results and Discussion
Design of Fluorescent Water-Soluble Chitosans
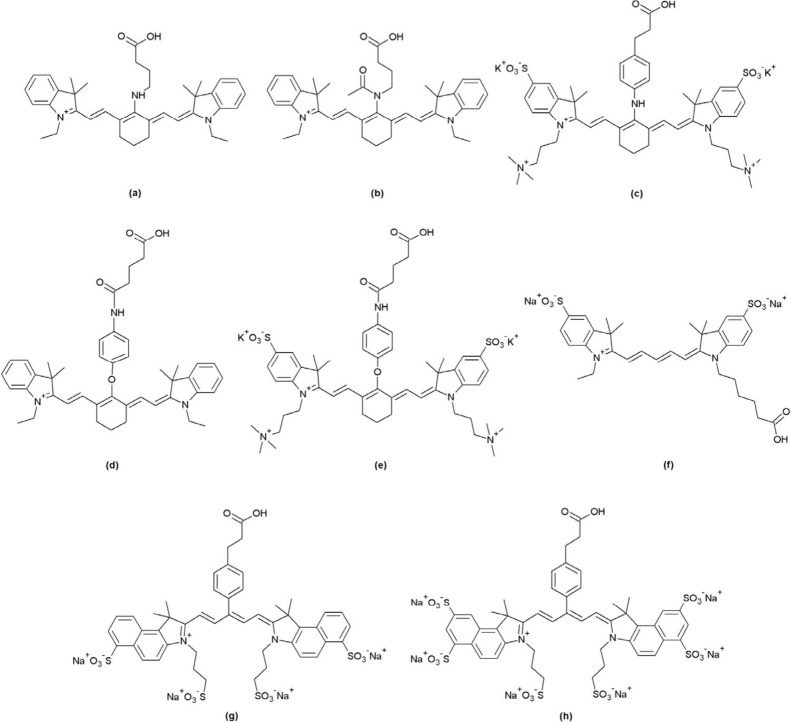
According to the criteria discussed above, a series of water-soluble Chitosans fluorescing in the NIR region were designed. Chitosan, with an average weight of 110 kDa, was modified via partial acetylation of the amino and hydroxyl groups. As reported by Sashiwa et al., the acetylation was carried out using acetyl chloride and methanesulfonic acid (MeSO3) as the solvent.23 MeSO3 protonates the free amines, which slows down their acetylation, thus promoting O-acetylation. Ten equivalents of AcCl were used for the acetylation, rendering WS Chitosan, which still has sufficient free amines to participate either in vascular staining or in forming an amide bond with the NIR dyes. A variety of NIR dyes were used for tagging WS Chitosan, with varying surface charges and optical properties, to extend the use of fluorescent chitosan in different applications and using different imaging modalities (Figure 3).
Figure 3.
Different NIR dyes used for tagging WS Chitosan: (a) SV620C-01, (b)SV770C-01, (c) SV700Z-01, (d) SV770C-02, (e) SV770Z-01, (f) SV645A-01, (g) SV680A-03 and (h) SV680A-02.
First, SV620C-01 (Figure 3A), an analogue of the previously used dye MHI-148 with a single carboxylic acid group, was designed for testing the performance of WS chitosan as a marker. SV620C-01 was conjugated to PEI and to WS Chitosan, to compare the efficiency of WS Chitosan as a polycationic polymer for vascular imaging with respect to PEI. As expected, the partial acetylation of amino and the hydroxyl groups within the polymer creates a space that allows its interaction with the water molecules,26 thereby increasing the efficiency of WS chitosan in staining of ECi-cleared and perfused kidney samples. Once the efficiency of WS Chitosan was confirmed, the instability aspect of the dye was investigated. For this reason, a series of different dyes were produced, all missing the lone pair of electrons at the meso position to avoid iminium formation. SV770C-01 (Figure 3B) has its meso-nitrogen acetylated. This modification caused a bathochromic shift in the NIR region together with a higher molar absorptivity constant, typical of cyanine7-like dyes.27 The substitution of the meso-aliphatic amine by an aromatic amine in SV700Z-01 (Figure 3C) provided a chemically stable zwitterionic NIR dye with a large Stokes shift but with low molar absorptivity constant.21 The introduction of a phenol in the meso-position overcame this problem by affording cyanine7-like dyes in the infrared (IR) region with high molar absorptivity constant (Figure 3D and 3E).21,22 All these dyes are shifted further in the NIR region offering deeper tissue penetration28 compared to SV620C-01. WS Chitosan was also conjugated to anionic cyanine 5 (Figure 3F) and highly anionic cyanine 5.5 (Figure 3G and 4H) dyes to overcome the limitations with many imaging instruments lacking a laser in the NIR region.
Figure 4.
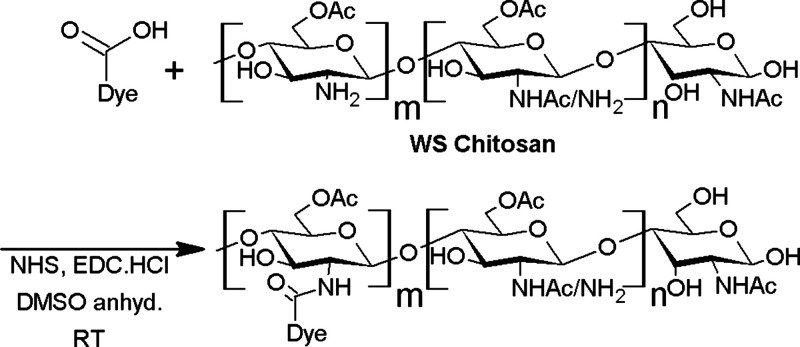
Reaction scheme for labeling WS Chitosan with different dyes, where m ranges from 1 to 25 for all the kidney imaging markers.
The NIR dyes synthesized were then used for the labeling of the WS chitosan via amide bond (Figure 4). All the NIR dyes contained only a single carboxylic acid moiety to increase the specificity of the reaction and the reproducibility of the product. A series of experiments were carried out to optimize the dye/polymer ratio for the marker’s biological application. The detailed synthetic procedures are described in the Supporting Information.
The use of NIR dyes with different surface charges has several advantages. Cationic NIR dyes such as SV770C-01 and SV770C-02 (Figure 3B and 3D respectively) introduce an additional positive charge to the fluorescent polymer, promoting stronger electrostatic interactions with the blood vessels. However, that comes at the cost of poor solubility in water due to their hydrophobicity, and hence they were not used for further biological testing. On the other hand, the zwitterionic and the anionic dyes are highly hydrophilic and increase the solubility of WS Chitosan in water. The negatively charged groups present on these dyes do not affect the efficacy of WS Chitosan in staining the vasculature due the polymer’s big size and large amount of positive charge carried by it. Furthermore, the fluorescent chitosan markers show higher chemical and photostability, leading to lower degradation over time. This is due to the use of more stable dyes and the use of WS Chitosan as the cationic polymer, which does not have secondary amines with highly basic pH that could act as nucleophile on the NIR dyes. These fluorophores no longer show an absorption peak at 465 nm (Figure 5). This aspect is very important in autofluorescence experiments for the acquisition of morphological information on tissues, performed with the excitation source at 488 nm.
Figure 5.
A peak at 465 nm typical of a partially degraded dye is not present in the case of the cyanine dyes used for labeling WS Chitosan.
Autofluorescence, in fact, is known also as primary fluorescence and is due to the presence of natural biological fluorescent components in the tissue.29 Recently, it has been found that autofluorescence may be beneficial for microscopic organism analysis and for distinguishing the tissue morphology in deparaffinised and cleared thick specimens.30
Physicochemical Properties and Optical Characterization
The conjugation of the NIR dyes with WS Chitosan does not have any influence on the optical properties of the dyes.31 As described in Table 1, NIR fluorescent Chitosans are provided in a range of absorption and emission wavelengths, allowing for selection based on the choice of instrument and available excitation lasers. By absorbing and emitting in the NIR region, all the markers provide excellent resolution with deeper tissue penetration and very low background noise when compared to traditional imaging techniques such as MRI, computed tomography, and ultrasound. Also, except for SV700Z-01, all the NIR dyes have a higher molar absorptivity constant when compared to MHI-148 and SV620C-01, thereby reducing the dosage needed to visualize the vasculature. For this reason, SV700Z-01-WS Chitosan was not the preferred marker for vascular imaging.
Table 1. Photophysical Properties of the Dyes Used for Labeling WS Chitosan.
| Dye | Absmax (λ) (nm) | Emmax (λ) (nm) | Stokes shift (nm) | ε (M–1 cm–1) | Net charge |
|---|---|---|---|---|---|
| MHI-148 | 654 | 774 | 120 | 90,000 | +1 |
| SV620C-01 | 620 | 750 | 130 | 90,000 | +1 |
| SV770C-01 | 770 | 805 | 35 | 270,000 | +1 |
| SV770C-02 | 770 | 805 | 35 | 270,000 | +1 |
| SV680A-02 | 677 | 703 | 26 | 240,000 | –6 |
| SV680A-03 | 677 | 703 | 26 | 240,000 | –4 |
| SV645A-01 | 641 | 663 | 22 | 250,000 | –2 |
| SV700Z-01 | 700 | 792 | 92 | 76,000 | 0 |
| SV770Z-01 | 770 | 805 | 35 | 270,000 | 0 |
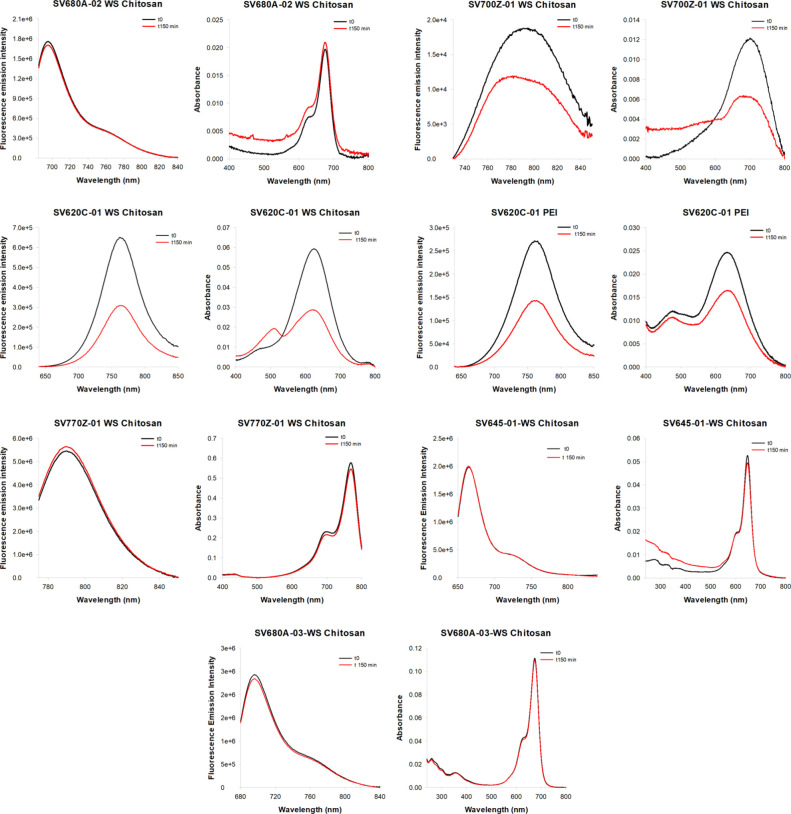
Photostability analyses were conducted on a selection of dyes based on their optical properties across different regions of the electromagnetic spectrum and with varying functional groups at the meso position to ensure the comparison of markers with different modifications (Table 1). The analyses were performed in phosphate buffered saline (PBS) at pH 7.4 at 25 °C. The NIR dyes were subjected to continuous illumination, and additionally, absorption and fluorescence emission spectra were acquired at the initial time point and at the end of the photostability assay to characterize any alterations in the dyes’ spectral properties. The fluorescence decay profiles were generated by plotting the fluorescence intensity as a function of time (Figure 6).
Figure 6.
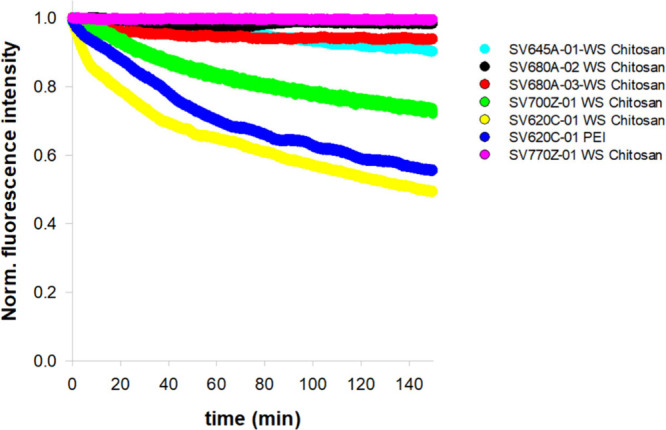
Fluorescence decay of the NIR dyes in phosphate buffered saline (PBS), pH 7.4, at 25 °C. Samples were continuously illuminated over a period of 150 min. Fluorescence emission kinetics were normalized to the initial time point.
The photostability assays revealed notable differences in the degradation levels of the tested NIR dyes. Specifically, SV620C-01 exhibited the faster fluorescence decay, whether conjugated to WS Chitosan or PEI, confirming its reduced stability compared to the other tested molecules, is intrinsic to the dye itself.21,22 Therefore, SV620C-01 was not tested further in biological experiments. Among the tested dyes conjugated to WS Chitosan, SV680A-02-WS Chitosan and SV770Z-01-WS Chitosan proved to be the most stable, followed by SV700Z-01-WS Chitosan.
Accordingly, Figure 7 reports the absorbance and fluorescence emission spectra of the tested dyes before and after 150 min of illumination, showing the most significant variations in the case of SV620C-01-PEI, SV620C-01-WS Chitosan and SV700Z-01-WS Chitosan.
Figure 7.
Fluorescence emission and absorbance spectra of NIR dyes before (black curves) and after 150 min of continuous illumination (red curves) in phosphate-buffered saline (PBS), pH 7.4, at 25 °C.
Biological Imaging
All the tissue samples for OTC were collected after mice perfusion and were subjected to ECi based OTC according to the protocol described by Huang et al.17 A confocal microscope was used for imaging, employing a long-working-distance objective to ensure in-depth imaging of thick specimens. Microscopic examination of ECi-cleared tissue allowed for the evaluation of the vascular staining obtained employing the newly synthesized compounds. A 10 mL solution of SV680A-02-WS Chitosan and SV770Z-01-WS Chitosan was administrated at the concentration of 2 μM for retrograde perfusion while the PEI conjugates were tested at the concentration of 14.2 μM.32,33 Due to the differences between the brightness of the dyes used in PEI-conjugates (SV620C-01 and MHI-148) and the fluorescent chitosans (SV680A-02 and SV770Z-01), it was not possible to use the same concentration for the new markers, as at 14.2 μM concentration the fluorescence of the chitosan is in saturation, and it is not possible to visualize anything. Therefore, the marker was diluted to as low as 1 μM; however, the resolution of the images was poor at this concentration. Upon doubling this concentration (2 μM), we were able to get effective staining and consequent visualization of the vascular system, with excellent resolution. These results led us to consider the investigation of other concentrations unnecessary. The two chitosan conjugates were selected based on their chemical stability and higher water solubility that is an essential requirement for ensuring the reliability of biological applications. In this regard, Figure 8 shows the renal vascular network in mouse kidney sections stained by different markers evidencing that the two fluorescent Chitosans provide a better visualization of renal peritubular capillaries compared to PEI-conjugates (SV620C-01-PEI and MHI-148-PEI).
Figure 8.
Comparison of three ECi-cleared and perfused kidney samples stained with SV770Z-01-WS Chitosan (A), SV680A-02-WS Chitosan (B), MHI-148-PEI (C), and SV620C-01-PEI (D).
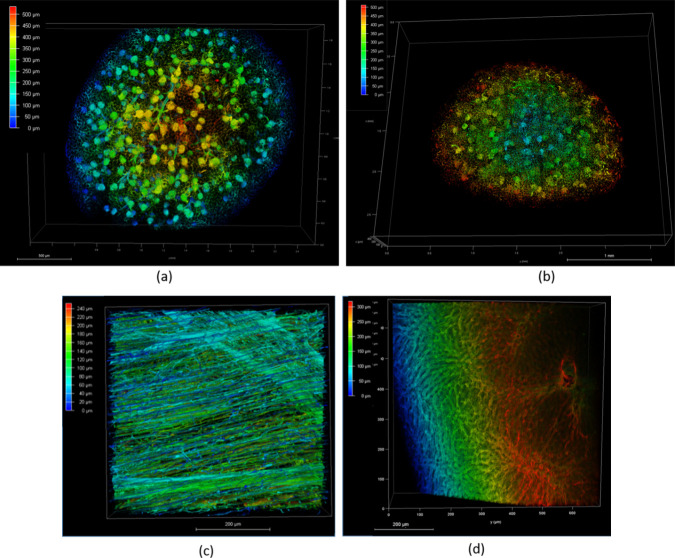
Furthermore, several organs were taken into examination with a major focus on kidney samples. The use of fluorescent chitosan proved to be effective in selectively staining the glomerular tuft as well as the peritubular capillaries in perfused and ECi cleared mouse kidney. The NIR fluorescent chitosan markers stain the renal vasculature in depth allowing the visualization of glomeruli up to 500 μm by confocal microscopy (Figure 9A and 9B). To investigate whether the new compounds can effectively reach the vasculature in other organs, several samples were harvested after perfusion, such as the mouse diaphragm and mouse liver. After perfusion, the diaphragm is thin and light-colored, and following the ECi clearing, it can be easily mounted on a glass slide (whole mounting) for imaging. The mouse diaphragm was selected for the analysis of the muscular tissue and shows a dense vascularisation as in Figure 9C. In addition, the lateral lobe of the liver that was collected and cleared by ECi, was examined by confocal microscopy. Figure 9D shows the vascular network in the mouse liver labeled by SV680A-02-WS Chitosan.
Figure 9.
3D Sections of mouse kidney, diaphragm, and liver acquired by CM using a 16× objective in immersion oil, 638 channel, color-coded image for depth perception from red (closer) to blue (farther): (a) Kidney section stained with SV680A-02-WS Chitosan; Scale bar: 500 μm; (b) Kidney section stained with SV770Z-01-WS Chitosan; Scale bar: 1 mm; (c) Diaphragm section stained with SV680A-02-WS Chitosan; Scale bar: 200 μm; (d) Mouse liver section stained with SV680A-02-WS Chitosan; Scale bar: 200 μm.
In several works, vessel-labeling has been achieved by means of fluorescent markers, endothelial specific markers, or combinations of molecules with specific properties such as carbocyanine dyes and lectins.11,12,34 However, this study has evidenced for the first time that the use of fluorescent WS chitosan is a cost-effective and advantageous solution for imaging the vasculature at the capillary level in a cleared and perfused organ, thus overcoming the drawbacks identified with other OTC reagents.
Cytotoxicity Assays
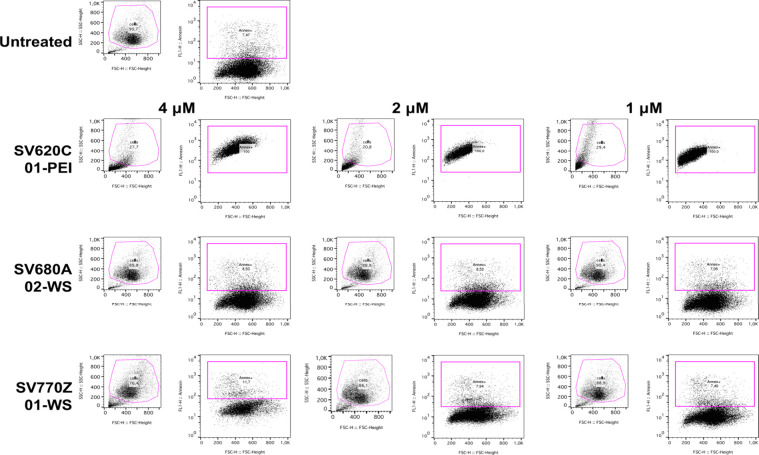
To assess the suitability of chitosan derivatives for ex vivo and in vivo experiments we compared the cytotoxic activity of SV680A-02-WS Chitosan and SV770Z-01-WS Chitosan to PEI in murine embryo fibroblasts (3T3-L1) performing a qualitative and quantitative enumeration of apoptotic cells using the Fluorescence-Activated Cell Sorting (FACS) technique.35 In the following experiments, we chose a 48 h incubation time for our in vitro experiments based on literature reports. Studies have shown that fluorescent organic NIR-II dyes exhibit rapid clearance from the bloodstream (∼5–60 min) with subsequent liver uptake within 30 min.36 Similarly, PEI demonstrates rapid renal clearance within 24 h postinjection.37 This knowledge of clearance times is the basis for our decision to focus on a longer incubation period to confirm the nontoxicity of our chitosan derivatives. As shown in Figure 10, after 48 h cells treated with fluorescent chitosan derivatives, SV680A-02-WS Chitosan and SV770Z-01-WS Chitosan, showed minimal cell death at all tested concentrations when compared to untreated cells. In contrast, the analysis of cell population integrity using side scatter (SSC) and forward scatter (FSC) light parameters revealed the detrimental effect of PEI on 3T3-L1 cells. This was observed as a clear population of damaged cells, confirming that treatment with SV620C-01-PEI induced 100% cell death at all tested concentrations. Kruskal–Wallis statistical analysis revealed no significant difference in the percentage of apoptotic cells (Annexin+ cells) between SV680A-02-WS Chitosan and SV770Z-01-WS Chitosan-treated cells compared with the untreated control cells. However, treatment with SV770Z-01-WS Chitosan resulted in a slightly higher, although not statistically significant, percentage of apoptotic cells. These results have been summarized in Table 2.
Figure 10.
Flow cytometry analysis of apoptosis in 3T3-L1 cells treated with chitosan derivatives. The figure shows a representative flow cytometry pseudo color dot plot of 3T3-L1 cells treated with 4, 2, and 1 μM of each indicated compound for 48 h. The cells were stained with a mixture of Annexin V-fluorescein and PI. The axis scales for fluorescence are reported as log, and the axis scales for FSC and SSC are reported as linear. Cell debris and events with low light scatter (background noise) are excluded from the analysis.
Table 2. Percentage of the Apoptotic Cellsa.
| Sample type | 0 μM | 14.2 μM | 4 μM | 2 μM | 1 μM |
|---|---|---|---|---|---|
| 6.93 ± 0.17 6.92(6.59–7.29) | -- | -- | -- | -- | |
| SV620C-01-PEI | 100 | 100 | 100 | 100 | |
| SV680A-02-WS Chitosan | -- | 7.28 ± 0.34 6.86(6.79–7.99) | 7.1 ± 0.37 6.94(6.55–7.74) | 6.42 ± 0.51 6.75(5.53–7.15) | |
| SV770Z-01-WS Chitosan | -- | 9.42 ± 0.63 8.71(8.44–10.77) | 7.24 ± 0.49 7.32(6.16–8.28) | 6.91 ± 0.3 6.68(6.31–7.62) |
Apoptotic cells (Annexin+ cells) were quantified using flow cytometry data upon Annexin V/PI staining following 48 h of treatment with the indicated compound. Values, arising from five independent experiments, are presented as mean ± SEM and median (25th percentile-75th percentile) relative to the total parental cell population. Data are presented as mean ± SEM median [IQR].
We would remark that the fluorescence of alive cells following SV770Z-01-WS Chitosan treatment could also be due to fluorescence arising from the molecule’s emission at the shorter wavelength end of its spectrum, potentially compromising the qualitative analysis of annexin-positive and -negative cells.
To further elucidate the biological effects of chitosan derivatives, we also investigated their cellular uptake using fluorescence microscopy following a 48 h incubation period. As depicted in Figure S37 of Supporting Information, cells treated with the chitosan derivatives exhibit fluorescence, indicating their staining after 48 h.
In conclusion, while a higher dose of PEI might improve renal capillary labeling, its cytotoxicity even at low concentrations makes it inappropriate for live-imaging techniques. Conversely, both SV680A-02-WS Chitosan and SV770Z-01-WS Chitosan are suitable for ex vivo and in vivo experiments and might be safely used at their lower concentrations for capillary staining.
Methods
WS Chitosan
In a 100 mL round-bottom flask, Chitosan (2.2 g, 0.0169 mmol, 1 equiv) (Sigma-Aldrich, Switzerland, Product Number 448869) was stirred in 22 mL of methanesulfonic acid (Sigma-Aldrich, USA, Product Number 471356). After 1.5 h, acetyl chloride (TCI, Japan, Product Number: A0082) was added to this flask and was stirred altogether for 5 h. The reaction was stopped by adding 50 g of ice to the flask, and the reaction mixture was transferred to a dialysis bag (ThermoFisher Slide-A-Lyzer Dialysis Flask, 2K MWCO, 250 mL) and dialyzed against Milli-Q water. After 36 h, the content of the dialysis bag was neutralized using sodium bicarbonate solution and continued to dialyse for 2 days. The dialyzing medium was changed every 12 h. After 2 days, the content of the dialysis bag was freeze-dried to give a white solid (WS Chitosan, 1.45 g, yield 66.4%). 1H NMR (600 MHz, 0.5 M DCl/D2O): 1.58–2.0 (m, 4.46 H), 2.52 (s, 0.27 H), 3.22–3.70 (m, 8.36 H), 4.58 (m, 0.79H).26
Fluorescent WS Chitosan
In a 25 mL round-bottom flask, a mixture of fluorescent dye (SV620C-01/ SV770C-01/SV700Z-01/SV770C-02/SV770Z-01/SV645A-01/SV680A-03/SV680A-02, 40 equiv), N-hydroxy succinimide (200 equiv) (Sigma-Aldrich, Switzerland, Product Number 130672) and 1-ethyl-3-(3-dimethylamino-propyl) carbodiimide (200 equiv) (Sigma-Aldrich, Switzerland, Product Number 03450) was stirred in anhydrous DMSO at room temperature under argon for 20 min. To this reaction mixture was added a solution of WS Chitosan (1 equiv) in anhydrous DMSO and the mixture stirred altogether for 4.5 h at room temperature. The reaction was stopped, and the content of the flask was transferred to a dialysis bag (Sigma-Aldrich Pur-A-Lyzer Mega Dialysis Kit Product code PURG35015–1KT). The reaction mix was dialyzed against 1× PBS buffer (pH 7.4) for 24 h with change of the dialysis medium every 12 h, and later against Milli-Q water for another 12 h. The resulting solution inside the dialysis bag was lyophilized to obtain a lyophilized powder with varying optical properties, depending on the dye used for conjugation (see Table 1).
SV620C-01-PEI
In a 25 mL round-bottom flask, a mixture of SV620C-01 (0.025 g, 0.04 mmol, 15 equiv), N-hydroxy succinimide (0.02 g, 0.18 mmol, 60 equiv) and 1-ethyl-3-(3-dimethylamino- propyl) carbodiimide (0.028 g, 0.18 mmol, 60 equiv) was stirred in 5 mL of anhydrous DMSO at room temperature under argon for 20 min. To this reaction mixture, a solution of polyethylenimine (PEI) 70 kDa (Polysciences Inc., USA, Product Number 06090-25) in size (0.25 g, 0.003 mmol, 1 equiv) in 10 mL anhydrous DMSO was added and stirred altogether for 4.5 h at room temperature. The reaction was stopped, and the content of the flask was transferred to a dialysis bag (Sigma-Aldrich Pur-A-Lyzer Mega Dialysis Kit Product code PURG35015–1KT). The reaction mix was dialyzed against 1× PBS buffer (pH 7.4) for 36 h with change of the dialysis medium every 12 h. The resulting solution inside the dialysis bag was lyophilized to obtain a blue powder (SV620C-01-PEI, 0.17 g, 70% yield). ε: 90,000 M–1 cm–1. λab: 620 nm; λem: 750 nm.
Conclusions
This research demonstrated the feasibility of using fluorescent Chitosans as an improved class of markers for vascular staining. Chitosan has many advantages over other cationic polymers due to its natural occurrence, cost-effectiveness, FDA-approval for biological use and nontoxicity.24 The modified WS chitosan has the added advantage of its solubility in water, thereby allowing for solvent-free testing of these fluorescent markers in biological systems. Additionally, the high photostability, chemical stability, and reproducibility of the fluorescent Chitosans contribute to a better performance for biological applications. It was also demonstrated that these markers are suitable for staining the vascular structures of various organs at capillary level and at lower concentrations than other fluorescent tracers, which could be due to the specificity of polymer itself or the high molar absorptivity of the dyes. Overall, fluorescent Chitosan markers show promising results for their extended use in various biological applications, both in vivo and ex vivo, for studying whole body vasculature.
Nevertheless, the ability of fluorescent Chitosans to stain renal vasculature at the capillary level raises questions about how the fluorescent polymers can bind the endothelium of renal capillaries differently. For instance, further investigations are needed to understand the impact of the 3D molecular geometry, the hydrophobicity, and molecular weight of the polymers on the molecular mechanism behind their labeling performance. This would enable us to further extend their use in in vivo studies.
Acknowledgments
The authors thank Camela Jost (General Core Equipment unit of the Faculty of Medicine Mannheim) and Viktoria Skude (Animal Unit Team of the Faculty of Medicine Mannheim) for the excellent technical assistance. We would also like extend our gratitude to Matteo Fields for his help with cytotoxicity assays during the revision phase. T.P. thanks the data storage service SDS@hd supported by the Ministry of Science, Research and the Arts Baden-Württemberg and the German Research Foundation through Grants INST 35/1314-1 FUGG and INST 35/1503-1 FUGG and the support of the LIMa Live Cell Imaging at Microscopy Core Facility Platform Mannheim. Finally, we acknowledge Leica Microsystem GmbH, Mannheim, for kindly supporting Stellaris 8 imaging sessions on-site. This study has received funding from the European Union’s Horizon 2020 research and innovation programme under the Marie Skłodowska-Curie Grant agreement no. 813839 (RenalToolBox). E.V. was partially supported through a grant from Regione Emilia-Romagna within the call “Bando Alte Competenze per la Ricerca ed il Trasferimento Tecnologico POR FSE 2014/2020” (to S.B. and L.R.).
Supporting Information Available
The Supporting Information is available free of charge at https://pubs.acs.org/doi/10.1021/cbmi.4c00028.
Additional experimental details, materials, and methods, and synthesis of dyes used for fluorescent labeling of chitosan (PDF)
Author Contributions
∇ S.V. and T.P.contributed equally toward the research. S.V., T.P., R.P. and N.G. conceptualised and investigated the research. S.V. and T.P. devised the methodology. S.V., T.P., E.V., L.R. and F.C. performed data curation and formal analysis. S.V., T.P., R.P. and N.G. are responsible for funding acquisition and project administration. Resources have been provided under various grants that include European Union’s Horizon 2020 Marie Skłodowska-Curie Grant agreement no. 813839 (RenalToolBox), INST 35/1314–1 FUGG, INST 35/1503–1 FUGG and Bando Alte Competenze per la Ricerca ed il Trasferimento Tecnologico POR FSE 2014/2020. R.P., N.B., S.B. and L.R. supervised the research. S.V., T.P., E.V., L.R. and F.C. validated the results. S.V., T.P., E.V. and F.C. carried out the visualization of the results. S.V. and T.P. wrote the original draft. S.V., T.P., R.P., S.B., E.V., L.R., F.C. and D.M. reviewed and edited the manuscript. All authors have read and agreed to the published version of the manuscript.
The authors declare no competing financial interest.
Supplementary Material
References
- Apelt K.; Bijkerk R.; Lebrin F.; Rabelink T. J. Imaging the Renal Microcirculation in Cell Therapy. Cells 2021, 10 (5), 1087. 10.3390/cells10051087. [DOI] [PMC free article] [PubMed] [Google Scholar]
- Beeman S. C.; Zhang M.; Gubhaju L.; Wu T.; Bertram J. F.; Frakes D. H.; Cherry B. R.; Bennett K. M. Measuring glomerular number and size in perfused kidneys using MRI. Am. J. Physiol Renal Physiol 2011, 300 (6), F1454–7. 10.1152/ajprenal.00044.2011. [DOI] [PubMed] [Google Scholar]
- Zagorchev L.; Oses P.; Zhuang Z. W.; Moodie K.; Mulligan-Kehoe M. J.; Simons M.; Couffinhal T. Micro computed tomography for vascular exploration. J. Angiogenes Res. 2010, 2, 7. 10.1186/2040-2384-2-7. [DOI] [PMC free article] [PubMed] [Google Scholar]
- Spangenberg P.; Hagemann N.; Squire A.; Forster N.; Krauss S. D.; Qi Y.; Mohamud Yusuf A.; Wang J.; Gruneboom A.; Kowitz L.; Korste S.; Totzeck M.; Cibir Z.; Tuz A. A.; Singh V.; Siemes D.; Struensee L.; Engel D. R.; Ludewig P.; Martins Nascentes Melo L.; Helfrich I.; Chen J.; Gunzer M.; Hermann D. M.; Mosig A. Rapid and fully automated blood vasculature analysis in 3D light-sheet image volumes of different organs. Cell Rep. Methods 2023, 3 (3), 100436 10.1016/j.crmeth.2023.100436. [DOI] [PMC free article] [PubMed] [Google Scholar]
- Iliescu R.; Fernandez S. R.; Kelsen S.; Maric C.; Chade A. R. Role of renal microcirculation in experimental renovascular disease. Nephrol Dial Transplant 2010, 25 (4), 1079–87. 10.1093/ndt/gfp605. [DOI] [PMC free article] [PubMed] [Google Scholar]
- Puelles V. G.; Bertram J. F. Counting glomeruli and podocytes: rationale and methodologies. Curr. Opin Nephrol Hypertens 2015, 24 (3), 224–230. 10.1097/mnh.0000000000000121. [DOI] [PMC free article] [PubMed] [Google Scholar]
- Tian T.; Yang Z.; Li X. Tissue clearing technique: Recent progress and biomedical applications. J. Anat 2021, 238 (2), 489–507. 10.1111/joa.13309. [DOI] [PMC free article] [PubMed] [Google Scholar]
- Kirschnick N.; Drees D.; Redder E.; Erapaneedi R.; Pereira da Graca A.; Schäfers M.; Jiang X.; Kiefer F. Rapid methods for the evaluation of fluorescent reporters in tissue clearing and the segmentation of large vascular structures. iScience 2021, 24 (6), 102650 10.1016/j.isci.2021.102650. [DOI] [PMC free article] [PubMed] [Google Scholar]
- Molbay M.; Kolabas Z. I.; Todorov M. I.; Ohn T. L.; Ertürk A. A guidebook for DISCO tissue clearing. Mol. Syst. Biol. 2021, 17 (3), e9807 10.15252/msb.20209807. [DOI] [PMC free article] [PubMed] [Google Scholar]
- Honeycutt S. E; O'Brien L. L njection of Evans blue dye to fluorescently label and image intact vasculature. BioTechniques 2021, 70 (3), 181–185. 10.2144/btn-2020-0152. [DOI] [PMC free article] [PubMed] [Google Scholar]
- Li Y.; Song Y.; Zhao L.; Gaidosh G.; Laties A. M.; Wen R. Direct labeling and visualization of blood vessels with lipophilic carbocyanine dye DiI. Nat. Protoc 2008, 3 (11), 1703–8. 10.1038/nprot.2008.172. [DOI] [PMC free article] [PubMed] [Google Scholar]
- Robertson R. T.; Levine S. T.; Haynes S. M.; Gutierrez P.; Baratta J. L.; Tan Z.; Longmuir K. J. Use of labeled tomato lectin for imaging vasculature structures. Histochem Cell Biol. 2015, 143 (2), 225–34. 10.1007/s00418-014-1301-3. [DOI] [PubMed] [Google Scholar]
- Di Giovanna A. P.; Tibo A.; Silvestri L.; Mullenbroich M. C.; Costantini I.; Allegra Mascaro A. L.; Sacconi L.; Frasconi P.; Pavone F. S. Whole-Brain Vasculature Reconstruction at the Single Capillary Level. Sci. Rep 2018, 8 (1), 12573 10.1038/s41598-018-30533-3. [DOI] [PMC free article] [PubMed] [Google Scholar]
- Huang J.; Gretz N. Light-Emitting Agents for Noninvasive Assessment of Kidney Function. ChemistryOpen 2017, 6 (4), 456–471. 10.1002/open.201700065. [DOI] [PMC free article] [PubMed] [Google Scholar]
- Todorov M. I.; Paetzold J. C.; Schoppe O.; Tetteh G.; Shit S.; Efremov V.; Todorov-Völgyi K.; Düring M.; Dichgans M.; Piraud M.; Menze B.; Ertürk A. Machine learning analysis of whole mouse brain vasculature. Nat. Methods 2020, 17 (4), 442–449. 10.1038/s41592-020-0792-1. [DOI] [PMC free article] [PubMed] [Google Scholar]
- Tsai P. S.; Kaufhold J. P.; Blinder P.; Friedman B.; Drew P. J.; Karten H. J.; Lyden P. D.; Kleinfeld D. Correlations of neuronal and microvascular densities in murine cortex revealed by direct counting and colocalization of nuclei and vessels. J. Neurosci. 2009, 29 (46), 14553–70. 10.1523/JNEUROSCI.3287-09.2009. [DOI] [PMC free article] [PubMed] [Google Scholar]
- Huang J.; Brenna C.; Khan A. U. M.; Daniele C.; Rudolf R.; Heuveline V.; Gretz N. A cationic near infrared fluorescent agent and ethyl-cinnamate tissue clearing protocol for vascular staining and imaging. Sci. Rep 2019, 9 (1), 521. 10.1038/s41598-018-36741-1. [DOI] [PMC free article] [PubMed] [Google Scholar]
- Longmire M.; Choyke P. L.; Kobayashi H. Clearance properties of nano-sized particles and molecules as imaging agents: considerations and caveats. Nanomedicine (Lond) 2008, 3 (5), 703–17. 10.2217/17435889.3.5.703. [DOI] [PMC free article] [PubMed] [Google Scholar]
- Ruggiero A.; Villa C. H.; Bander E.; Rey D. A.; Bergkvist M.; Batt C. A.; Manova-Todorova K.; Deen W. M.; Scheinberg D. A.; McDevitt M. R. Paradoxical glomerular filtration of carbon nanotubes. Proc. Natl. Acad. Sci. U. S. A. 2010, 107 (27), 12369–74. 10.1073/pnas.0913667107. [DOI] [PMC free article] [PubMed] [Google Scholar]
- Vala K.; Yadollah O. Cytotoxic Impacts of Linear and Branched Polyethylenimine Nanostructures in A431 Cells. BioImpacts 2011, 1 (1), 23–30. 10.5681/bi.2011.004. [DOI] [PMC free article] [PubMed] [Google Scholar]
- Exner R. M.; Cortezon-Tamarit F.; Pascu S. I. Explorations into the Effect of meso-Substituents in Tricarbocyanine Dyes: A Path to Diverse Biomolecular Probes and Materials. Angew. Chem., Int. Ed. Engl. 2021, 60 (12), 6230–6241. 10.1002/anie.202008075. [DOI] [PMC free article] [PubMed] [Google Scholar]
- Samanta A.; Vendrell M.; Das R.; Chang Y. T. Development of photostable near-infrared cyanine dyes. Chem. Commun. (Camb) 2010, 46 (39), 7406–8. 10.1039/c0cc02366c. [DOI] [PubMed] [Google Scholar]
- Abourehab M. A. S.; Pramanik S.; Abdelgawad M. A.; Abualsoud B. M.; Kadi A.; Ansari M. J.; Deepak A. Recent Advances of Chitosan Formulations in Biomedical Applications. Int. J. Mol. Sci. 2022, 23 (18), 10975. 10.3390/ijms231810975. [DOI] [PMC free article] [PubMed] [Google Scholar]
- Jiménez-Gómez C. P.; Cecilia J. A. Chitosan: A Natural Biopolymer with a Wide and Varied Range of Applications. Molecules 2020, 25 (17), 3981. 10.3390/molecules25173981. [DOI] [PMC free article] [PubMed] [Google Scholar]
- Aranaz I.; Alcantara A. R.; Civera M. C.; Arias C.; Elorza B.; Heras Caballero A.; Acosta N. Chitosan: An Overview of Its Properties and Applications. Polymers (Basel) 2021, 13 (19), 3256. 10.3390/polym13193256. [DOI] [PMC free article] [PubMed] [Google Scholar]
- Sashiwa H.; Kawasaki N.; Nakayama A.; Muraki E.; Yamamoto N.; Aiba S. Chemical modification of chitosan. 14:(1) Synthesis of water-soluble chitosan derivatives by simple acetylation. Biomacromolecules 2002, 3 (5), 1126–8. 10.1021/bm0200480. [DOI] [PubMed] [Google Scholar]
- Dar N.; Ankari R. Theoretical Models, Preparation, Characterization and Applications of Cyanine J-Aggregates: A Minireview. ChemistryOpen 2022, 11 (11), e202200103 10.1002/open.202200103. [DOI] [PMC free article] [PubMed] [Google Scholar]
- Morozova K. S.; Piatkevich K. D.; Gould T. J.; Zhang J.; Bewersdorf J.; Verkhusha V. V. Far-red fluorescent protein excitable with red lasers for flow cytometry and superresolution STED nanoscopy. Biophys. J. 2010, 99 (2), L13–5. 10.1016/j.bpj.2010.04.025. [DOI] [PMC free article] [PubMed] [Google Scholar]
- Rost F.Fluorescence microscopy, applications. In Encyclopedia of Spectroscopy and Spectrometry (Third Edition); Lindon J. C., Tranter G. E., Koppenaal D. W., Eds.; Academic Press: 2017, 627-631, 10.1016/B978-0-12-803224-4.00147-3. [DOI] [Google Scholar]
- Roshchina V. V. Vital Autofluorescence: Application to the Study of Plant Living Cells. International Journal of Spectroscopy 2012, 2012, 124672 10.1155/2012/124672. [DOI] [Google Scholar]
- Southwick P. L.; Ernst L. A.; Tauriello E. W.; Parker S. R.; Mujumdar R. B.; Mujumdar S. R.; Clever H. A.; Waggoner A. S. Cyanine dye labeling reagents--carboxymethylindocyanine succinimidyl esters. Cytometry 1990, 11 (3), 418–30. 10.1002/cyto.990110313. [DOI] [PubMed] [Google Scholar]
- Hettler S. A.; Picascia T.; Pastene D. O.; Vajpayee S.; Perciaccante R.; Yard B. A.; Gretz N.; Krämer B. K. Hyperfiltration can be detected by transcutaneous assessment of glomerular filtration rate in diabetic obese mice. Am. J. Physiol Cell Physiol 2023, 325 (6), C1558–C1566. 10.1152/ajpcell.00483.2022. [DOI] [PubMed] [Google Scholar]
- Rodriguez-Nino A.; Pastene D. O.; Hettler S. A.; Qiu J.; Albrecht T.; Vajpayee S.; Perciaccante R.; Gretz N.; Bakker S. J. L.; Kramer B. K.; Yard B. A.; van den Born J. Influence of carnosine and carnosinase-1 on diabetes-induced afferent arteriole vasodilation: implications for glomerular hemodynamics. Am. J. Physiol Renal Physiol 2022, 323 (1), F69–F80. 10.1152/ajprenal.00232.2021. [DOI] [PubMed] [Google Scholar]
- Klingberg A.; Hasenberg A.; Ludwig-Portugall I.; Medyukhina A.; Männ L.; Brenzel A.; Engel D. R.; Figge M. T.; Kurts C.; Gunzer M. Fully Automated Evaluation of Total Glomerular Number and Capillary Tuft Size in Nephritic Kidneys Using Lightsheet Microscopy. J. Am. Soc. Nephrol 2017, 28 (2), 452–459. 10.1681/ASN.2016020232. [DOI] [PMC free article] [PubMed] [Google Scholar]
- Romani A.; Casciano F.; Stevanin C.; Maietti A.; Tedeschi P.; Secchiero P.; Marchetti N.; Voltan R. Anticancer Activity of Aqueous Extracts from Asparagus officinalis L. Byproduct on Breast Cancer Cells. Molecules 2021, 26 (21), 6369. 10.3390/molecules26216369. [DOI] [PMC free article] [PubMed] [Google Scholar]
- Li B.; Zhao M.; Feng L.; Dou C.; Ding S.; Zhou G.; Lu L.; Zhang H.; Chen F.; Li X.; Li G.; Zhao S.; Jiang C.; Wang Y.; Zhao D.; Cheng Y.; Zhang F. Organic NIR-II molecule with long blood half-life for in vivo dynamic vascular imaging. Nat. Commun. 2020, 11 (1), 3102. 10.1038/s41467-020-16924-z. [DOI] [PMC free article] [PubMed] [Google Scholar]
- Lee S.; Lim W.; Jung J. S.; Jo D.; Jo G.; Park M. H.; Hyun H. Surface Charge Modification of Polyethyleneimine for Enhanced Renal Clearance and Bioimaging. Macromol. Res. 2018, 26, 1251–1256. 10.1007/s13233-019-7020-9. [DOI] [Google Scholar]
Associated Data
This section collects any data citations, data availability statements, or supplementary materials included in this article.


