


Abstract
Sequencing of the complete genome of Mycobacterium tuberculosis, combined with the rapidly increasing need to improve tuberculosis management through better drugs and vaccines, has initiated extensive research on several key proteins from the pathogen. RecA, a ubiquitous multifunctional protein, is a key component of the processes of homologous genetic recombination and DNA repair. Structural knowledge of MtRecA is imperative for a full understanding of both these activities and any ensuing application. The crystal structure of MtRecA, presented here, has six molecules in the unit cell forming a 61 helical filament with a deep groove capable of binding DNA. The observed weakening in the higher order aggregation of filaments into bundles may have implications for recombination in mycobacteria. The structure of the complex reveals the atomic interactions of ADP–AlF4, an ATP analogue, with the P-loop-containing binding pocket. The structures explain reduced levels of interactions of MtRecA with ATP, despite sharing the same fold, topology and high sequence similarity with EcRecA. The formation of a helical filament with a deep groove appears to be an inherent property of MtRecA. The histidine in loop L1 appears to be positioned appropriately for DNA interaction.
INTRODUCTION
Mycobacterium tuberculosis, the causative agent of tuberculosis, continues to claim more lives than any other single infectious disease, despite the availability of effective chemotherapeutic drugs and the Bacille Calmette Guerin vaccine, primarily due to the emergence of multidrug-resistant strains and a fatal synergy with AIDS (1). In recent years homologous genetic recombination has been used to construct attenuated mutants of M.tuberculosis that may facilitate the development of an improved or robust vaccine (2,3).
In vivo Escherichia coli RecA protein plays an important role in the processes of recombinational repair, homologous genetic recombination and induction of the SOS response. RecA is a ubiquitous protein with structural and functional homologues present in all organisms ranging from bacteria to humans (4). All activities of RecA protein require the formation of an active helical nucleoprotein filament resulting from binding of both Mg2+-ATP and single-stranded (ss)DNA (5,6). The crystal structure of RecA protein from Escherichia coli identified the nucleotide-binding site (7) and showed the formation of a helical filament. The stability and structure of the helical nucleoprotein filament of RecA is influenced by binding and hydrolysis of nucleotide cofactors (4).
RecA protein from M.tuberculosis is especially interesting since both ATP binding and hydrolysis catalysed by it are considerably less efficient than those by the prototype EcRecA, although it is capable of binding ssDNA and is proficient in homologous pairing and strand exchange (2,8). recA– mutant strains of E.coli fail to survive DNA damage inflicted by both physical and chemical mutagens, indicating that RecA protein is crucial for cell survival (4). Furthermore, MtRecA originates from an inactive precursor that undergoes splicing to generate the active form of RecA protein, a phenomenon unique to pathogenic mycobacteria (9). Here we report the crystal structures of uncomplexed MtRecA and its complex with ADP–AlF4, an ATP analogue.
MATERIALS AND METHODS
Crystallisation and data collection
MtRecA was purified as described (8). Crystals of MtRecA were grown from a hanging drop of 10 mg/ml protein in 100 mM phosphate–citrate buffer, pH 7.0, containing 100 mM NaCl and 6% PEG 4000 equilibrated against 20% PEG 4000 in the same buffer. The crystals grew to a maximum size of 0.3 × 0.2 × 0.2 mm in 2–3 weeks in space group P61 with unit cell dimensions a = b = 108.1 Å, c = 72.8 Å, with one molecule per asymmetric unit. Crystals of the ADP–AlF4 complex were prepared by soaking native crystals in phosphate–citrate buffer containing 2 mM ADP, 10 mM MgCl2, 10 mM NaF and 50 mM Al(NO3)2, pH 5.6, for 7 days. AlF4 was prepared using a method as described (10). In spite of repeated attempts it has not been possible so far to produce good quality crystals of the ADP complex. X-ray diffraction data from apo-MtRecA as well as complex crystals were collected at room temperature using a 30 cm MAR imaging plate mounted on a Rigaku RU200 X-ray generator. Apo-MtRecA and the complex crystals diffracted up to 3 and 3.8 Å, respectively. The data sets were processed using DENZO and SCALEPACK (11). Data collection statistics are given in Table 1.
Table 1. Data collection and refinement statistics.
| Apoprotein | Complex | |
|---|---|---|
| Space group | P61 | P61 |
| Unit cell dimensions | a = 108.1 Å, c = 72.8 Å | a = 107.9 Å, c = 72.0 Å |
| Resolution | 3.0 Å | 3.8 Å |
| Rmerge (%) | 10.7 | 14.5 |
| Total number of unique reflections | 9654 | 4738 |
| Completeness | ||
| Overall | 98.4% | 97.8% |
| Last shell | (3.1–3.0 Å) 98.0% | (3.94–3.80 Å) 99.6% |
| Penultimate shell | (3.23–3.10 Å) 97.8% | (4.09–3.94Å) 98.9% |
| I/sig(I) | ||
| Overall | 17.2 | 14.4 |
| Last shell | 4.9 | 3.4 |
| Penultimate shell | 6.2 | 3.5 |
| No. of protein atoms | 2276 | 2204 |
| No. of ligand atoms | 5 | 32 |
| No. of solvent atoms | 65 | – |
| Rfactor | 21.8% | 22.0% |
| Rfree | 27.0% | 28.0% |
| Average B factor (Å2) | ||
| Main chain | 20.2 | 26.3 |
| Side chain | 30.2 | 29.8 |
| RMS deviation from identity | ||
| Bond lengths (Å) | 0.017 | 0.012 |
| Bond angles (°) | 2.29 | 1.77 |
| Dihedrals (°) | 24.0 | 24.8 |
| Impropers (°) | 2.8 | 3.4 |
Structure determination and refinement
Structure solution was achieved by molecular replacement using AMoRe (12). The search model was constructed from EcRecA (2REB) (13,14) by replacing non-identical residues with alanines and leaving the identical residues unchanged. A unique solution was obtained with this search model, giving an R factor of 38% and a correlation factor of 68%. All manual rebuilding was carried out using FRODO (15). Structure refinement was carried out using XPLOR (16), which involved iterations of rigid body refinement, positional refinement, simulated annealing and torsion angle dynamics followed by grouped B factor refinement. To remove the phase bias during refinement, a systematic omit map was computed wherein the asymmetric unit was divided into eight portions, each portion having approximately the same number of atoms and one portion was omitted at a time. The resulting eight maps computed after brief positional refinements were combined to obtain a map of the complete asymmetric unit. The omit map constructed in this manner has the advantage that it provides an image of the entire structure which is formally independent of the input model (17). At a later stage of refinement this omit map, along with 2Fo – Fc and Fo – Fc maps, were calculated for model building into the electron density. The electron density maps, except in the L2 loop region (residues 195–210) and for the 23 residues at the C-terminus of both apo-MtRecA and its complex with the ATP analogue, were good, despite the modest resolution limits (3.0 and 3.8 Å, respectively) to which the crystals diffracted. The C-terminal 23 residues and loop L2 were also found to be disordered in the EcRecA structure, in addition to loop L1 (residues 156–165). The quality of fitting of the model into the electron density was verified with the real space R factor values (18) throughout refinement. Final structure validation was carried out using PROCHECK (19) and WHAT_IF (20).
The structure of the complex was solved by the difference Fourier method. A Fo – Fc difference map with Fo values of the protein complex and Fc values corresponding to the protein atoms of the apoprotein structure permitted an initial unambiguous positioning of the ADP molecule, with some extended density appropriate in size and position for an AlF4 moiety. Subsequent refinement improved the quality of the map substantially, allowing fitting of the AlF4 moiety. Particular care was taken to ensure reliability of the precise positioning of the AlF4 group, in view of the limited resolution of the data. Density corresponding to the AlF4 group appeared above the 3σ level in the difference Fourier maps, calculated at different stages, as well as in the systematic omit map. The density was always contiguous to that for ADP and this led to a unique positioning of the group compatible with geometrical constraints and the electron density. There was density near the nucleotide, appropriate for positioning Mg2+. However, the resolution of the data did not allow a precise location of either the magnesium atom or any water molecules. AlF4 was presumed to have square planar geometry (21,22). The geometric parameters of AlF4 used in the refinement were obtained from the HICCUP database (23). The refined coordinates and structure factors have been deposited in the Protein Data Bank (14). The ID codes are 1G19 for the free protein and 1G18 for the complex.
Since only Cα coordinates were available for the EcRecA–ADP complex, all other protein atoms were generated using the apo-EcRecA crystal structure when constructing the models of EcRecA complexes. The resulting models of the ATP and ADP complexes were energy minimised with a 5 Å shell of water molecules around it. All energy minimisations were carried out using DISCOVER interfaced with INSIGHTII (24), with a moderate tethering force of 200 kcal/mol to maintain the overall position of the nucleotide. Meaningful comparison of protein–ligand interaction energies between two structures demands that the two structures are subjected to similar optimisation protocols. Therefore, the MtRecA–ADP and MtRecA–ATP models based on the crystal structure of the MtRecA–ADP–AlF4 complex were also soaked in a 5 Å layer of water molecules and minimised using an identical protocol (steepest descent minimisation followed by conjugate gradient minimisation with a gradual introduction of cross-terms or morse potential terms). Interaction energies were computed with the same dielectric and non-bonded cut-off parameters and included both van der Waal’s and electrostatic contributions. Shape complementarity coefficients were computed using the Lawrence and Colman method (25) where a coefficient of 1 on a scale of 0–1 indicates ideal compatibility between two surfaces. Surface areas were computed using the Connolly algorithm as implemented in INSIGHTII (24). The difference between the sum of surface areas of the protein and the ligand individually and the surface area of the corresponding complex was considered as the buried surface area upon ligand binding.
RESULTS AND DISCUSSION
Overall features
The overall structure of MtRecA is very similar to that of EcRecA, consistent with the high sequence identity of 62% over the entire 352 amino acid polypeptide chain (Fig. 1A and B). The structure consists of three distinct domains: a 30 residue N-terminal domain (N) (residues 1–30; residue numbers correspond to the EcRecA sequence throughout the text to avoid confusion so that for any residue n in the EcRecA sequence, n + 1 will give the corresponding number in the MtRecA sequence and structure) consisting of a long α-helix followed by an extended region; the major central domain (M) (residues 31–269), involving the P-loop containing the nucleotide triphosphate hydrolase fold (26), which is made up of an 8-stranded twisted β-sheet flanked by α-helices; a 59 residue C-terminal domain (C) (residues 270–328), consisting of three helices and three β-strands which protrude away from the M domain. Two loops implicated in DNA binding (4), L1 and L2, comprising residues 156–165 and 195–210, respectively, are situated in the M domain.
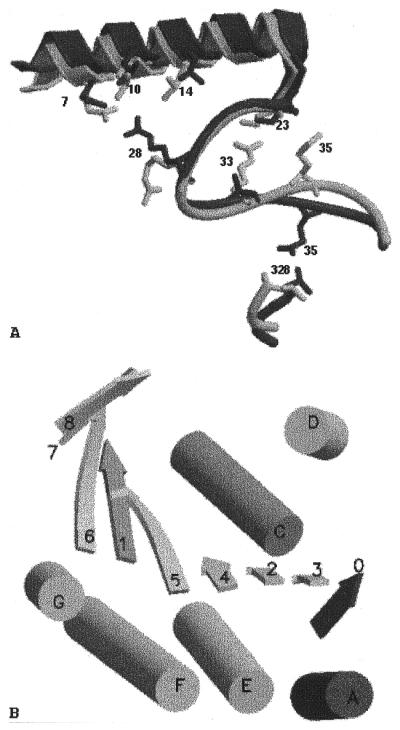
Figure 1.

Overall structure of MtRecA and its comparison with EcRecA. (A) A schematic representation using MOLSCRIPT (53) and Raster3D (54) of the crystal structure of MtRecA. N, M and C shown in green, red and blue, respectively, refer to the three domains. Phosphate groups are shown in ball and stick representation. α-Helices are represented by cylinders. β-Strands are represented by arrows and shown in a lighter shade in each domain as compared to the α-helices. (B) Pairwise sequence alignment (55,56) of EcRecA and MtRecA. The figure was prepared using BOXSHADE (57), showing identical regions highlighted on a red background, while regions with conservative substitutions are highlighted in yellow. Schematic depiction of secondary structural elements (showing spirals for helices and arrows for β-strands) were incorporated into the alignment. (C) Deviations in Cα positions of the MtRecA structure upon superposition on the EcRecA structure. This plot was prepared using GNUPLOT (58).
Superposition of all Cα atoms of the MtRecA and EcRecA structures (Fig. 1C) gave a root mean square (RMS) deviation of 1.1 Å, whereas superposition of the domains individually gave RMS deviations of 0.6, 0.9 and 1.0 Å for the N, M and C domains, respectively, suggesting that the orientation of the three domains with respect to one another differed in the two structures. The angles subtended by the centroids of the domains at the links in MtRecA were 99.4° and 140° for the NM and MC domains, respectively, as compared to 102° and 138.7° in the EcRecA structure. The minor change in the mutual orientation of the N and M domains is caused by additional hydrogen bonds between them as well as changes in the nature or conformation of the side chains. More specifically, residue 33, an arginine in EcRecA, has its side chain pointing towards the side chain of Lys23 NZ, necessitating a minimal distance between the two, on account of repulsion between the two positive charges and steric hindrance between the side chains. The replacement of Arg33 by Ala in MtRecA allows the two to come closer together, by removing electrostatic repulsion and steric hindrance in the interface (Fig. 2A). This in turn permits the formation of a hydrogen bond between Leu29 O and Lys256 NZ as well as between Gly30 O and Glu32 N. Furthermore, Leu14 in EcRecA is replaced by Val in MtRecA. The smaller side chain of the latter permits the side chain of Arg28 NH2 to move into a position appropriate for formation of a hydrogen bond with the side chain of Glu7 OE1 (Fig. 2A). The orientation between the M and C domains has changed to a smaller extent, which can be explained in terms of changes in sequence such as Met35→Gln, Lys324→Arg and Ser273→Glu, leading to loss of hydrogen bonds Arg324 NH2ºAsp48 OD2 and Ser46 NºGlu273 OE2 and formation of the hydrogen bond Gln35 NE2ºLeu328 O.
Figure 2.
Domain and filament interfaces in MtRecA. (A) Superposition of EcRecA (grey) on MtRecA (black) using all Cα atoms. Only those segments that contribute to the small rearrangements in domain orientation are shown. Some side chains directly involved in interface interactions are shown in stick representation and labelled. The large shift in residue 35 (Met35→Gln) is particularly noteworthy. (B) Addition to the α/β/α layer upon filament formation leading to generation of a hybrid supersecondary structural element. α-Helices and β-strands are denoted by cylinders and arrows, respectively, and labelled according to their occurrence in the sequence. One molecule is shown in grey and the other in black. This figure was prepared using MOLSCRIPT and Raster3D.
A significant shift is observed in the peptide segment 33–38 in MtRecA from its position in EcRecA. The sequence of this segment in MtRecA is entirely different from that in EcRecA and that probably accounts for the observed shift. This segment is situated spatially in such a way as to directly influence the orientation of both the N and C domains and, when positioned as in MtRecA, contributes to orienting the C domain slightly away from the M domain. This segment in EcRecA participates directly in bundle formation (see below). A shift in the position of Gln35 in MtRecA from the position of Met35 in EcRecA, illustrated in Figure 2A, leads to a structural change resembling a single amino acid insertion, shifting the alignment frame by one residue. This shift is subsequently compensated by a gradual shift in residues 37–39 so that residues 39 in the two structures again overlap well (EcRecA 1–33, 35–38, 39–328 ≡ MtRecA 1–33, 34–37, 39–328).
The active form of MtRecA (38 kDa) is generated after removal of an intein region by splicing of a RecA precursor protein (85 kDa). Active MtRecA, comprising 352 amino acid residues, is homologous to RecA protein from other organisms over its entire length. The splice site, residues 253 and 254, lies in a loop in the M domain, superposing well with the corresponding region in EcRecA. The sequence in regions immediately before and after the splice site seems well conserved, except for the presence of a characteristic Cys251 (27) in MtRecA. This residue, however, does not interact with any other residue in the crystal structure of MtRecA.
Filaments and bundles
Molecules of MtRecA in the crystal structure pack around the 61 axis to form a filament, with a pitch of 72.7 Å, corresponding to the c cell dimension. This is substantially shorter than the pitch of 82.7 Å observed in EcRecA crystals. However, since both EcRecA and MtRecA have been shown to form filamentous structures despite considerable differences in crystallisation conditions, formation of filaments of this type appears to be an inherent property of RecA-like proteins. The residues involved in filament formation are in the N-terminal domain as well as in the 114–135 stretch of the M domain. The subunit interface is extensive, involving ∼20 hydrogen bonds. These hydrogen bonds contribute substantially to stabilisation of the filament. Most strikingly, the N-terminal helix (residues 3–24) of one molecule is in contact with the 122–135 helix of the adjacent molecule in the filament, as are the extended segments 25–28 of the first molecule and 114–118 of the second molecule. As illustrated in Figure 2B, such a juxtaposition leads to a supersecondary structural feature spanning adjacent molecules in the filament. Residues 25–28, although not part of any β-sheet in the single molecule, has backbone dihedrals (Φ/Ψ) typical of a β-strand and also makes a hydrogen bond with strand 114–118 of the second molecule upon filament formation. This interface therefore involves formation of a hybrid β-sheet (Fig. 2B). This phenomenon has been observed previously in several other protein structures and has been recognised to be important in oligomer stabilisation (28). It is interesting that all the residues which are involved in intra-polymer hydrogen bonds in EcRecA, such as Glu97, His98, Glu155, Lys214, Lys217, Tyr219, Asn250 and Lys251, are the same in MtRecA, making equivalent interactions and, in fact, forming a significant part of the totally conserved residues in ∼60 bacterial RecA protein sequences (29).
Electron microscopic data showed that EcRecA molecules form different types of filaments under different conditions (6). The filament formed in the presence of ssDNA and a nucleotide cofactor has a pitch of ∼95 Å and is known to be the active filament (5,6). Filaments formed in the absence of one or both substrates, considered to be inactive, varied in pitch in the range 72–82 Å. The crystal structure reported here, as well as that of EcRecA (13), clearly shows a pitch matching that of inactive filaments. Therefore, the protein part of the active filament was modelled by generating symmetry-related molecules from a given single molecule, assuming a hypothetical cell with a and b cell dimensions similar to those of the MtRecA crystals, but with a c cell dimension of 95 Å (mt95). The same procedure was repeated for EcRecA (ec95). The resulting filaments ec95 and mt95 are indeed very similar to each other (Fig. 3). Interactions between the subunits, although reduced by a few hydrogen bonds in both ec95 and mt95, retain the same overall features, such as generation of the continuous supersecondary structure and a salt bridge between residues 6 and 139, suggesting that the modelled filaments are structurally feasible. Biochemical as well as electron microscopic studies have indicated that the active and inactive filaments are not interconvertible and must disassemble to reassemble in the presence of ssDNA and a nucleotide cofactor (6,30,31). However, the modelling experiment suggests that RecA is capable of aggregating into an active filament without any major change within the individual molecules. The buried surface area, shape complementarity and total number of hydrogen bonds formed upon filament formation in the two crystal structures and in the models are given in Table 2. They have comparable values in EcRecA and MtRecA filaments. The values are lower in both ec95 and mt95. Perhaps, interactions with ssDNA will compensate for this reduction in modelled active filaments and stabilise them in the active conformation.
Figure 3.

Filament formation by RecA protein. Surface representations of filaments of (A) MtRecA, (B) EcRecA, (C) mt95 and (D) ec95, using GRASP (59). They are colour coded using atomic charges, red indicating a negative charge and blue a positive charge. (E) and (F) depict the filaments in (A) and (B), respectively, viewed down the z-axis. The central groove in the filament where DNA is expected to bind can be clearly seen.
Table 2. Inter-molecular interactions in MtRecA filaments and bundles.
| Surface area buried (Å2) | Shape complementarity | Number of hydrogen bonds | |
|---|---|---|---|
| Filament | |||
| EcRecA | 1507 (1110) | 0.65 | 18 |
| MtRecA | 1614 (1214) | 0.66 | 12 |
| EcRecA95 | 1108 (749) | 0.51 | 15 |
| MtRecA95 | 1080 (654) | 0.35 | 11 |
| Bundles | |||
| EcRecA | 281 (155) | 0.71 | 10 |
| MtRecA | 131 (87) | 0.55 | 1 |
The hydrophobic component of the surface area buried is given in parentheses.
The filaments thus formed further associate into bundles in the crystal structure, which are similar to those that occur naturally, as shown by EM studies (5). It has been suggested (13) that RecA molecules are normally stored in the form of bundles and upon induction of the SOS response dissociate from the bundles and subsequently form fresh active nucleoprotein filaments that take part in recombinational repair. In MtRecA, however, the bundles appear much weaker than in EcRecA, as indicated by a reduction in the number of hydrogen bonds, shape complementarity and interacting surface area (Fig. 4 and Table 2). Residues involved in bundle formation are 16–19 and 23 in the N-terminal domain, the 32–38 loop and 295–297 and 308–314 in the C-terminal domain. Unlike the interface of two molecules involved in filament formation, several residues on the bundle interface have different side chains in EcRecA and MtRecA. Sequence comparison of MtRecA with EcRecA shows the introduction of at least four negatively charged residues in MtRecA. These four residues are distributed on or in the proximity of the surface of the C-terminal domain. When the molecules aggregate into filaments these charges cluster on one side of the filament, creating an essentially negatively charged patch (Fig. 3) which can significantly reduce its interaction with neighbouring filaments, thus reducing the stability of MtRecA bundles.
Figure 4.

Higher order association of filaments into bundles. (A) Two filaments of MtRecA are shown side by side, with each molecule in a filament in a different colour. This figure was prepared using INSIGHTII (24). The interface between the filaments involved in bundle formation is boxed and is shown in detail in (B). The corresponding interface in EcRecA is also shown for comparison in (C). In both (B) and (C) the interacting molecule of the first filament is shown in green and that of the second in yellow. Hydrogen bonds are indicated by broken lines. This figure was prepared using MOLSCRIPT and Raster3D.
Nucleotide binding and hydrolysis
The crystal structure of MtRecA complexed with ADP and AlF4 revealed that each molecule of MtRecA binds one molecule of the ATP analogue in the P-loop region, as in the structure of the EcRecA–ADP complex (7). AlF4 has been used before to mimic the γ-phosphate group of a nucleotide triphosphate in protein crystals (32). The difference electron density map between the complex and the apo-MtRecA structures (Fig. 5A) permitted unambiguous positioning of the nucleotide molecule. The position of the nucleotide base differs slightly from that in the EcRecA–ADP complex, as does the conformation of ADP. However, the anti conformation of the adenine base with respect to the sugar is maintained. A change in the torsion angle involving c4′, c5′, o5′ and p1 (33) results in a shift of the β-phosphate by ∼1 Å from its position in the EcRecA–ADP complex. The nucleotide-binding site can be roughly divided into three regions comprising the phosphate-binding region (P), residues interacting with the base (B) and residues involved in sugar binding (S) (8). The P region consists of residues corresponding to the Walker A motif (66–72) (34) and the Walker B motif (144), as well as two other residues (96 and 194) which are implicated in catalysis. The B region is made up of residues 100–103 and the S region consists of loop 262–265 and residues 227 and 240. (Fig. 5 and Table 3). Residues in the P, B and S regions are substantially conserved in all known RecA proteins. In spite of that, the P-loop region has deviated significantly in MtRecA from its position in EcRecA, with a maximum deviation of nearly 2.0 Å in the Cα positions. These deviations result in widening of the nucleotide-binding pocket and thereby lead to a reduction in the binding affinity for the nucleotide cofactor.
Figure 5.

Protein–nucleotide interactions in the MtRecA–ADP–AlF4 complex. (A) Difference (Fo – Fc) electron density map contoured at 2.5σ, shown in red, into which ADP–AlF4 has been fitted and refined. Tyr103, which makes stacking interactions with the adenine base can also be seen. This figure was prepared using BOBSCRIPT (60) and Raster3D. (B) Movement of the P-loop in MtRecA (orange), indicating widening of the binding pocket. The P-loop in EcRecA (green) is shown for comparison. ADP–AlF4 in MtRecA is shown in ball and stick representation. (C) Surface representation of the nucleotide-binding pocket in MtRecA, using GRASP. The nucleotide molecule in it is shown in ball and stick representation. (D) The P (orange), B (purple) and S (blue) regions of the nucleotide-binding pocket showing side chains hydrogen bonding with ADP–AlF4. (E) Schematic diagram showing interactions of ADP–AlF4 with MtRecA. (C)–(E) were prepared using MOLSCRIPT and Raster3D.
Table 3. Hydrogen bonds between MtRecA and ADP–AlF4.
| Ligand atom | Protein atom | Distance (Å) |
|---|---|---|
| F1 | 68 Glu N | 3.4 |
| F1 | 69 Ser N | 2.3 |
| F3 | 69 Ser N | 2.6 |
| F3 | 69 Ser OG1 | 3.1 |
| F4 | 72 Lys NZ | 3.2 |
| F4 | 194 Gln NE2 | 2.7 |
| N9 | 103 Tyr OH | 3.4 |
| N6 | 100 Asp OD2 | 3.4 |
| N3 | 265 Gly N | 2.9 |
| O11 | 74 Thr N | 2.6 |
| O11 | 74 Thr OG1 | 2.9 |
| O21 | 72 Lys N | 3.4 |
| O21 | 73 Thr N | 2.3 |
| O21 | 73 Thr OG1 | 3.5 |
| O22 | 71 Gly N | 2.5 |
| O22 | 72 Lys N | 2.7 |
| O7 | 70 Ser N | 3.5 |
| O4′ | 103 Tyr OH | 3.5 |
In order to compare the two structures, energy minimised models of both the EcRecA and MtRecA complexes with ADP and ATP were constructed, using the corresponding crystal structures, as described in Materials and Methods. Surface areas buried upon ligand binding (35), shape complementarity between the protein and the ligand (25) and interaction energies in the structures are given in Table 4. It is clear from both the interaction energies as well as the shape complementarity values that EcRecA can bind both ADP and ATP with much higher affinity than MtRecA. This is entirely consistent with the biochemical data reported earlier (8). The buried non-polar surface areas also show the same trend, although the differences in the values of this parameter between the two structures are rather small.
Table 4. ADP and ATP interactions in EcRecA and MtRecA models.
| Buried surface area (Å2) (non-polar buried surface area) | Shape complementarity | Interaction energy (kcal/mol) | |
|---|---|---|---|
| EcRecA + ADP | 357 (180) | 0.81 | –90 |
| MtRecA + ADP | 330 (159) | 0.71 | –33 |
| EcRecA + ATP | 420 (206) | 0.82 | –114 |
| MtRecA + ATP | 429 (189) | 0.69 | –61 |
Previously we had reported a homology model of MtRecA (8) based on the crystal structure of EcRecA (13). It is gratifying that the differences between EcRecA and MtRecA indicated by the model are generally consistent with the MtRecA crystal structure. Of particular interest is the movement in the P-loop region, resulting in widening of the nucleotide cleft. The crystal structure confirms that the residues in the P-loop have rearranged themselves in MtRecA. Residues 67–69, although not part of the consensus of the Walker A motif, make substantial contacts with the α- and β-phosphates as well as with AlF4. Residues in this region have been subjected to extensive mutagenesis studies (36). The Glu68 OE1 and Ser69 OG side chains are hydrogen bonded to each other in EcRecA but have moved away in MtRecA, although the sequence in the entire region is conserved. This interaction, seen in EcRecA, appears to be important in maintaining the particular conformation of the P-loop, which is consistent with the observation that even conservative substitutions at residue 68 result in a reduction in binding affinity (36). Our earlier modelling studies in fact predicted that in the widened P-loop this interaction would not be possible. Tyr264, located on another loop close to the ribose of the nucleotide, has been shown by mutagenesis and cross-linking studies to be important for nucleotide binding (37). However, in the MtRecA structure this residue is too far from the nucleotide to make any hydrogen bond.
Incidentally, a phosphate group is observed in the apo-MtRecA structure. Interestingly, the position of this phosphate group coincides with the β-phosphate in the EcRecA–ADP structure, although it is closer to the AlF4 group in the MtRecA–ADP–AlF4 structure. On superposition the AlF4 group is closer to the β-phosphate of the EcRecA–ATP model than to the γ-phosphate. Based on the homology to other P-loop-containing NTP-binding proteins, such as Ras-p21 (38), eF-Tu (39) and rac1 (40), the γ-phosphate of ATP was expected to be in contact with Gln194 and also in close proximity to Gln96 and Asp144 (7). The model of the EcRecA–ATP complex indeed shows that the terminal phosphate group hydrogen bonds to the side chain of Gln194 NE2. In MtRecA one of the fluorines of AlF4 also hydrogen bonds to the same side chain. However, if the square planar AlF4 group is replaced by a tetrahedral phosphate group, the phosphate oxygen will not be able to make a good hydrogen bond with Gln194. ATP hydrolysis has been shown to be reduced to more than half in MtRecA compared to that in EcRecA (8). The fact that binding itself is weakened in MtRecA, combined with the sub-optimal arrangement of residues in the binding pocket, accounts for this inefficient ATP hydrolysis. Loops L1 and L2 are thought to undergo a conformational change upon binding of ATP or its analogues (7). However, the orientation of loop L1 in MtRecA–ADP–AlF4 appears to be similar to that in the apo-MtRecA structure. Since there is no density for loop L2 in either structure, it is not possible to draw any inference about the nature of conformational changes in L2. Nonetheless, the structure of the MtRecA complex shows some changes in the post-L2 stretch (residues 211–215), as compared to the apo-MtRecA structure.
DNA binding, homologous recombination and DNA repair
Upon filament formation the molecules position themselves in such a way that the two surface loops L1 and L2 in all of them lie close to the axis of the helical filament. Several mutagenesis studies (41,42) and the sheer geometry of the filament indicated that these loop regions are involved in DNA binding. Electron density for most of the first loop was clearly seen in both apo-MtRecA and MtRecA–ADP–AlF4 crystals. His163, a well-conserved residue, which is the only basic residue in the loop, has its side chain oriented into the central groove such that it can interact with the phosphates of DNA. In EcRecA both the loops were totally disordered and could not be seen. The longer loop is also not seen clearly in the MtRecA structure. The structure of the nucleic acid-binding domain of bacteriophage T7 DNA helicase resembles that of the M domain of RecA protein (43) (176 Cα atoms superimposed with a RMS deviation of 2.4 Å; 44). The helicase also has two loops corresponding to L1 and L2 of RecA. These loops are similarly positioned in the helicase domain and are implicated in DNA binding (43,45). The loops here too are disordered. Although there is no direct structural evidence for L1/L2–DNA interactions, mutational studies, the conserved nature of the fold, positioning of the loops and conformational changes upon ATP/GTP binding all suggest that the loops play a crucial role in binding DNA.
The study of DNA repair systems, of which RecA is a crucial component, has been of great interest in recent years and is likely to be particularly important in mycobacteria (46). Although structures of some of the proteins involved in one or other pathways of DNA repair have been characterised (47,48), such information in mycobacteria is still very scant. Also, in bacteria the biological role of homologous genetic recombination is predominantly DNA repair under normal growth conditions. It has been shown by various biochemical studies that the RecA filament binds to LexA protein, where it functions as a co-protease to cleave LexA, which in turn derepresses the recA gene (49). Site-directed mutagenesis studies on EcRecA have shown that residues 229 and 243 (50) are involved in repressor binding and this is supported by the E.coli RecA crystal structure (13). Residues 227–241 form a long surface loop. A portion of this loop was reported to be in an area of weak electron density in the EcRecA structure. In MtRecA, however, the loop lies in an area of well-defined electron density, deviating by ∼5 Å (maximum Cα deviation) from its position in the EcRecA structure. There are several changes in this loop, including a charge reversal as compared to EcRecA at position 241 (Glu→Arg) and a change of Glu235 to Thr235. The implications of these changes are not clear at present, although the orientation of several hydrogen bonding groups on the surface of MtRecA appear to be more conducive to repressor binding.
CONCLUSIONS
The crystal structure of MtRecA confirms that the protein in the crystals polymerises into a filament, closely resembling that observed by electron microscopy for EcRecA. Given its need to bind long stretches of both single-stranded and double-stranded DNA, filament formation resulting in a deep groove capable of binding DNA appears to be essential for its function. It is indeed fortunate that the protein crystallises in space group P61, compatible with the natural polymerisation mode. The structure of this aggregated state, therefore, is far more informative than that of the individual molecule. The filamentous structure of RecA further aggregates into bundles, mainly as a form for storage and as a mechanism to keep RecA inactive when not needed, which may have implications for the efficiency of recombination and random integration. It is also known that, unlike in yeast and many bacteria, mycobacteria promote a higher degree of illegitimate recombination (51,52). Modelling studies indicate the possibility of formation of active filaments without any substantial change in molecular conformation. The crystal structure of MtRecA complexed to ADP–AlF4 reveals a widening of the P-loop binding pocket resulting in weaker binding. The structure, coupled with modelling studies, shows how the protein can adapt itself to result in weaker nucleotide binding and sub-optimal hydrolysis, despite all the residues in the binding site being invariant. This is achieved through variations in tertiary interactions of the binding site residues with their neighbourhoods. It is possible that such sub-optimal levels of binding and enzyme activity are a general feature in mycobacteria and may have some advantage for its survival in macrophages. The crystal structure of MtRecA reported here allows its exploitation as a drug target, especially because it has a central role in several processes crucial for bacterial survival. Finally, the crystal structure throws additional light on the biology of recombination in mycobacteria, which is crucial to design attenuated strains of the tubercle bacilli, required to produce an improved or robust vaccine.
Acknowledgments
ACKNOWLEDGEMENTS
The diffraction data were collected on an imaging plate detector at the X-ray Facility for Structural Biology supported by the Department of Science and Technology (DST) and the Department of Biotechnology (DBT). Use of facilities at the Super Computer Education and Research Centre, the Interactive Graphics Based Molecular Modelling Facility and the Distributed Information Centre (both supported by the DBT) are acknowledged. Financial assistance from the DST to M.V. and from the Wellcome Trust, UK, to K.M. is acknowledged. S.D. is a CSIR junior fellow.
PDB accession nos 1G18, 1G19
REFERENCES
- 1.Snider D.E. Jr, Raviglione,M. and Kochi,A. (1994) In Bloom,B.R. (ed.), Tuberculosis: Pathogenesis, Protection and Control. American Society for Microbiology, Washington, DC, pp. 2–11.
- 2.Vaze M.B. and Muniyappa,K. (1999) RecA protein of Mycobacterium tuberculosis possesses pH-dependent homologous DNA pairing and strand exchange activities: implications for allele exchange in mycobacteria. Biochemistry, 38, 3175–3186. [DOI] [PubMed] [Google Scholar]
- 3.Young D.B. and Cole,S.T. (1993) Leprosy, tuberculosis and the new genetics. J. Bacteriol., 175, 1–6. [DOI] [PMC free article] [PubMed] [Google Scholar]
- 4.Roca A.I. and Cox,M.M. (1997) RecA protein: structure, function and role in recombinational DNA repair. Prog. Nucleic Acid Res. Mol. Biol., 56, 129–223. [DOI] [PubMed] [Google Scholar]
- 5.Flory J., Tsang,S.S. and Muniyappa,K. (1994) Isolation and visualization of active presynaptic filaments of RecA protein and single stranded DNA. Proc. Natl Acad. Sci. USA, 81, 7026–7030. [DOI] [PMC free article] [PubMed] [Google Scholar]
- 6.Egelman E.H. (1993) What do X-ray crystallographic and electron microscopic structural studies of the RecA protein tell us about recombinations. Curr. Opin. Struct. Biol., 3, 189–197. [Google Scholar]
- 7.Story R.M. and Steitz,T.A. (1992) Structure of the RecA protein-ADP complex. Nature, 355, 374–376. [DOI] [PubMed] [Google Scholar]
- 8.Kumar R.A., Vaze,M.B., Chandra,N.R., Vijayan,M. and Muniyappa,K. (1996) Functional characterization of the precursor and spliced forms of the RecA protein of M. tuberculosis. Biochemistry, 35, 1793–1802. [DOI] [PubMed] [Google Scholar]
- 9.Davis E.O., Sedgwick,S.G. and Colston,J.M. (1991) Novel structure of recA locus of M. tuberculosis implies processing of the gene product. J. Bacteriol., 173, 5653–5662. [DOI] [PMC free article] [PubMed] [Google Scholar]
- 10.Fisher A.J., Smith,C.A., Thoden,J.B., Smith,R., Sutoh,K., Holden,H.M. and Rayment,I. (1995) X-ray structure of the myosin motor domain of Dictystelium discoideum complexed with Mg.ADP.BeFx and Mg.ADP–AlF4–. Biochemistry, 34, 8960–8972. [DOI] [PubMed] [Google Scholar]
- 11.Otwinowski Z. and Minor,W. (1997) Processing of X-ray diffraction data collected in oscillation mode. Methods Enzymol., 276, 307–326. [DOI] [PubMed] [Google Scholar]
- 12.Navaza J. (1994) AMoRe: an automated package for molecular replacement. Acta Crystallogr., 50A, 157–163. [Google Scholar]
- 13.Story R.M., Weber,I.T. and Steitz,T.A. (1992) The structure of the E.coli RecA protein monomer and polymer. Nature, 355, 318–325. [DOI] [PubMed] [Google Scholar]
- 14.Berman H.M., Westbrook,J., Feng,Z., Gilliland,G., Bhat,T.N., Weissig,H., Shindyalov,I.N. and Bourne,P.E. (2000) The Protein Data Bank. Nucleic Acids Res., 28, 235–242. [DOI] [PMC free article] [PubMed] [Google Scholar]
- 15.Jones T.A. (1978) A graphic model building and refinement system for macromolecules. J. Appl. Crystallogr., 11, 268–272. [Google Scholar]
- 16.Brünger A.T. (1988) X-PLOR Manual. Howard Hughes Medical Institute and Department of Molecular Biophysics and Biochemistry, Yale University, New Haven, CT.
- 17.Vijayan M. (1980) Phase evaluation and some aspects of the Fourier refinement of macromolecules. In Diamond,R., Ramaseshan,S. and Venkateshan,K. (eds), Computing in Crystallography. Indian Academy of Science, Bangalore, pp. 19.01–19.26.
- 18.Brunger A.T., Adams,P.D., Clore,G.M., DeLano,W.L., Gros,P., Grosse-Kunstleve,R.W., Jiang,J.S., Kuszewski,J., Nilges,M., Pannu,N.S., Read,R.J., Rice,L.M., Simonson,T. and Warren,G.L. (1998) Crystallographic and NMR system (CNS): a new software for macromolecular structure determination. Acta Crystallogr., 54D, 905–921. [DOI] [PubMed] [Google Scholar]
- 19.Laskowski R.A., MacArthur,M.W., Moss,D.S. and Thronton,J.M. (1993) PROCHECK: a program to check the streochemical quality of protein structures. J. Appl. Crystallogr., 26, 283–291. [Google Scholar]
- 20.Hooft R.W.W., Vriend,G., Sander,C. and Abola,E.E. (1996) Errors in protein structures. Nature, 381, 272. [DOI] [PubMed] [Google Scholar]
- 21.Petsko G.A. (2000) Chemistry and biology. Proc. Natl Acad. Sci. USA, 97, 538–540. [DOI] [PMC free article] [PubMed] [Google Scholar]
- 22.Chabre M. (1990) Aluminofluoride and beryllofluoride complexes: new phosphate analogs in enzymology. Trends Biochem. Sci., 15, 6–10. [DOI] [PubMed] [Google Scholar]
- 23.Kleywegt G.J. and Jones,T.A. (1998) Databases in protein crystallography. Acta Crystallogr., 54D, 1119–1131. [DOI] [PubMed] [Google Scholar]
- 24. Molecular Simulations (1998) INSIGHTII, V 98.0. Molecular Simulations Inc., San Diego, CA.
- 25.Lawrence M.C. and Colman,P.M. (1993) Shape complementarity at protein/protein interfaces. J. Mol. Biol., 234, 946–950. [DOI] [PubMed] [Google Scholar]
- 26.Murzin A.G., Brenner,S.E., Hubbard,T. and Chothia,C. (1995) SCOP: a structural classification of protein database for the investigation of sequences and structures. J. Mol. Biol., 247, 536–540. [DOI] [PubMed] [Google Scholar]
- 27.Shingledecker K., Jiang,S.Q. and Paulus,H. (2000) Reactivity of the cysteine residues in the protein splicing active center of the Mycobacterium tuberculosis RecA intein. Arch. Biochem. Biophys., 375, 138–44. [DOI] [PubMed] [Google Scholar]
- 28.Chandra N.R., Ramachandraiah,G., Bachhawat,K., Dam,T.K., Surolia,A. and Vijayan,M. (1999) Crystal structure of a dimeric mannose-specific agglutinin from garlic: quaternary association and carbohydrate. J. Mol. Biol., 285, 11157–11168 [DOI] [PubMed] [Google Scholar]
- 29.Karlin S. and Brocchiei,L. (1996) Evolutionary conservation of recA genes in relation to protein structure and function. J. Bacteriol., 178, 1881–1894. [DOI] [PMC free article] [PubMed] [Google Scholar]
- 30.Lee J.W. and Cox,M.M. (1990) Inhibition of RecA protein promoted ATP hydrolysis. 1. ATP-γ-S and ADP are antagonistic inhibitors. Biochemistry, 29, 7666–7676. [DOI] [PubMed] [Google Scholar]
- 31.Lee J.W. and Cox,M.M. (1990) Inhibition of RecA protein promoted ATP hydrolysis. 2. Longitudinal assembly and disassembly of RecA protein filaments mediated by ATP and ADP. Biochemistry, 29, 7677–7683. [DOI] [PubMed] [Google Scholar]
- 32.Rittinger K., Walker,P.A., Eccleston,J.F., Smerdon,S.J. and Gamblin,S.J. (1997) Structure at 1.65 Å of RhoA and its GTPase-activating protein in complex with a transition-state analogue. Nature, 389, 758–762. [DOI] [PubMed] [Google Scholar]
- 33.Saenger W. (1984) Principles of Nucleic Acid Structure. Springer-Verlag, New York, NY.
- 34.Walker J.E., Saraste,M., Runswick,M.J. and Gay,N.J. (1982) Distantly related sequences in the alpha- and beta-subunits of ATP synthase, myosin kinase and other ATP-requiring enzymes and common nucleotide-binding fold. EMBO J., 1, 945–951. [DOI] [PMC free article] [PubMed] [Google Scholar]
- 35.Connolly M.L. (1993) The molecular surface package. J. Mol. Graphics, 11, 139–141. [DOI] [PubMed] [Google Scholar]
- 36.Konola J.T., Logan,K.M. and Knight,K.L. (1994) Functional characterization of residues in the P-loop motif of the RecA protein ATP-binding site. J. Mol. Biol., 237, 20–34. [DOI] [PubMed] [Google Scholar]
- 37.Kobayashi N., Knight,K. and McEntee,K. (1987) Evidence for nucleotide mediated changes in the domain structure of the RecA protein of E. coli. Biochemistry, 26, 6801. [DOI] [PubMed] [Google Scholar]
- 38.Milburn M.V., Tong,L., Devos,A.M., Brunger,A., Yamaizumi,Z., Nishimura,S. and Kim,S. (1990) Molecular switch for signal transduction: structural difference between active and inactive forms of protooncogenic ras proteins. Science, 347, 939–945. [DOI] [PubMed] [Google Scholar]
- 39.Al-Karadaghi S., Evarsson,A., Garber,M., Zheltonosova,J. and Liljas,A. (1996) The structure of elongation factor G in complex with GDP: conformational flexibility and nucleotide exchange. Structure, 4, 555–565. [DOI] [PubMed] [Google Scholar]
- 40.Hirshberg M., Stockley,R.W., Dodson,G. and Webb,M.R. (1997) The crystal structure of human rac1, a member of the rho-family complexed with a GTP analogue. Nature Struct. Biol., 4, 147–152. [DOI] [PubMed] [Google Scholar]
- 41.Nastri H.G. and Knight,K.L. (1994) Identification of residues in the L1 region of the protein which are important to recombination or coprotease activities. J. Biol. Chem., 269, 26311–26322. [PubMed] [Google Scholar]
- 42.Cox M.M. (2000) Recombinational DNA repair in bacteria and the RecA protein. Prog. Nucleic Acid Res. Mol. Biol., 63, 311–366. [DOI] [PubMed] [Google Scholar]
- 43.Sawaya M.R., Guo,S., Tabor,S., Richardson,C.C. and Ellenberger,T. (1999) Crystal structure of the helicase domain from the replicative helicase-primase of bacteriophage T7. Cell, 99, 167–177. [DOI] [PubMed] [Google Scholar]
- 44.Holm L. and Sander,C. (1995) Dali: a network tool for protein structure comparison. Trends Biochem. Sci., 20, 478–480. [DOI] [PubMed] [Google Scholar]
- 45.Soultanas P. and Wigley,D.B. (2000) DNA helicases: ‘inching forward’. Curr. Opin. Struct. Biol., 10, 124–128. [DOI] [PubMed] [Google Scholar]
- 46.Colston M.J. and Davis,E.O. (1994) Homologous recombination, DNA repair and mycobacterial recA genes. In Bloom,B.R. (ed.), Tuberculosis: Pathogenesis, Protection and Control. American Society for Microbiology, Washington, DC, pp. 217–224.
- 47.Savva R., McAuley-Hecht,K., Brown,T. and Pearl,L. (1995) The structural basis of specific base-excision repair by uracil-DNA glycosylase. Nature, 373, 487–493. [DOI] [PubMed] [Google Scholar]
- 48.Ravishankar R., Bidya Sagar,M., Roy,S., Purnapatre,K., Handa,P., Varshney,U. and Vijayan,M. (1998) X-ray analysis of a complex of Escherichia coli uracil DNA glycosylase (EcUDG) with a proteinaceous inhibitor. The structure elucidation of a prokaryotic UDG. Nucleic Acids Res., 26, 4880–4887 [DOI] [PMC free article] [PubMed] [Google Scholar]
- 49.Little J.W., Edmiston,S.H., Pacelli,L.Z. and Mount,D.W. (1980) Cleavage of the E.coli LexA protein by the recA protease. Proc. Natl Acad. Sci. USA, 77, 3225–3229. [DOI] [PMC free article] [PubMed] [Google Scholar]
- 50.Dutreix M., Moreau,P.L., Bailone,A., Galibert,F., Battista,J.R., Walker,G.C. and Devoret,R. (1989) New recA mutations that dissociate the various recA protein activities in Escherichia coli provide evidence for an additional role for RecA protein in UV mutagenesis. J. Bacteriol., 171, 2415–2423. [DOI] [PMC free article] [PubMed] [Google Scholar]
- 51.Kalpana G.V., Bloom,B.R. and Jacobs,W.R.,Jr (1991) Insertional mutagenesis and illegitimate recombination in mycobacteria. Proc. Natl Acad. Sci. USA, 88, 5433–5437. [DOI] [PMC free article] [PubMed] [Google Scholar]
- 52.Hinds J., Mahenthiralingam,E., Kempsell,K.E., Duncan,K., Stokes,R.W., Parish,T. and Stoker,N.G. (1999) Enhanced gene replacement in mycobacteria. Microbiology, 145, 519–527. [DOI] [PubMed] [Google Scholar]
- 53.Kraulis P.J. (1991) MOLSCRIPT: a program to produce both detailed and schematic plots of protein structures. J. Appl. Crystallogr., 24, 946–950. [Google Scholar]
- 54.Merritt E.A. and Bacon,D.J. (1997) Raster3D: photorealistic molecular graphics. Methods Enzymol., 277, 505–524. [DOI] [PubMed] [Google Scholar]
- 55.Henikoff S. and Henikoff,J.G. (1992) Amino acid substitution matrices from protein blocks.Proc. Natl Acad. Sci. USA, 89, 10915–10919 [DOI] [PMC free article] [PubMed] [Google Scholar]
- 56.Needleman S.B. and Wunsch,C.D. (1970) A general method applicable to the search for similarities in the aminoacids sequence of two proteins. J. Mol. Biol., 48, 443–453. [DOI] [PubMed] [Google Scholar]
- 57.Hofmann and Baron (1998) BOXSHADE: print outs from the multiple-aligned protein or DNA sequences. http://bioweb.pasteur.fr/seqanal/interfaces/boxshade.html.
- 58.Williams T. and Kelly,C. (1993) GNUPLOT, version 3.5.
- 59.Nicholls A., Shrap,K.A. and Honnig,B. (1991) Protein folding and association: insights from the interfacial and thermodynamic properties of hydrocarbons. Proteins, 11, 281–296. [DOI] [PubMed] [Google Scholar]
- 60.Esnouf R.M. (1999) Further additions to MolScript version 1.4, including reading and contouring of electron-density maps. Acta Crystallogr., 55D, 938–940. [DOI] [PubMed] [Google Scholar]