Abstract
Hydrogen has enough potential and can be successfully used as an alternative to the conventional fuel. It can be successfully produced from water that is not only a sustainable source but exists everywhere on earth. Additionally, its combustion releases water that is quite safe and environment friendly. The current project was designed to generate hydrogen from catalytic water splitting on TiO2@Ti3C2Tx catalysts. To obtain the required catalytic characteristics, titania was engineered on Ti3C2Tx surfaces in situ using an ethanol-assisted solvothermal approach. After careful recovery, the catalysts were characterized and assessed for the photoreaction. All photoreactions were performed in a quartz reactor (150 mL), where hydrogen evolution activities were monitored on GC-TCD (Shimadzu-JP). The comparative activities indicated that TiO2@C and TiO2@Ti3C2Tx catalysts deliver 9.37 and 18.57 mmol g−1 h−1 of hydrogen, respectively. The higher activities of TiO2@Ti3C2Tx were attributed to the existence of higher active sites (charge trapping centres) on the multilayer MXene that progressively promote and facilitate redox reactions. Reason is that existence of titania on MXene interfaces develops heterojunctions that rectify the charge transfer; hence reduce the charge recombination (i.e., back reaction). On the basis of encouraging activities, it has been concluded that the aforementioned approach holds promise to replace the costly and conventional hydrogen generation technologies.
Ethanol assisted solvothermal approach was introduced to produce TiO2@Ti3C2Tx and TiO2@C catalysts for comparative H2 generation from water splitting.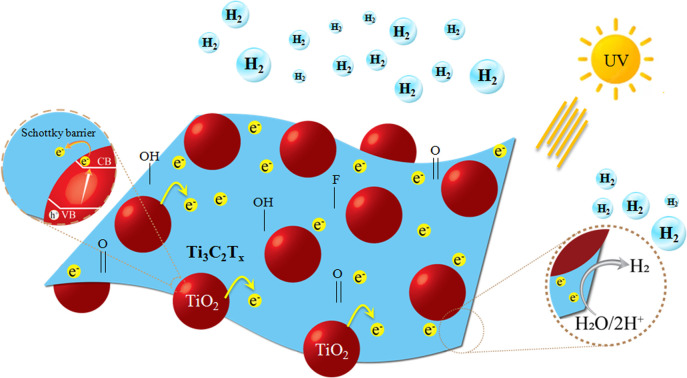
Introduction
Without doubt, fossil fuels are the main sources of the world's energy, but pollution generated by their burning is enough to ruin life on earth. If the current speed of fossil fuel consumption continues, it will definitely bring a severe change in the earth's climate.1 Unpredictable weather, sudden hailstorms and rainfalls are undeniable evidence of climate change. Thus, for life on earth, an alternative and green source is urgently needed.2 That is why the scientific community is focusing on new and sustainable sources that not only meet the energy demand but also protect our earth and atmosphere. Additionally, excessive growth in the human population and industrialization increase these challenges. Due to high costs of conventional energy sources, developing countries are struggling to shift from fossil fuels to green and sustainable sources.3
Hydrogen is an ideal fuel due to its (i) high calorific value (150 kJ g−1), (ii) zero carbon emissions, and (iii) renewable nature.4 Water is a stable molecule, and it needs 237 kJ mol−1 of energy to split into hydrogen and oxygen. However, the activation energy of the water splitting reaction can be reduced with the use of stable and effective catalysts.5 For water splitting, commonly used photocatalysts are TiO2, ZrO2, ZnO, SrTiO3, BaTiO3, ZnS, CeVO4, CuO, CdS, CdZnS, g-C3N4, ZnIn2S4, and Zn3V2O8.6–14 However, these catalysts have been restricted due to the following drawbacks: (i) fast charge recombination; (ii) poor optical response; (iii) photocorrosion; (iv) stability and durability; and (v) improper band gaps and structural defects.15 Due to the aforementioned drawbacks, these catalysts cannot split water efficiently; therefore, for progressive water splitting, improvements in the catalytic system have become necessary. Thus, modifications using co-catalysts like MXene or graphene have gained more interest due to their excellent conductivity.16
In recent decades, MXene (Ti3C2Tx) has opened new pathways for developing stable and durable catalysts. The reason is that MXenes naturally exhibit surface terminations like –F, O, and –OH that enhance the surface reaction ability of catalysts.17 Among the MXenes family, titanium carbide (Ti3C2Tx) has gained significant attention for energy conversion and storage applications. Due to tuneable characteristics, increased conductivity, and intrinsic features, it facilitates more active sites during photoreactions.18
Among co-catalysts, MXene and graphene have been identified as exceptional co-catalysts that can effectively promote surface charges to the active centres (i.e., redox sites). Additionally, these co-catalysts have substantial selectivity and can only perform in optimized catalytic reactions. However, the fabrication of MXene with TiO2 for targeted applications (i.e., water splitting) is quite challenging having relatively high mechanical strength.19 Because the dispersion of MXene matrix on semiconductor's surfaces can be problematic, this causes agglomeration during the developmental process. Hence, the synthesis of TiO2/Ti3C2Tx and TiO2/C has been found significant factor for excellent photocatalytic activities.20 The advantage of MXene support is that it can become the inherent source of TiO2 growth due to Ti–C–Ti–C–Ti structural arrangements.21 Additionally, the complete oxidation of Ti3C2Tx produces the carbide-derived carbon (CDC), which also acts as co-catalyst and promotes the photon absorption ability of semiconductor systems.22 Thus, in situ developments of metal oxide, i.e., TiO2, on Ti3C2Tx and CDC are quite important to enhance the overall catalytic efficiency of the photoreaction.
In this work, we have extended the utilization of MXene using in situ-engineered TiO2 (i.e., TiO2@Ti3C2Tx and TiO2@C) via an ethanol-assisted solvothermal approach. The significant advantage of in situ growth of TiO2 has the following advantages for catalytic water splitting: (i) superior conductivity and charge transportation; (ii) formation of heterojunctions to reduce back reactions; (iii) extension of the internal optical response during photoreaction; (iv) enhanced stability and durability; (v) enhanced pool of reactive charges on the redox sites. The findings of the current project deliver encouraging examples of renewable energy systems that can be further be improved for large-scale implementation.
Experimental
The details of the chemicals and instruments used in current work have been discussed in the ESI† section.
Catalysts preparation
The scheme that was employed to design the MXene and derived catalysts is illustrated in Fig. 1. In this study, Ti3C2Tx, i.e., titanium carbide, has been developed by the etching process, which was designed and selectively performed with HF (ca. 40%) [20]. Typically, 500 mg of Ti3AlC2 was transferred to 40 mL of the aforementioned HF in a 100 mL Teflon reactor. Note that the reaction process was completed in a safe environment, i.e., under a fume hood. To ensure the complete removal of aluminium, the product was vigorously stirred under gentle sonication [21]. The chemical reaction involved in this process is given in eqn (1).
| Ti3AlC2 + 6HF → AlF3 + Ti3C2Tx + 3H2 | 1 |
Fig. 1. Graphical illustration for the synthesis of Ti3C2Tx, TiO2@Ti3C2Tx and TiO2@C catalysts.
To isolate Ti3C2Tx from the HF solution, the suspension underwent some important steps: (i) centrifugation at 5000 rpm; (ii) careful washing six times to eliminate impurities; and (iii) vacuum-drying at 85 °C.
In this study, TiO2@Ti3C2Tx and TiO2@C catalysts were synthesized via an ethanol-assisted solvothermal approach.23 The Ti3C2Tx was used as a precursor material because it has an inherent titanium source for the growth of TiO2 due to Ti–C–Ti–C–Ti structural arrangements.24 Typically, 200 mg of the aforementioned precursor support was dispersed in 40 mL of mixture solvents (with 80 : 20 water/ethanol ratios) and sonicated for 10 min. For the in situ growth of TiO2 on Ti3C2Tx, this mixture was transferred to a Teflon-lined autoclave reactor for 2 h at 180 °C. The reaction was continued for a further 4 h to achieve the complete oxidation of MXene so that it is successfully transformed into the high-textured TiO2@C product. It has been noted that optimized conditions are necessary to obtain the complete oxidation of MXene for developing high-quality TiO2 catalyst textures in situ on the surfaces of carbide.25 After hydrothermal reaction, catalysts were recovered by vacuum filtration. To remove the impurities or unreacted precursors, catalysts were thoroughly rinsed with the ethanol/acetone mixture (80 : 20 v/v ratios). To eliminate the moisture from layered structures, catalysts were vacuum dried at 95 °C for 5 h.
Photocatalytic activities
Photocatalytic water splitting reactions for hydrogen generation were carried out using a PLS-SXE300 lamp. The photoreactions were performed in a 150 mL quartz reactor, where a 20 mg dose of catalysts was optimised for 50 mL of pure water. H2 and O2 generation rates were quantified by taking gas samples (0.5 mL per syringe) from the headspace of the photoreactor. For the accurate analysis, high-purity argon served as the carrier gas. A specialized molecular sieve capillary column was used for gas separation. The gases were quantified using the internal calibration curves of the gas chromatography system (GC-TCD, Shimadzu, 2010).26 Quantum efficiencies (QEs) were calculated using eqn (2). Note that these measurements were executed under controlled conditions.
 |
2 |
Results and discussions
The synthesis scheme of Ti3C2Tx, TiO2@Ti3C2Tx, and TiO2@C catalysts is shown in Fig. 1. Various characterization techniques have been employed to study the structural, morphological, optical, magnetic, and chemical properties of the synthesized catalysts, which have been discussed below.
XRD analyses
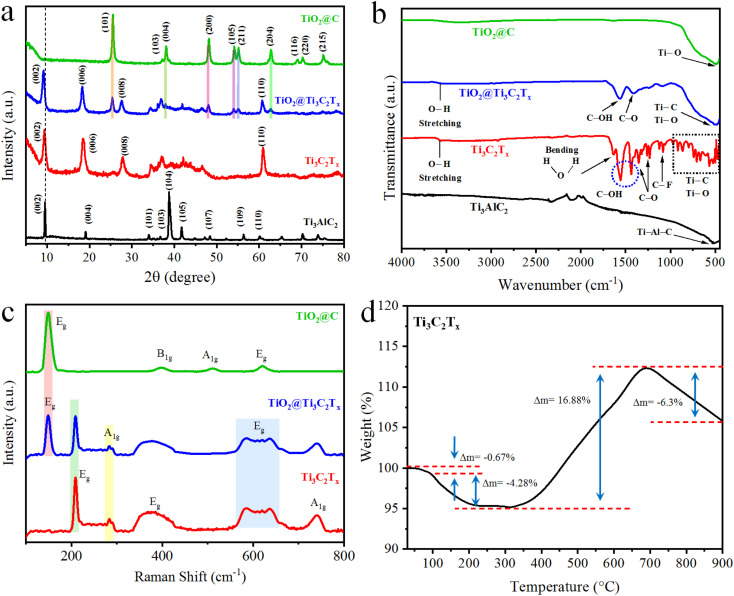
The XRD patterns of Ti3AlC2 (MAX), Ti3C2Tx (MXene), TiO2@Ti3C2Tx and TiO2@C are described in Fig. 2a. XRD is an excellent tool that can accurately provide significant insights about structural transformations.27 Results of this study indicate that the XRD pattern of pristine Ti3AlC2 closely matches JCPDS No. 52-0875, validating its purity with hexagonal crystalline structure.28 Notably, the XRD patterns of Ti3C2Tx display broader lattice planes (002) as compared to Ti3AlC2. It is worth mentioning that shift of the (002) planes towards smaller angles along with the disappearance of the characteristic peak at 39° (i.e., corresponds to (104) planes) indicate the complete removal of aluminium atoms (in the form of AlF3).29 These results confirm the phase purity and successful transformation of MAX to Ti3C2Tx structures. The TiO2@Ti3C2Tx catalysts exhibit the inherent diffractions of TiO2 (anatase) along with the Ti3CxTx XRD patterns. The changes in diffraction pattern confirm the in situ growth of TiO2 over Ti3C2Tx surfaces. On the other hand, the peak positions of TiO2@C confirm the anatase structure and are exactly matched with PDF#73-1764.30 Additionally, removal of Ti3C2Tx diffraction peaks confirms the complete conversion (i.e., oxidation) of Ti–C–Ti–C–Ti to the TiO2@C.31 XRD pattern and their corresponding hkl values for as reported catalysts have been tabulated in Table S1.† The structural changes observed in XRD results provide valuable insights into catalyst performance.
Fig. 2. (a) XRD pattern; (b) FTIR results of Ti3AlC2, Ti3C2Tx, TiO2@Ti3C2Tx, and TiO2@C; (c) Raman spectroscopy results of Ti3C2Tx, TiO2@Ti3C2Tx, and TiO2@C; (d) TGA of Ti3C2Tx.
FTIR analyses
The FTIR analysis (Fig. 2b) of Ti3AlC2 revealed the bending vibrations of the Ti–Al–C bond at 505 cm−1. The etching of aluminium was confirmed by the removal of the 505 cm−1 peak, whereas new vibration patterns are attributed to surface termination (Tx O, –F, –OH).32 FTIR results indicate that the vibrations observed at 566 cm−1, 706 cm−1, 855 cm−1, and 922 cm−1 are attributed to the Ti–C/Ti–O stretching vibrations. The O-terminations on the Ti3C2Tx surface caused Ti–O vibrations at 617 cm−1. F-terminations are observed at 1057 and 1097 cm−1, whereas O–H terminations are detected at 1399 and 1437 cm−1.33 The vibrations at 1229 and 1343 cm−1 are attributed to adsorb/atmospheric CO2.34 These results confirm the formation of a multilayer Ti3C2Tx structure. In the FTIR results of TiO2@Ti3C2Tx catalysts, the strong vibration at 480 cm−1 confirms the formation of TiO2 over Ti3C2Tx. The aforementioned results also demonstrate the surface terminations ( O and –OH) along with Ti–C vibrations of Ti3C2Tx. For TiO2@C, the Ti–O peak was detected at a frequency of 480 cm−1. The presence of adsorbed water molecules on the catalyst surface was observed at 1628 (bending vibrations) and 3550 cm−1 (stretching vibrations).35 The absence of any Ti–C peaks confirms that all Ti–C–Ti–C–Ti bonds were completely converted into TiO2@C, which underwent heterostructures to enhance the activity performances of catalysts during photoreactions.
Raman analyses
The Raman results for Ti3C2Tx, Ti3C2Tx@TiO2, and TiO2@C were obtained in the 100–800 cm−1 region (Fig. 2c). MXenes (Ti3C2Tx) belong to the D3d point group, and their vibrations can be described using Mulliken symbols as 2(N − 2) Eg + (N − 2) A1g + 2(N − 2) Eu + (N − 2) A2u, where N represents the number of atoms per unit cell (i.e., five in the case of Ti3C2).36 The Eg and Eu are doubly degenerate modes (mostly Eg is used for representation), while Eg and A1g are the only Raman-active vibration modes. In MXene (Ti3C2Tx), four Raman modes are active: Eg and A1g signify the in-plane and out-of-plane vibration of Ti atoms, along with two additional vibration modes of C atoms (Fig. S1†).37 The Raman frequency of 208 cm−1 (Eg mode) is attributed to in-plane vibrations of Ti and C atoms. The carbon layer vibrations appear at higher frequencies (500–800 cm−1). The presence of surface terminations ( O, –F, –OH) causes more vibrations due to the increased atoms in the unit cell. The Raman results of Ti3C2Tx show three regions: lower frequencies for entire flake vibrations, mid-frequency for surface terminations, and higher frequencies for carbon and surface terminations (Fig. S1†).36 The Eg corresponds to in-plane vibrations, and A1g corresponds to out-of-plane vibrations. The Raman vibrations around 600 cm−1 (Eg mode) were attributed to the C–O vibrations. As compared to the pristine Ti3C2Tx, the Raman peaks of TiO2@Ti3C2Tx indicate the formation of titanium dioxides, with the vibrations at 147 cm−1 that correspond to the anatase phase. Moreover, the Raman spectrum of TiO2@C exhibits Raman vibrations at 148 cm−1 (Eg), 397 cm−1 (B1g), 510 cm−1 (A1g) and 620 cm−1 (Eg). These vibrations were attributed to the oxygen atoms of O–Ti–O (correspond to the anatase phase).38
TGA analysis
Thermal gravimetric analysis (TGA) of Ti3C2Tx in an oxygen atmosphere was conducted to observe changes as the temperature increased up to 900 °C.39 The results (Fig. 2d) demonstrate four weight-change steps. The first weight change was due to the loss of water adsorbed on the surface of Ti3C2Tx. In the second step, the surface terminations and bonded water were released up to 319 °C.40 Further increases in temperature led to the oxidation of Ti3C2Tx, resulting in a subsequent 19.98% increase in mass. The oxidation of Ti3C2Tx started at 320 °C and finally began to decompose at 729 °C.41 TGA results revealed the thermal stability of Ti3C2Tx in an oxygen atmosphere and TiO2 formation (oxidation) on its surface.
SEM studies
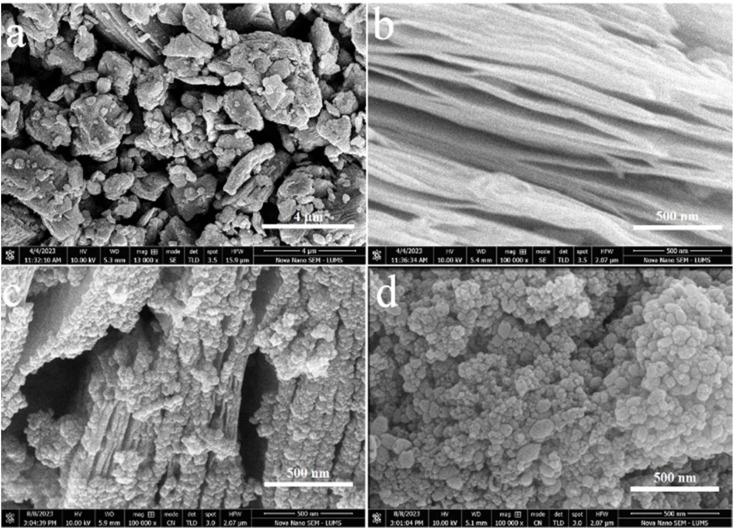
Field-emission scanning electron microscopy (FESEM) was utilized to analyse the surface features and characteristics of catalyst.42 The SEM results of Ti3AlC2, Ti3C2Tx, TiO2@Ti3C2Tx, and TiO2@C are demonstrated in Fig. 3a–d. The SEM results of commercial Ti3AlC2 powder (Fig. 3a) demonstrate the solid block structure with smooth surfaces. The etching of Ti3AlC2 produces accordion-like multilayer nanosheets loosely bound together,43 as shown in Fig. 3b. The MXene layers are clearly separated as compared to the MAX powder that confirms the successful exfoliation (i.e., aluminium removal). The expansive 2D structure of Ti3C2Tx nanosheets offers an abundance of active sites and terminations (i.e., –O, –OH, –F) that improve the interactions with reactants for hydrogen generation.44 The in situ growth of anatase TiO2 over the Ti3C2Txvia hydrothermal reactions is revealed in Fig. 3c. The result illustrates the uniform distribution of TiO2 particles over the Ti3C2Tx surfaces and within the structure of Ti3C2Tx.45 The complete oxidation of MXene produced TiO2@C catalysts having uniform dispersion of TiO2 across the material. Fig. 3d illustrates a significant difference when compared to pristine anatase (see Fig. S2†). The TiO2 derived from Ti3C2Tx showcases significantly higher crystallinity compared to other forms of TiO2.46
Fig. 3. (a) SEM results of MAX (Ti3AlC2); (b) MXene (Ti3C2Tx); (c) TiO2@Ti3C2Tx; (d) TiO2@C.
AFM analysis
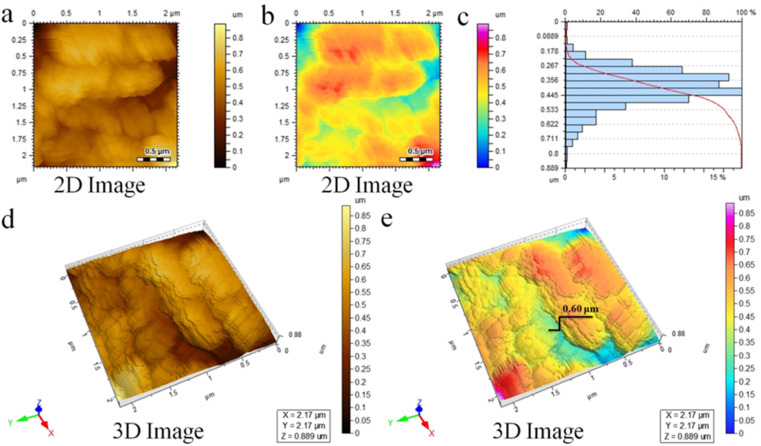
Atomic force microscopy (AFM) provides detailed insights into the surface features, morphology, and size distribution of TiO2@Ti3C2Tx catalysts at nearly atomic scale.47 The detailed 2D topographical images are exhibited in Fig. 4a and b. A scan area of 2.17 × 2.17 μm was utilized to assess the height (thickness) distribution within the range of 0.8 μm. The recorded average thickness of 0.445 μm is validated in Fig. 4c. Moreover, Fig. 4d and e reveals three-dimensional results that provide insights to the surface features and roughness of the TiO2@Ti3C2Tx photocatalysts.48
Fig. 4. AFM results of the TiO2@Ti3C2Tx photocatalysts: (a and b) 2D-tapping modes, (c) thickness distribution, and (d and e) 3D images.
XPS analyses
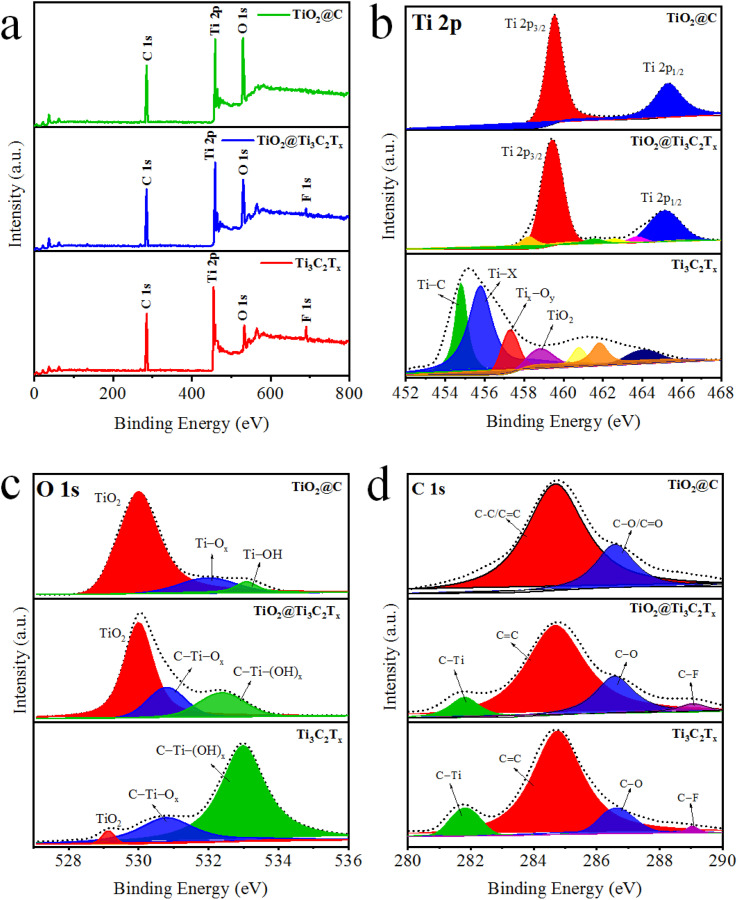
The oxidation states and chemical compositions of as-synthesized catalysts were studied by X-ray photoelectron spectroscopy (XPS).49 The comparative results (survey scans) of Ti3C2Tx, TiO2@Ti3C2Tx, and TiO2@C are illustrated in Fig. 5a. The XPS results of Ti3C2Tx demonstrate the existence of fluorine terminations due to the use of HF during its synthesis.50 The binding energies of titanium 2p3/2 and 2p1/2 were observed at 455.1 and 461.3 eV (see Fig. 5b), which confirms the existence of Ti–C bonds along with various other surface terminations (i.e., O, –OH).51 This spectroscopic study provides a detailed material's composition as well as its surface features. In TiO2@Ti3C2Tx catalysts, the formation of TiO2 over the Ti3C2Tx surfaces was confirmed by the sifting of 2p3/2 and 2p1/2 peaks to 459.3 eV and 465 eV, respectively.52 The results depict that complete oxidations of Ti3C2Tx cause the removal of surface termination. Note: termination that exists on MXene layered structure. Fig. 5c demonstrates O 1s peaks for the Ti3C2Tx, TiO2@Ti3C2Tx, and TiO2@C catalysts. The Ti3C2Tx exhibits C–Ti–(OH)x, C–Ti–Ox and TiO2 peaks at binding energies of 532.98, 530.78, and 529.18 eV, respectively.53 The increased intensity of Ti–O bonds and decreased intensity of C–Ti peaks indicate the in situ growth of TiO2 on the Ti3C2Tx surface. Results depict that oxygen terminal groups were transformed into TiO2. The C 1s XPS results demonstrate four peaks fitted at 281.88, 284.88, 286.58, and 289.18 eV, which were assigned to the C–Ti, C C, C–O, and C–F bonds, respectively (Fig. 5d). The intensities of the C–Ti and C–F peaks decrease in TiO2@Ti3C2Tx and TiO2@C catalysts (as oxidation progresses), which converts the Ti–C bonds into Ti–O bonds.54
Fig. 5. (a) Survey scans, (b) Ti 2p, (C) O 1s, and (d) C 1s XPS results of Ti3C2Tx, TiO2@Ti3C2Tx, and TiO2@C.
UV-vis/DRS and PL studies
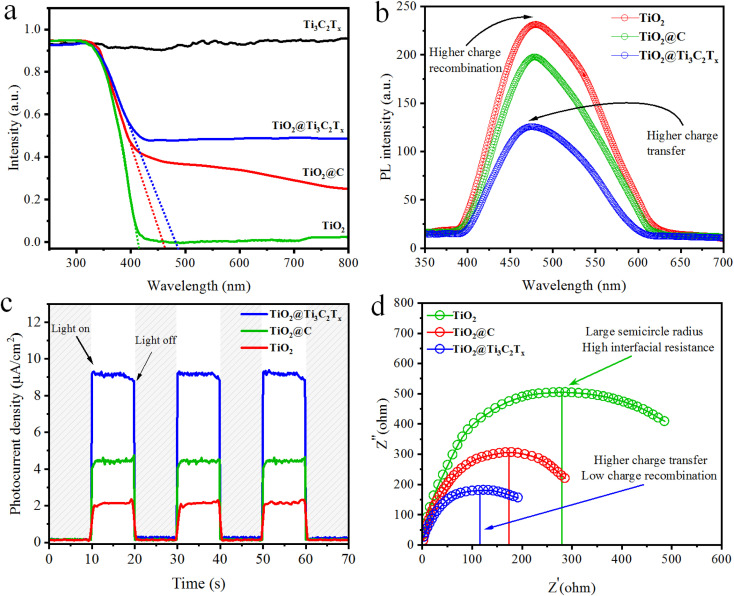
The optical properties of as-synthesized catalysts were obtained using UV-vis diffuse reflectance absorption spectra as shown in Fig. 6a. The UV-vis/DRS results demonstrate the ability of TiO2, TiO2@C, TiO2@Ti3C2Tx, and Ti3C2Tx to absorb photons, and then bandgap energy values were estimated using the Tauc plot method (Fig. S3†).55 TiO2 (anatase) displays absorption in the UV region with a bandgap energy of 3.1 eV, whereas Ti3C2Tx (MXene) exhibits photon absorption across the entire visible and UV region. The in situ growth of TiO2 over Ti3C2Tx displays an increase in photon absorption.56 The increase in light absorption is due to the presence of black-coloured MXene and carbide-derived carbon (CDC).57
Fig. 6. (a) UV-vis/DRS, (b) PL, (c) photocurrent response, and (d) EIS results of TiO2, TiO2@C, and TiO2@Ti3C2Tx catalysts.
The charge separation, transfer, and recombination were studied via the photoluminescence (PL) technique. The PL intensity of pristine TiO2 indicates higher recombination of photoexcited charges (back reaction).13,58 The PL intensities of synthesized catalysts suggest that TiO2@Ti3C2Tx has less charge recombination and can deliver relatively higher H2 production; see Fig. 6b. The improvements in electron transport and charge separation are attributed to the development of an in situ heterojunction.59
TPC and EIS studies
Electrochemical impedance spectroscopy (EIS) and transient photocurrent (TPC) responses were used to study the charge transfer efficiency. The TPC responses of TiO2, TiO2@Ti3C2Tx and TiO2@C were analysed with on/off cycles (Fig. 6c). The results demonstrate that TiO2@Ti3C2Tx catalysts exhibit a higher photocurrent response as compared to TiO2 and TiO2@C. The higher photoresponse is attributed to the higher charge separation.60
EIS measurements for TiO2, TiO2@Ti3C2Tx and TiO2@C catalysts are shown in Fig. 6d. TiO2@Ti3C2Tx shows a smaller semicircle diameter, which suggests improved interface carrier transfer and decreased interface resistance. TiO2@Ti3C2Tx catalysts exhibit improved charge separation efficiency and improved charge transfer across interfaces. The lower interface resistance indicates the improved photocatalytic efficiencies.52
BET surface area analyses
The surface area of the prepared photocatalysts was determined through nitrogen adsorption–desorption isotherms using BET measurements, as depicted in Fig. 7a–c. All catalysts exhibit typical IV isotherms and H3 hysteresis loops according to Brunauer–Deming–Deming–Teller (BDDT) classifications.61 The surface areas of Ti3C2Tx, TiO2@Ti3C2Tx, and TiO2@C are 8.12, 32.57 and 28.17 m2 g−1, respectively. The larger surface area of TiO2@Ti3C2Tx is due to the in situ distributions of TiO2 particles over Ti3C2Tx; hence, the possibility of agglomeration between TiO2 particles becomes quite low.62 Pore size distributions were calculated and are depicted in Fig. 7a–c, revealing very close pore size distributions with a peak centered at ca. 5.0 nm. The TiO2@Ti3C2Tx and TiO2@C catalysts are approximately twice as mesoporous compared to pristine Ti3C2Tx.63 Therefore, the in situ growth of TiO2 over Ti3C2Tx provides a larger and more mesoporous surface area for enhanced H2 and O2 evolution reactions.
Fig. 7. BET results of (a) Ti3C2Tx, (b) TiO2@Ti3C2Tx, and (c) TiO2@C catalysts, and (d) VSM hysteresis loop of Ti3C2Tx, TiO2@Ti3C2Tx and TiO2@C catalysts.
EPR and VSM studies
The presence and properties of oxygen vacancies were investigated utilizing electron paramagnetic resonance (EPR) spectroscopy.64 It is evident from the results (Fig. S4†) that no EPR signal appeared in the pristine Ti3C2Tx sample. On the other hand, a distinct signal featuring a G factor of 2.005 was observed in both the TiO2@C and TiO2@Ti3C2Tx catalysts, indicating the trap and transfer of unpaired electrons. Notably, a higher signal was observed in the TiO2@Ti3C2Tx catalysts as compared to the TiO2@C catalysts.64 Some recent reports suggest that the existence of oxygen vacancies is more challenging for photocatalytic H2 evolution reactions.65
The magnetic properties of the as-synthesized catalysts were examined via the vibrating-sample magnetometry (VSM) technique (Fig. 7d). This analysis provides crucial insights into saturated magnetic intensity (Ms), residual magnetic intensity (Mr), coercivity (Hc), and squareness ratio.66 The TiO2@Ti3C2Tx and TiO2@C photocatalysts exhibit Mr values of 0.064 and 0.071 emu g−1 respectively. By using the VSM plots, the magnetic parameters (Ms, Mr, Hc, and squareness ratio) of the as-synthesized catalysts are tabulated in Table S2.†
Water splitting activities
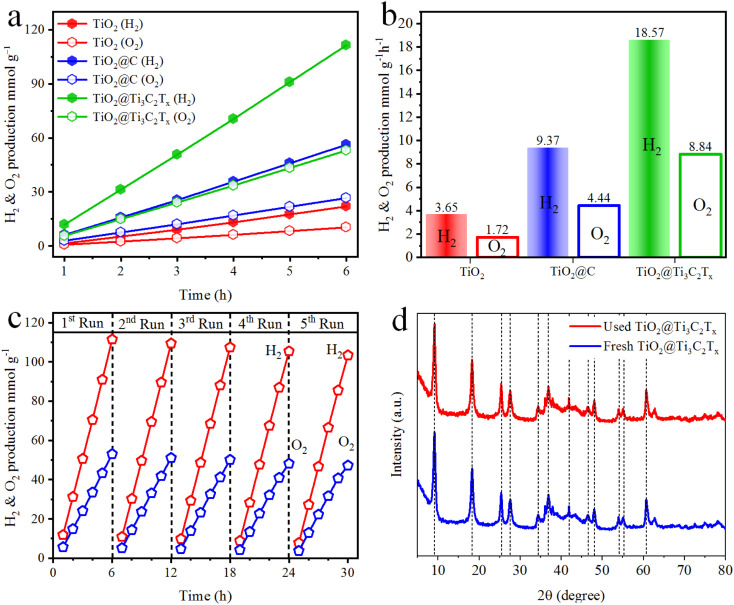
The hydrogen and oxygen evolution rates have been measured to evaluate the catalytic performances. Fig. 8a and b indicate the activities in mmol g−1 and mmol g−1 h−1, respectively. The results demonstrate that H2 and O2 generation increases linearly with the irradiation time for each photocatalytic reaction. It has been observed that TiO2@C and TiO2@Ti3C2Tx catalysts exhibit 9.37 and 18.57 mmol g−1 h−1 of hydrogen, respectively. The O2 production rate was approximately half that of the H2 production rate. It is worth mentioning that the activity in the case of TiO2@C is two times higher, while for TiO2@Ti3C2Tx, it is five times higher than pristine TiO2. The comparison of H2 and O2 evolution rates of TiO2, TiO2@C and TiO2@Ti3C2Tx catalysts and their %QE are tabulated in Table S3.† The higher catalytic performances of TiO2@Ti3C2Tx are attributed to the existence of multilayer structures that contribute relatively higher active sites to promote water reduction reactions. Additionally, during the photoreaction, the formation of heterojunctions and Schottky barriers at the interfaces enhances the charge transfer to promote and drag water splitting reactions.67 Additionally, the higher surface area also has a considerable impact on the photocatalytic activity. In TiO2@C catalysts, carbide-derived carbon (CDC) serves as an electron acceptor and drags charges to improve H2 and O2 production rates.68 Comparatively, TiO2@Ti3C2Tx is a promising catalyst for water splitting reactions due to its layered structures, higher charge transfer, and large number of active sites available for redox reactions.
Fig. 8. Hydrogen and oxygen production activities of TiO2, TiO2@C, and TiO2@Ti3C2Tx (a) mmol g−1 and (b) mmol g−1 h−1; (c) recyclability and (d) XRD results of fresh and used TiO2@Ti3C2Tx catalysts.
Photocatalyst stability and its reusability are crucial factors in accessing the catalyst's practicability. The recycling studies were carried out for five consecutive cycles using TiO2@Ti3C2Tx catalysts. It is noteworthy that the photocatalytic activity remained steady even after five cycles (Fig. 8c). The slight decrease in activity was caused by catalyst deposition on the inner surface of the reactor wall.35 The XRD analysis of both fresh and used TiO2@Ti3C2Tx catalysts was compared, and it was found that there was no significant difference in crystallinity, as shown in Fig. 8d. These findings suggest that TiO2@Ti3C2Tx catalysts have exceptional stability, which is due to the in situ-grown TiO2 over the MXene structures.69
Charge transfer and water splitting mechanisms
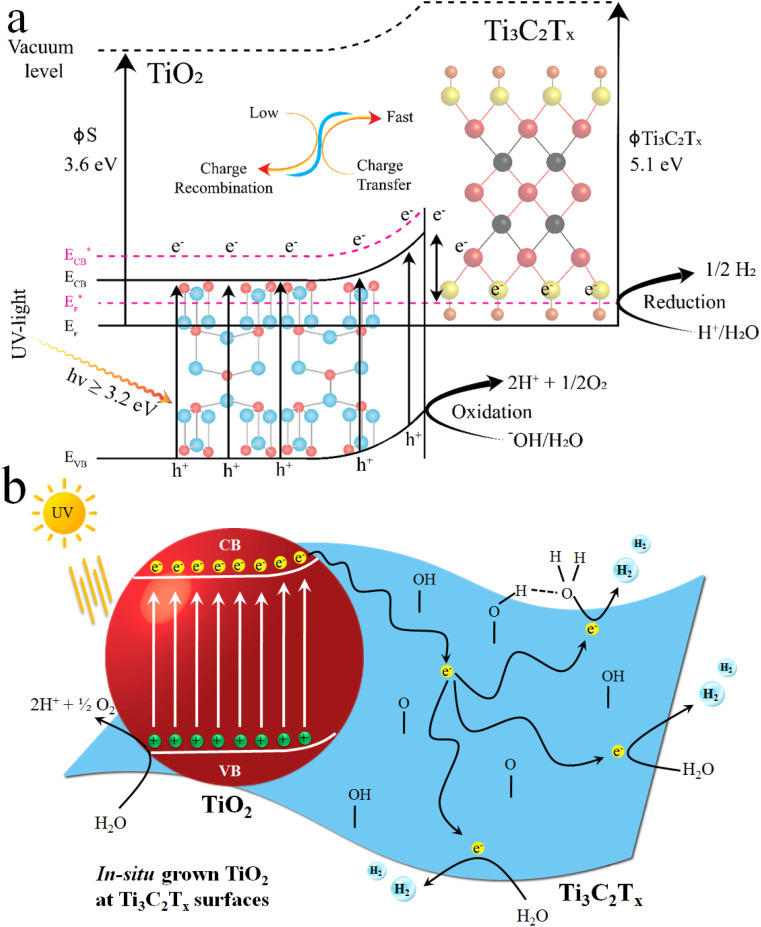
In a photocatalytic reaction, photons have greater energy than the band gaps, i.e., ≥ EG, when the excitation of charges occurs on the surfaces of semiconductors. During excitation, electrons start to move from the valence band (VB) to the conduction band (CB) of the semiconductor, leaving behind the electrons deficient charges, i.e., holes.70Fig. 9a demonstrates the water splitting process during the photocatalytic reaction. It has been found that TiO2@Ti3C2Tx exhibits higher catalytic efficiencies relative to the TiO2@C catalysts. Higher H2 and O2 evolution efficiencies in the case of TiO2@Ti3C2Tx are attributed to the presence of electron promoters, i.e., MXene. It is obvious that MXene's exceptional conductivity contributes to the transportation of electrons to active sites, where a water reduction reaction occurs to generate hydrogen.71 Additionally, due to the layered structure of MXene, electron trapping and transfer become relatively high, where electrons can stay on redox sites for further utilization/consumption.18 During the photoreaction, a dynamic equilibrium is established between MXene and TiO2, which aligns the Fermi energy (EF) of the TiO2@Ti3C2Tx photocatalyst to develop a new quasi-Fermi state,  .72 Moreover, due to the higher work function of MXene (Ti3C2Tx), the feasibility of electron population on the TiO2@Ti3C2Tx system increases, which is why these catalysts contribute relatively higher rates of hydrogen evolution in photoreaction.73 MXene develops heterojunctions with TiO2; hence, it enhances the feasibility to quench and transfer the charges during photoreaction. That is why TiO2@Ti3C2Tx effectively promotes electron transfer to the
  of TiO2.74 It is worth mentioning that due to heterojunctions, the Schottky barrier at the interface suppressed the charge recombination (i.e., back reaction).
Fig. 9. (a) Charge transfer on TiO2@Ti3C2Tx catalysts; (b) mechanism of water splitting over TiO2@Ti3C2Tx catalysts.
On the other hand, during catalytic water splitting, oxygen-carrying moieties, i.e., −OH, or peroxide −O2, undergo oxidation with holes.75 During photoreactions, MXene layers favour the generation of O vacancies when they become exposed to or come into contact with water.76 The hydrogen evolution process over TiO2@Ti3C2Tx catalysts is initiated with the protonation of –O terminations during photoreaction (photon absorptions). It is worth mentioning that in photoreaction protons inherently adsorb on the –O sites instead of Ti sites to in situ develops the TiO2@Ti3C2(OH)x structures (see eqn (3)–(5)). Subsequently, the adjacent Ti site undergoes protonation. This protonation then favours the enhancement and promotion of catalytic hydrogen.77 The catalytic reaction is demonstrated in eqn (3)–(5).
| Ti–O–Ti + H+ + e− → Ti–OH*–Ti | 3 |
| Ti–OH*–Ti + H+ + e− → Ti–OH*–Ti–H* | 4 |
| Ti–OH*–Ti–H* → Ti–O–Ti + H2 | 5 |
These above chemical reactions prove the process of protonation and charge transfer involved in hydrogen generation.77Fig. 9b illustrates the photoreaction and catalytic hydrogen and oxygen generation over TiO2@Ti3C2Tx catalysts. In the case of TiO2@C catalysts (see Fig. S5†), photogenerated electrons are quenched by the CDC layers to drag the water splitting reactions.68
Conclusions
TiO2@Ti3C2Tx catalysts have been successfully synthesised and employed for water splitting reactions. In this project, an ethanol-assisted solvothermal approach was introduced to achieve the required morphologies and catalytic characteristics. Typically, TiO2@Ti3C2Tx and TiO2@C catalysts were optimized and assessed for comparative activities. The morphology and optical characteristics were assessed via XRD, FTIR, Raman spectroscopy, TGA, SEM, AFM, UV-vis/DRS, XPS, PL, TPC, EIS, BET, EPR, and VSM. The results confirm the morphology, excellent optical response, and charge transfer that indicate the speciality of the current work. The results show that TiO2@Ti3C2Tx exhibits higher catalytic activity, i.e., 18.57 mmol g−1 h−1 of H2 and 8.84 mmol g−1 h−1 of O2, which is almost double the activity of TiO2@C. It is worth mentioning that the higher activity of TiO2@Ti3C2Tx is attributed to the existence of titania on MXene multilayers that offer more reactive sites and redox centres. The results indicate that heterojunctions between titania and Ti3C2Tx executed the rectification and charge transfer to active sites (i.e., redox centres). Additionally, heterojunctions rectify and reduce the back flow of charges during the photoreaction. This significant factor anticipates the consequences of higher catalytic efficiencies. Based on results and activities, it has been anticipated that the current study holds promise to replace costly and conventional catalysts. Although there are many challenges ahead, the described approach has great potential to deliver sustainable hydrogen for the proper implementation of green technologies.
Data availability
The data and necessary protocols of this study have been included as part of the ESI.†
Conflicts of interest
The authors declare no competing financial interest.
Supplementary Material
Acknowledgments
This project was funded by the Higher Education Commission (HEC) of Pakistan with grant No. 377/IPFP-II/Batch-I/SRGP/NAHE/HEC/2020/27 and ASIP/R&D HEC/2023/5/22696/124. The completion of the project is fully accredited to the Inorganic Material Laboratory 52 s, Institute of Chemistry-IUB Pakistan. Dr E. H. thanks Carnegie Mellon University of USA and the University of Karachi (HEJ–Centre) for facilitating instrumental access and support.
Electronic supplementary information (ESI) available. See DOI: https://doi.org/10.1039/d4na00754a
References
- Anderson K. Buck H. J. Fuhr L. Geden O. Peters G. P. Tamme E. Nat. Rev. Earth Environ. 2023;4:808–814. doi: 10.1038/s43017-023-00493-y. [DOI] [Google Scholar]
- Diodato N. Ljungqvist F. C. Bellocchi G. Sci. Rep. 2020;10:22062. doi: 10.1038/s41598-020-78857-3. [DOI] [PMC free article] [PubMed] [Google Scholar]
- Li C. Mogollón J. M. Tukker A. Dong J. von Terzi D. Zhang C. Steubing B. Renew. Sustainable Energy Rev. 2022;164:112603. doi: 10.1016/j.rser.2022.112603. [DOI] [Google Scholar]
- Liu H. He S. Li G. Wang Y. Xu L. Sheng P. Wang X. Jiang T. Huang C. Lan Z. ACS Appl. Mater. Interfaces. 2022;14:42102–42112. doi: 10.1021/acsami.2c11805. [DOI] [PubMed] [Google Scholar]
- Rajakaruna R. and Ariyarathna I., in Handbook of Functionalized Nanomaterials for Industrial Applications, Elsevier, 2020, pp. 83–109 [Google Scholar]
- Hussain E. Majeed I. Nadeem M. A. Badshah A. Chen Y. Nadeem M. A. Jin R. J. Phys. Chem. C. 2016;120:17205–17213. doi: 10.1021/acs.jpcc.6b04695. [DOI] [Google Scholar]
- Sabir M. Rafiq K. Abid M. Z. Quyyum U. Shah S. S. A. Faizan M. Rauf A. Iqbal S. Hussain E. Fuel. 2023;353:129196. doi: 10.1016/j.fuel.2023.129196. [DOI] [Google Scholar]
- Tang D. Shao C. Jiang S. Sun C. Song S. ACS Nano. 2021;15:7208–7215. doi: 10.1021/acsnano.1c00477. [DOI] [PubMed] [Google Scholar]
- Jalil M. Rafiq K. Abid M. Z. Rauf A. Wang S. Iqbal S. Hussain E. Nanoscale Adv. 2023;5:3233–3246. doi: 10.1039/D3NA00148B. [DOI] [PMC free article] [PubMed] [Google Scholar]
- Abid Z. Tanveer A. Rafiq K. Rauf A. Jin R. Hussain E. Nanoscale. 2024;16:7154–7166. doi: 10.1039/D4NR00111G. [DOI] [PubMed] [Google Scholar]
- Jalil M. Rafiq K. Abid M. Z. Rafay M. Rauf A. Jin R. Hussain E. Catal. Sci. Technol. 2024;14:850–862. doi: 10.1039/D3CY01636F. [DOI] [Google Scholar]
- Sohail M. Rauf S. Irfan M. Hayat A. Alghamdi M. M. El-Zahhar A. A. Ghernaout D. Al-Hadeethi Y. Lv W. Nanoscale Adv. 2024;6:1286–1330. doi: 10.1039/D3NA00442B. [DOI] [PMC free article] [PubMed] [Google Scholar]
- Kong Z. Dong J. Yu J. Zhang D. Liu J. Ji X.-Y. Cai P. Pu X. Chem. Eng. J. 2024;496:153960. doi: 10.1016/j.cej.2024.153960. [DOI] [Google Scholar]
- Liu X. Wang S. Cao J. Yu J. Dong J. Zhao Y. Zhao F. Zhang D. Pu X. J. Colloid Interface Sci. 2024;673:463–474. doi: 10.1016/j.jcis.2024.06.106. [DOI] [PubMed] [Google Scholar]
- Yang F. Hu P. Yang F. Hua X.-J. Chen B. Gao L. Wang K.-S. Tungsten. 2024;6:77–113. doi: 10.1007/s42864-023-00229-x. [DOI] [Google Scholar]
- Wu Q. Yang L. Wang X. Hu Z. Acc. Chem. Res. 2017;50:435–444. doi: 10.1021/acs.accounts.6b00541. [DOI] [PubMed] [Google Scholar]
- Abid M. Z. Rafiq K. Rauf A. Althomali R. H. Hussain E. Mater. Adv. 2024;5:2238–2252. doi: 10.1039/D3MA00710C. [DOI] [Google Scholar]
- Abid M. Z. Rafiq K. Aslam A. Jin R. Hussain E. J. Mater. Chem. A. 2024;12:7351–7395. doi: 10.1039/D3TA06548K. [DOI] [Google Scholar]
- Lim K. R. G. Handoko A. D. Nemani S. K. Wyatt B. Jiang H.-Y. Tang J. Anasori B. Seh Z. W. ACS Nano. 2020;14:10834–10864. doi: 10.1021/acsnano.0c05482. [DOI] [PubMed] [Google Scholar]
- Zhang J. Zhang X. Yue W. ACS Appl. Nano Mater. 2022;5:11241–11248. doi: 10.1021/acsanm.2c02365. [DOI] [Google Scholar]
- Yoon Y. Le T. A. Tiwari A. P. Kim I. Barsoum M. W. Lee H. Nanoscale. 2018;10:22429–22438. doi: 10.1039/C8NR06854B. [DOI] [PubMed] [Google Scholar]
- Abbasi N. M. Xiao Y. Peng L. Duo Y. Wang L. Zhang L. Wang B. Zhang H. Adv. Mater. Technol. 2021;6:2001197. doi: 10.1002/admt.202001197. [DOI] [Google Scholar]
- Han H. Jang J. U. Oh D. Na K.-H. Choi W.-Y. Jayakrishnan N. Nayak A. K. Energy Fuels. 2023;37:17708–17735. doi: 10.1021/acs.energyfuels.3c02382. [DOI] [Google Scholar]
- Ganeshan K. Shin Y. K. Osti N. C. Sun Y. Prenger K. Naguib M. Tyagi M. Mamontov E. Jiang D.-e. Van Duin A. C. ACS Appl. Mater. Interfaces. 2020;12:58378–58389. doi: 10.1021/acsami.0c17536. [DOI] [PubMed] [Google Scholar]
- Kagalkar A. and Dharaskar S., Age of MXenes, Volume 4. Applications in Advanced Catalysis and Membrane Processes, 2023, pp. 1–42 [Google Scholar]
- Hussain E. Majeed I. Nadeem M. A. Iqbal A. Chen Y. Choucair M. Jin R. Nadeem M. A. J. Environ. Chem. Eng. 2019;7:102729. doi: 10.1016/j.jece.2018.10.044. [DOI] [Google Scholar]
- Abid M. Z. Ilyas A. Rafiq K. Rauf A. Nadeem M. A. Waseem A. Hussain E. Environ. Sci. Water Res. Technol. 2023;9:2238–2252. doi: 10.1039/D3EW00368J. [DOI] [Google Scholar]
- Parse H. B. Patil I. Kakade B. Swami A. Energy Fuels. 2021;35:17909–17918. doi: 10.1021/acs.energyfuels.1c02486. [DOI] [Google Scholar]
- Du X. Wang J. Jin L. Deng S. Dong Y. Lin S. ACS Appl. Mater. Interfaces. 2022;14:15225–15234. doi: 10.1021/acsami.2c00117. [DOI] [PubMed] [Google Scholar]
- Ming H. Kumar P. Yang W. Fu Y. Ming J. Kwak W.-J. Li L.-J. Sun Y.-k. Zheng J. ACS Sustainable Chem. Eng. 2015;3:3086–3095. doi: 10.1021/acssuschemeng.5b00553. [DOI] [Google Scholar]
- Gao P. Shi H. Ma T. Liang S. Xia Y. Xu Z. Wang S. Min C. Liu L. ACS Appl. Mater. Interfaces. 2021;13:51028–51038. doi: 10.1021/acsami.1c15539. [DOI] [PubMed] [Google Scholar]
- Li Y. Fu R. Duan Z. Zhu C. Fan D. ACS Nano. 2022;16:7486–7502. doi: 10.1021/acsnano.1c10575. [DOI] [PubMed] [Google Scholar]
- Wang Z. Wang F. Hermawan A. Zhu J. Yin S. Funct. Mater. Lett. 2021;14:2151043. doi: 10.1142/S1793604721510437. [DOI] [Google Scholar]
- Abid M. Z. Rafiq K. Rauf A. Ahmad Shah S. S. Jin R. Hussain E. Nanoscale Adv. 2023;5:3247–3259. doi: 10.1039/D3NA00048F. [DOI] [PMC free article] [PubMed] [Google Scholar]
- Shahzad A. Rafiq K. Zeeshan Abid M. Ahmad Khan N. Shoaib Ahmad Shah S. Althomali R. H. Rauf A. Hussain E. J. Catal. 2024;429:115210. doi: 10.1016/j.jcat.2023.115210. [DOI] [Google Scholar]
- Shevchuk K. Sarycheva A. Shuck C. E. Gogotsi Y. Chem. Mater. 2023;35:8239–8247. doi: 10.1021/acs.chemmater.3c01742. [DOI] [Google Scholar]
- VahidMohammadi A. Rosen J. Gogotsi Y. Science. 2021;372:eabf1581. doi: 10.1126/science.abf1581. [DOI] [PubMed] [Google Scholar]
- Cazzaniga M. Micciarelli M. Gabas F. Finocchi F. Ceotto M. J. Phys. Chem. C. 2022;126:12060–12073. doi: 10.1021/acs.jpcc.2c02137. [DOI] [PMC free article] [PubMed] [Google Scholar]
- Marais C. Bunt J. R. Leokaoke N. T. Uwaoma R. C. Neomagus H. W. Energy Fuels. 2023;37:5905–5916. doi: 10.1021/acs.energyfuels.3c00514. [DOI] [Google Scholar]
- Yao L. Tian X. Cui X. Zhao R. Xiao X. Wang Y. J. Mater. Sci.: Mater. Electron. 2021;32:27837–27848. doi: 10.1007/s10854-021-07166-w. [DOI] [Google Scholar]
- Liu R. Li W. ACS Omega. 2018;3:2609–2617. doi: 10.1021/acsomega.7b02001. [DOI] [PMC free article] [PubMed] [Google Scholar]
- Aslam A. Abid M. Z. Rafiq K. Rauf A. Hussain E. Sci. Rep. 2023;13:6306. doi: 10.1038/s41598-023-33185-0. [DOI] [PMC free article] [PubMed] [Google Scholar]
- Anayee M. Shuck C. E. Shekhirev M. Goad A. Wang R. Gogotsi Y. Chem. Mater. 2022;34:9589–9600. doi: 10.1021/acs.chemmater.2c02194. [DOI] [Google Scholar]
- Eid K. Lu Q. Abdel-Azeim S. Soliman A. Abdullah A. M. Abdelgwad A. M. Forbes R. P. Ozoemena K. I. Varma R. S. Shibl M. F. J. Mater. Chem. A. 2022;10:1965–1975. doi: 10.1039/D1TA09471H. [DOI] [Google Scholar]
- Navjyoti V. S. Bhullar V. Saxena V. Debnath A. K. Mahajan A. Langmuir. 2023;39:2995–3005. doi: 10.1021/acs.langmuir.2c02845. [DOI] [PubMed] [Google Scholar]
- Huang H. Song Y. Li N. Chen D. Xu Q. Li H. He J. Lu J. Appl. Catal., B. 2019;251:154–161. doi: 10.1016/j.apcatb.2019.03.066. [DOI] [Google Scholar]
- Wajid N. Rafiq K. Abid M. Z. Ilyas A. Najam T. Rauf A. Hussain E. Mater. Chem. Phys. 2023;306:128062. doi: 10.1016/j.matchemphys.2023.128062. [DOI] [Google Scholar]
- Sahar K. U. Rafiq K. Abid M. Z. ur Rehman U. Rauf A. Hussain E. React. Chem. Eng. 2023;8:2522–2536. doi: 10.1039/D3RE00238A. [DOI] [Google Scholar]
- Yang Z. Yang P. Zhang X. Yin H. Yu F. Ma J. Chem. Mater. 2023;35:2069–2077. doi: 10.1021/acs.chemmater.2c03618. [DOI] [Google Scholar]
- Sun Z. Yuan M. Lin L. Yang H. Nan C. Li H. Sun G. Yang X. ACS Mater. Lett. 2019;1:628–632. doi: 10.1021/acsmaterialslett.9b00390. [DOI] [Google Scholar]
- Hu T. Li Z. Hu M. Wang J. Hu Q. Li Q. Wang X. J. Phys. Chem. C. 2017;121:19254–19261. doi: 10.1021/acs.jpcc.7b05675. [DOI] [Google Scholar]
- Zheng R. Shu C. Hou Z. Hu A. Hei P. Yang T. Li J. Liang R. Long J. ACS Appl. Mater. Interfaces. 2019;11:46696–46704. doi: 10.1021/acsami.9b14783. [DOI] [PubMed] [Google Scholar]
- Lemos H. G. Ronchi R. M. Portugal G. R. Rossato J. H. H. Selopal G. S. Barba D. Venancio E. C. Rosei F. Arantes J. T. Santos S. F. ACS Appl. Energy Mater. 2022;5:15928–15938. doi: 10.1021/acsaem.2c03474. [DOI] [Google Scholar]
- Hou T. Li Q. Zhang Y. Zhu W. Yu K. Wang S. Xu Q. Liang S. Wang L. Appl. Catal., B. 2020;273:119072. doi: 10.1016/j.apcatb.2020.119072. [DOI] [Google Scholar]
- Huang J. Dong N. McEvoy N. Wang L. Coileáin C. Ó. Wang H. Cullen C. P. Chen C. Zhang S. Zhang L. Wang J. ACS Nano. 2019;13:13390–13402. doi: 10.1021/acsnano.9b06782. [DOI] [PubMed] [Google Scholar]
- Tan D. Sun N. Chen L. Bu J. Jiang C. ACS Appl. Nano Mater. 2022;5:1034–1046. doi: 10.1021/acsanm.1c03696. [DOI] [Google Scholar]
- Tian F. Pang Z. Wang F. Nie W. Zhang X. Chen S. Xu J. Li G. Chen C. Xu Q. Zhao Y. Ji L. Zou X. Lu X. ACS Sustainable Chem. Eng. 2023;11:17320–17330. doi: 10.1021/acssuschemeng.3c04755. [DOI] [Google Scholar]
- Ozawa K. Yamamoto S. Yukawa R. Liu R. Emori M. Inoue K. Higuchi T. Sakama H. Mase K. Matsuda I. J. Phys. Chem. C. 2016;120:29283–29289. doi: 10.1021/acs.jpcc.6b10136. [DOI] [Google Scholar]
- Wang X.-D. Huang Y.-H. Liao J.-F. Jiang Y. Zhou L. Zhang X.-Y. Chen H.-Y. Kuang D.-B. J. Am. Chem. Soc. 2019;141:13434–13441. doi: 10.1021/jacs.9b04482. [DOI] [PubMed] [Google Scholar]
- Liu H. Chen K. Feng Y.-N. Zhuang Z. Chen F.-F. Yu Y. J. Phys. Chem. C. 2023;127:5289–5298. doi: 10.1021/acs.jpcc.2c08369. [DOI] [Google Scholar]
- Munisha B. Patra L. Nanda J. Pandey R. Brahma S. S. ACS Appl. Nano Mater. 2023;6:20539–20555. doi: 10.1021/acsanm.3c02156. [DOI] [Google Scholar]
- Tan Q. Yu Z. Long R. He N. Huang Y. Liu Y. Opt. Mater. 2022;131:112685. doi: 10.1016/j.optmat.2022.112685. [DOI] [Google Scholar]
- Shao B. Liu Z. Zeng G. Liu Y. Liang Q. He Q. Wu T. Pan Y. Huang J. Peng Z. Luo S. Liang C. Liu X. Tong S. Liang J. Appl. Catal., B. 2021;286:119867. doi: 10.1016/j.apcatb.2020.119867. [DOI] [Google Scholar]
- Yermakov A. Y. Galakhov V. R. Minin A. S. Mesilov V. V. Uimin M. A. Kuepper K. Bartkowski S. Molochnikov L. S. Konev A. S. Gaviko V. S. Zakharova G. S. Phys. Status Solidi B. 2021;258:2000399. doi: 10.1002/pssb.202000399. [DOI] [Google Scholar]
- Tahir M. Tahir B. Ind. Eng. Chem. Res. 2020;59:9841–9857. doi: 10.1021/acs.iecr.0c00193. [DOI] [Google Scholar]
- Chen R. Cheng Y. Wang P. Wang Y. Wang Q. Yang Z. Tang C. Xiang S. Luo S. Huang S. Su C. Chem. Eng. J. 2021;421:129682. doi: 10.1016/j.cej.2021.129682. [DOI] [Google Scholar]
- Peng C. Wei P. Li X. Liu Y. Cao Y. Wang H. Yu H. Peng F. Zhang L. Zhang B. Lv K. Nano Energy. 2018;53:97–107. doi: 10.1016/j.nanoen.2018.08.040. [DOI] [Google Scholar]
- Liu J. Kong X. Li Y. Zhu S. Liang Y. Li Z. Wu S. Chang C. Cui Z. Yang X. Appl. Surf. Sci. 2020;530:147283. doi: 10.1016/j.apsusc.2020.147283. [DOI] [Google Scholar]
- Fang Y. Liu Z. Han J. Jin Z. Han Y. Wang F. Niu Y. Wu Y. Xu Y. Adv. Energy Mater. 2019;9:1803406. doi: 10.1002/aenm.201803406. [DOI] [Google Scholar]
- Abid M. Z. Rafiq K. Rauf A. Althomali R. H. Jin R. Hussain E. Renew. Energy. 2024:120223. doi: 10.1016/j.renene.2024.120223. [DOI] [Google Scholar]
- Sun Y. Lee J. Kwon N. H. Lim J. Jin X. Gogotsi Y. Hwang S.-J. ACS Nano. 2024;18:6243–6255. doi: 10.1021/acsnano.3c09640. [DOI] [PubMed] [Google Scholar]
- Agresti A. Pazniak A. Pescetelli S. Di Vito A. Rossi D. Pecchia A. Auf der Maur M. Liedl A. Larciprete R. Kuznetsov D. V. Saranin D. Di Carlo A. Nat. Mater. 2019;18:1228–1234. doi: 10.1038/s41563-019-0478-1. [DOI] [PubMed] [Google Scholar]
- Yang L. Liu W. Hang T. Wu L. Yang X. Sol. RRL. 2024;8:2300691. doi: 10.1002/solr.202300691. [DOI] [Google Scholar]
- Wang H. Wu Y. Xiao T. Yuan X. Zeng G. Tu W. Wu S. Lee H. Y. Tan Y. Z. Chew J. W. Appl. Catal., B. 2018;233:213–225. doi: 10.1016/j.apcatb.2018.04.012. [DOI] [Google Scholar]
- Pang J. Mendes R. G. Bachmatiuk A. Zhao L. Ta H. Q. Gemming T. Liu H. Liu Z. Rummeli M. H. Chem. Soc. Rev. 2019;48:72–133. doi: 10.1039/C8CS00324F. [DOI] [PubMed] [Google Scholar]
- Song H. Jiang D.-e. Nanoscale. 2023;15:16010–16015. doi: 10.1039/D3NR02538A. [DOI] [PubMed] [Google Scholar]
- Johnson D. Lai H.-E. Hansen K. Balbuena P. B. Djire A. Nanoscale. 2022;14:5068–5078. doi: 10.1039/D2NR00222A. [DOI] [PubMed] [Google Scholar]
Associated Data
This section collects any data citations, data availability statements, or supplementary materials included in this article.
Supplementary Materials
Data Availability Statement
The data and necessary protocols of this study have been included as part of the ESI.†


