Abstract
Synthetic dyes, such as Alizarin Red S, contribute significantly to environmental pollution. This study investigates the biosorption potential of Alhagi maurorum biosorbent for the removal of Alizarin Red S (ARS) from aqueous solutions. Fourier transform infrared spectroscopy (FTIR) was used to analyze the biosorbent’s adsorption sites. Various parameters were optimized to maximize dye adsorption. An optimal removal efficiency of 82.26% was attained by employing 0.9 g of biosorbent with a 25 ppm dye concentration at pH 6 and 60 °C over 30 min. The data were modeled using various isothermal and kinetic models to understand the adsorption behavior. Thermodynamic parameters indicated that the adsorption process was spontaneous and endothermic. The pseudo-second-order kinetic model best described the data, indicating chemisorption as the rate-limiting step. The data matched best to the Langmuir model, indicating that the adsorption occurs as a monolayer on uniform surfaces with a finite number of binding sites. The model showed a strong correlation (R² = 0.991) and a maximum adsorption capacity (qmax) of 8.203 mg/g. Principal component analysis (PCA) identified temperature as the dominant factor, with the primary component, PC1 capturing 100% of its effect. The mechanisms involved in ARS biosorption on A. maurorum include electrostatic interactions, hydrogen bonding, hydrophobic interactions, dipole-dipole interactions, and π-π stacking. Alhagi maurorum showed promising potential for biosorbing toxic dyes from contaminated water, suggesting further investigation for practical applications.
Supplementary Information
The online version contains supplementary material available at 10.1186/s12896-024-00913-x.
Keywords: Alhagi maurorum, Alizarin Red S, Biosorption, Endothermic process, Free energy, Principal component analysis
Introduction
The rapid pace of industrialization and urbanization has significantly contributed to environmental pollution, with wastewater from industries being one of the major sources of contamination. Among the various pollutants, synthetic dyes have emerged as a significant environmental concern. Dyes are chemical compounds utilized in aqueous solutions to impart color to various objects. Today, dyes are integral to numerous industries including textiles, paint and pigments, food packaging, leather tanning, paper production, and electroplating [1, 2]. However, their extensive use has led to severe environmental and health impacts due to their persistence in natural ecosystems.
The application of natural dyes is restricted as they predominantly color natural fibers such as wool, hemp, and rayon, a limitation that has steered the world towards synthetic dyes [3]. The environmental impact of dyes, particularly synthetic ones like Alizarin Red S, is profound. Synthetic dyes are often non-biodegradable and can persist in the environment for an extended period [4]. The colored water, when discharged into water bodies, they not only affect the aesthetic quality of the water but also reduce light penetration [5], and disrupting the aquatic ecosystems [6]. Moreover, these dyes can be toxic, carcinogenic, or mutagenic, posing serious health risks to humans and aquatic life [7, 8].
Current methods of dye removal from wastewater primarily include physical, chemical, and biological processes [9]. Conventional methods such as coagulation- flocculation [10], chemical oxidation [11], and adsorption using activated carbon [12, 13] have been extensively employed. However, these methods often suffer from limitations such as high operational costs, the generation of secondary pollutants, and incomplete dye removal [14]. For instance, while activated carbon is effective, it is expensive and requires regeneration, which is both energy-intensive and costly [15–17]. The chemical stability and poor biodegradability of these dyes render standard biological wastewater treatments ineffective [5]. In contrast, biosorption has emerged as a promising alternative for dye removal, offering several advantages over conventional methods. Biosorption involves the use of biological materials, often derived from agricultural waste, to adsorb and remove contaminants from wastewater [18]. This method is not only cost-effective but also environmentally friendly, as it utilizes renewable resources and generates minimal secondary waste. Biosorption is a passive process that doesn’t require energy [19]. Additionally, biosorbents can be regenerated and reused, making the process sustainable [20].
The use of biosorbents derived from plants is particularly appealing due to their abundance, low cost, and high efficiency in removing dyes [21]. Alhagi maurorum, commonly known as camel thorn [22], is a plant that has recently gained attention for its potential use as an adsorbent [23]. This plant, belonging to the leguminous family, is naturally abundant in arid and semi-arid regions [24]. Its robust structure and the presence of functional groups on its surface [25, 26], make it a suitable candidate for dye adsorption. The selection of A. maurorum as a biosorbent in this study is driven by its availability, low cost, and promising adsorption properties. The plant’s natural abundance in desert regions makes it an eco-friendly and sustainable option for large-scale wastewater treatment [27]. Moreover, its ability to adsorb Alizarin Red S, a widely used anthraquinone dye, underscores its potential in treating industrial effluents. The effectiveness of contaminant removal by sorbents is influenced by kinetic equilibrium and the composition of the sorbent’s cellular surface. This innovative and cost-effective technology is adept at purifying wastewaters contaminated with dyes [28].
This research focused on evaluating Alhagi maurorum as an innovative biosorbent for the removal of Alizarin dye from aqueous solutions. Although many biosorbents have been studied extensively, this investigation is the first to thoroughly assess A. maurorum for this purpose. Given its widespread availability and natural abundance, A. maurorum presents a viable option for eco-friendly wastewater treatment. The study meticulously examined how factors such as pH, biosorbent dosage, initial dye concentration, and temperature influence adsorption efficiency. These optimization efforts are vital for assessing the practical utility of this species in real-world applications. By applying Langmuir, Freundlich, and Temkin isotherm models to the adsorption data, the research offers an in-depth analysis of the adsorption mechanisms involved. This comparative modeling is key for determining the most accurate model to predict adsorption behavior, which is critical for scaling up the process. The research also included kinetic and thermodynamic studies to further elucidate the adsorption mechanisms and efficiency. Additionally, principal component analysis (PCA) was used to identify the primary variables influencing the adsorption process, thereby simplifying and enhancing data interpretation and providing deeper insights into the factors that govern contaminant removal [29]. The findings from this study have the potential to advance the field of wastewater treatment by introducing a cost-effective and efficient biosorbent. The application of A. maurorum could pave the way for developing sustainable and environmentally friendly treatment technologies, contributing to broader efforts in environmental protection and resource conservation. Furthermore, utilization of this species as a biosorbent not only broadens the range of materials available for dye removal but also emphasizes the potential of desert plants in environmental remediation.
Materials and methods
Stock solution of dye (1000 ppm)
One gram of Alizarin Red S (ARS) dye was dissolved in a suitable quantity of distilled water. The resulting solution was then transferred to a volumetric flask, and its volume was increased to 1000 mL with additional distilled water. This prepared solution served as the basis for creating the standard solutions.
Standard solutions
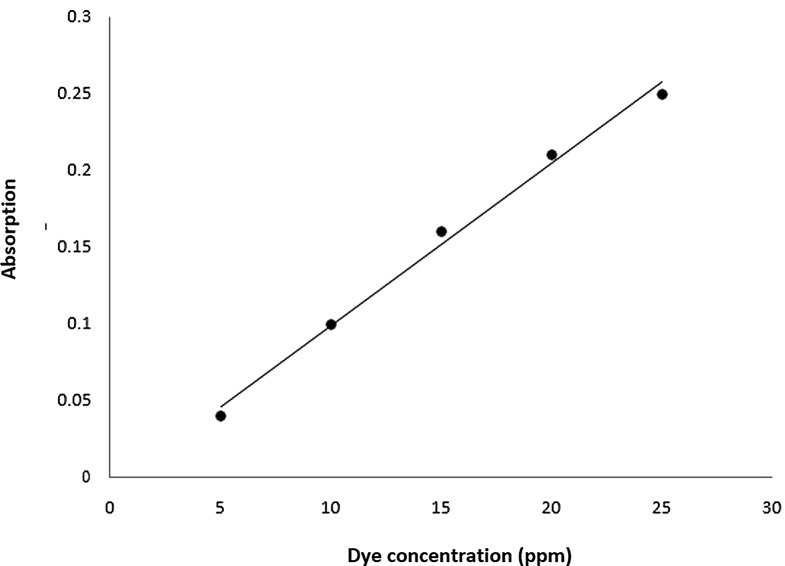
Different concentrations of dye solutions, specifically 5, 10, 15, 20, and 25 ppm, were prepared using the mentioned stock solution. By mixing 0.5, 1.0, 1.5, 2.0, and 2.5 mL of the stock solution with 100 mL of distilled water, these different concentrations were achieved. Absorbance levels were recorded using a spectrophotometer at 423 nm, which helped construct a calibration curve for ARS based on its absorption (see Fig. 1).
Fig. 1.
Calibration line for ARS dye concentration (ppm) against the absorbance
Preparation and characterization of biosorbent
In this work, Alhagi maurorum is a deciduous desert shrub flowering in July [30], collected from the Cholistan desert, Pakistan. Alhagi maurorum is generally used in folks. After extracting the medicinal ingredients from this species, the waste material was washed with water and air-dried. After drying, the biomass was treated with methanol extraction. After extraction, the biomass was dried in an oven and ground into powder form (the biosorbent).
The biosorbent was characterized via the scanning electron microscopy (SEM) and Fourier transform infrared spectroscopy (FTIR) method using a JEOL JSM-6610LV Scanning Electron Microscope and PerkinElmer Spectrum IR 10.7.2, Waltham, Massachusetts, United States. These provide the surface morphology of the biosorbent and functional groups taking part in the biosorption of the ARS dye.
Determination of adsorption efficiency of Alhagi maurorum
A range of solutions with concentrations from 10 to 100 ppm were concocted. In each flask, 50 mL of these solutions was mixed with 0.9 g of the biosorbent. The flasks were then shaken at 150 rpm for 30 min on an orbital shaker. Subsequently, the filtrate was analyzed using UV/Vis spectrophotometry at a wavelength of 423 nm. Next, filter paper was used to filter the solutions, and their absorbance levels were measured. The final dye concentration was determined using Beer–Lambert’s law. The quantity of dye adsorbed onto the adsorbent’s surface, denoted as Qe (mg/g), was calculated according to the method mentioned in the previous literature by E Voudrias, K Fytianos and E Bozani [31].
Optimization of biosorption potential using various parameters
To evaluate the biosorption potential of Alhagi maurorum, several parameters were assessed. The dye removal efficiency and the amount of ARS adsorbent one the sorbent (q) was determined using the following equations (Eq. 1 and Eq. 2, respectively) [32]:
 |
1 |
 |
2 |
Where removal (%) is the decolorization efficiency of the dye, Ci (ppm) is the initial dye concentration of the system, Ce (ppm) is the final dye concentration of the system after a given time. V is the volume of the ARS solution (L), and W is the biosorbent’s weight used (g). The absorbance was measured at 423 nm.
Biosorbent dose
To make a 25 ppm solution of dye, 12.5mL was taken from a 1000 ppm solution, and the volume was up to 500 mL. The 50 mL of 25 ppm solution was taken in 9 flasks. In each flask, 0.1 g, 0.2 g, 0.3 g, 0.4 g, 0.5 g, 0.6 g, 0.7 g, 0.8 g, and 0.9 g biomass were added. These flasks were placed in an orbital shaker for 30 min at 150 rpm. Afterward, the reaction contents of all the flasks were filtered to remove the adsorbent. These filtrates were analyzed by using the spectrophotometer at 423 nm. Percentage removal efficiencies and q for all the filtrates were calculated using Eqs. 1 and 2.
Contact time
The effect of dye contact time and biosorbent was investigated using the 25 ppm solution of dye. The 50 mL of 25 ppm solution was taken in 9 flasks. Each flask was placed on an orbital shaker for agitation. Biosorbent dose of 0.9 g was added in each flask. The first flask was given a contact time of 5 min. After 5 min, the first flask was removed from the shaker. After 10 min, another flask was taken off. Similarly, each flask was taken out after a 5-minute time gap difference of 45 min. The reaction contents were filtered to remove the biosorbents. Filtrate was subjected to spectrophotometric to determine the absorbance. Percentage removal efficiencies and ‘q’ for all the filtrates were calculated using Eqs. 1 and 2.
pH
The 2.5 mL dye stock solution (1000 ppm) was taken in 9 flasks. In these flasks, an appropriate amount of distilled water was added and pH was adjusted at 1, 2, 3, 4, 5, 6, 7, 8, and 9 by the addition of either NaOH (0.1 M) or HCl (0.1 M). After adjusting pH, the volumetric flasks were brought up to the mark (100 mL). The 50 mL of each pH solution was out in other flasks and placed on an orbital shaker for shaking. In each flask, 0.9 g biosorbent was agitated for 30 min. After agitation, the solutions were filtered out and analyzed via a spectrophotometer for absorption. Percentage removal efficiencies and ‘qe’ for all the filtrates were calculated using Eqs. 1 and 2.
Temperature
The effect of temperature was studied by using 25 ppm solution of a dye prepared from stock solution (1000 ppm). The 50 mL of 25 ppm solution was taken in 6 flasks. The temperature of each flask was maintained at 10, 20, 30, 40, 50 and 60˚C, respectively. The 0.9 g of biosorbent was added to each flask and agitated for 30 min. After agitation, the solutions were filtered, and the filtrate was analyzed by spectrophotometer. Percentage removal efficiencies and q for all the filtrates were calculated using Eqs. 1 and 2.
Modeling of biosorption process
The data obtained from biosorption was subjected to various mathematical models for evaluation of results.
Equilibrium modeling
In ten flasks, 50 mL solutions of varying concentrations of dyes ranging from 10 to 100 ppm were prepared by taking 1, 2, 3, 4, 5, 6, 7, 8, 9, and 10 mL, respectively, from the dye stock solution and diluting them up to 100 mL. The optimum amount of biosorbent (0.9 g) was added to each flask and allowed to shake for 30 min. After shaking, the solution was filtered, and the filtrate was analyzed by spectrophotometer. The q for all the filtrates were calculated using Eq. 2. The experimental data were fitted to several equilibrium models, including Langmuir (Eq. 3), Freundlich (Eq. 4), and Temkin (Eq. 5), to better understand the adsorption mechanisms [8, 33]:
 |
3 |
 |
4 |
 |
5 |
Where q represents the amount of dye adsorbed on the biosorbent at equilibrium (mg/g), qmax is the maximum adsorption capacity of the biosorbent (mg/g), b is the Langmuir constant related to the affinity of binding sites (L/mg), KF is the Freundlich constant indicating adsorption capacity (L/g), n is a dimensionless constant indicative of adsorption favorability, KT is the Temkin constant (L/g), and BT is a constant related to the heat of adsorption (J/mol).
Kinetic modeling
The biosorption process kinetics were investigated using a consistent volume (50 mL) of dye solution at 25 ppm concentration. Nine flasks were prepared, each containing a set amount of biosorbent (0.6 g). These flasks were placed on orbital shakers for varying periods, specifically 5, 10, 15, 20, 25, 30, 35, 40, and 45 min. Following the agitation period, the solutions in the flasks were filtered, and the resulting filtrate was analyzed using a spectrophotometer. The ‘q’ for all the filtrates were calculated using Eq. 2. The experimental data were analyzed using two kinetic models: the pseudo-first-order (Eq. 6) and pseudo-second-order (Eq. 7) models [34]:
 |
6 |
 |
7 |
where qt is the amount of dye adsorbed at time t; K1 and K2 are the rate constants for the pseudo-first-order and pseudo-second-order models, respectively. The fitting of these models to the experimental data was assessed to gain a deeper understanding of the biosorption kinetics, providing insights into the rate and mechanism of dye uptake by the biosorbent.
Thermodynamic modeling
To investigate the thermodynamic properties of the adsorption process, 50 mL of a 25 ppm ARS dye solution was prepared in six separate flasks. These flasks were maintained at temperatures of 10 °C, 20 °C, 30 °C, 40 °C, 50 °C, and 60 °C, respectively. A biosorbent dose of 0.6 g of Alhagi maurorum was added to each flask, and the mixtures were agitated for 30 min. Afterward, the mixtures were filtered, and the filtrates were analyzed using a spectrophotometer to determine the dye concentrations, and the q for all the filtrates were calculated using Eq. 2.
From the resulting data, key thermodynamic parameters were calculated, including Gibb’s free energy (ΔG˚), standard enthalpy change (ΔH˚), and standard entropy change (ΔS˚). The ΔG˚ was determined using Eq. 8, while ΔH˚ and ΔS˚ were derived from the slope and intercept of the linear plot of ln Kc versus 1/T using Eq. 9 [34].
 |
8 |
 |
9 |
In these equations, R represents the universal gas constant (8.314 J/mol·K), and KC is the distribution coefficient, calculated using Eq. 10 [35, 36].
 |
10 |
where qe is the equilibrium concentration of ARS adsorbed onto the Alhagi maurorum biosorbent (mg/g), and Ce is the equilibrium concentration of the dye in solution (ppm).
Statistical analysis (PCA)
Principal component analysis (PCA) and correlation assessment were performed at a significance level of α = 0.05, following established biological methodologies. The statistical evaluations were conducted using Statistica software (version 12.0, StatSoft Inc., Tulsa, OK, USA). The PCA data matrix, formulated for the statistical analysis of the experimental findings, comprised 5 columns and 9 rows to evaluate the effects of biosorbent dose, contact time, and pH. Additionally, it included 4 columns and 6 rows to assess the impact of temperature. Determining the most suitable quantity of principal components was predicated upon the Cattell criterion. The input matrix underwent a process of automatic scaling, wherein it was subjected to a transformation that adjusted its values proportionally to maintain relative relationships between the elements within the matrix. PCA and correlation analysis were again conducted at a significance level of α = 0.05, employing the Statistica software for all statistical calculations. The configuration of the PCA data matrix was customized to accommodate the particular parameters under examination, with an appropriate allocation of columns and rows for each variable. The optimal number of principal components was determined by the Cattell criterion, whereby the input matrix was automatically scaled.
Results and discussion
Characterization of Alhagi maurorum biosorbent
FTIR results of the biosorbent
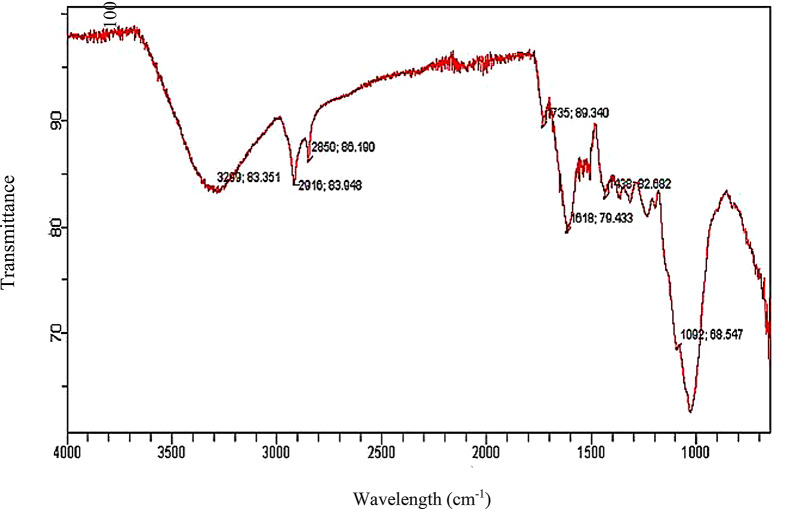
The ground and dried biomass underwent solid-phase FTIR analysis to identify functional groups for characterization. The FTIR analysis of the Alhagi maurorum biosorbent revealed several significant functional groups that are critical for its binding capability with the dye (Fig. 2). The broad peak observed at 3299 cm⁻¹ is indicative of the presence of hydroxyl (–OH) groups. These groups are known for their strong hydrogen bonding potential [37, 38], which can contribute to the adsorption process. Additionally, peaks at 1735 cm⁻¹, 1618 cm⁻¹, 1432 cm⁻¹, and 1092 cm⁻¹ suggest the presence of carboxylate groups (C = O stretching of esters), C = C stretching of α,β-unsaturated ketone, O-H bending of carboxylic acid and C-N stretching of amine on the biosorbent surface. These groups can interact electrostatically with cationic dye molecules, enhancing the adsorption efficiency. The bands at 2850 cm⁻¹ and 2916 cm⁻¹, which correspond to C–H stretching vibrations (fall within the 2800 to 3000 cm⁻¹), further confirm the presence of alkyl chains in the biosorbent, which contribute to weak Van der Waals forces [39]between the dye molecules and the biosorbent surface.
Fig. 2.
Functional group spectrum by FTIR of Alhagi maurorum
These alkyl chains can contribute to the adsorption process through van der Waals interactions and weak hydrogen bonding [40]. In summary, the FTIR spectrum provided evidence of various functional groups on the Alhagi maurorum biosorbent, including hydroxyl, carboxylate, and alkyl groups. These groups collectively enhance the biosorbent’s ability to adsorb dye molecules through hydrogen bonding, electrostatic attraction, and van der Waals interactions, making it a promising material for dye removal from aqueous solutions.
SEM image of the Alhagi maurorum biosorbent
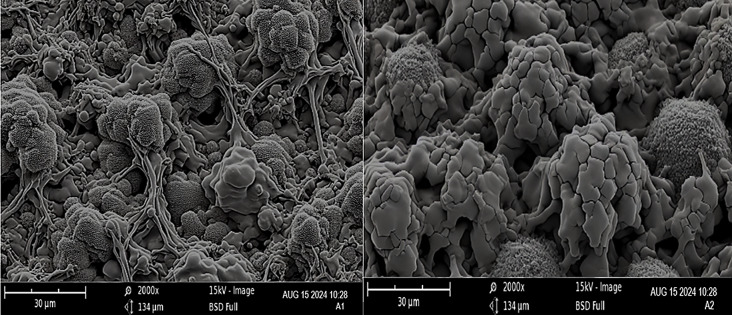
The SEM image of the Alhagi maurorum powdered biosorbent before adsorption (Fig. 3A) reveals a highly irregular and porous surface, characteristic of plant-derived biosorbents. The rough texture and visible fibrous structures are indicative of the biosorbent’s natural cellular composition. These surface features are essential as they contribute to the material’s high surface area, which is crucial for efficient adsorption processes [41]. The visible pores and cavities in the biosorbent provide accessible sites [42] for dye molecules to attach, highlighting the potential of A. maurorum as an effective biosorbent.
Fig. 3.
SEM Analysis of Alhagi maurorum biosorbent before and after biosorption
The SEM image after adsorption (Fig. 3B) shows noticeable changes in the biosorbent’s surface morphology. The surface appears smoother, with a thin layer seemingly covering the previously exposed fibrous structures. This alteration is likely due to the biosorption of ARS dye, which has adhered to the biosorbent surface, partially filling or covering the pores and cavities. The reduction in visible pores suggested that the dye molecules have successfully penetrated the biosorbent’s surface, occupying the available adsorption sites. The smoother surface texture further confirms the accumulation of dye on the biosorbent. These findings highlight the potential of this biosorbent for environmental remediation efforts, particularly in the removal of hazardous dyes from wastewater.
Optimization of biosorption potential using different parameters
The investigation meticulously examined the impact of various parameters, including adsorbent dose, contact time, pH, and temperature, on eliminating ARS during batch adsorption processes. The investigation focused on examining the results and equilibrium adsorption capacity of Alhagi maurorum, a species of interest in the field of biology.
Effect of biosorbent dose
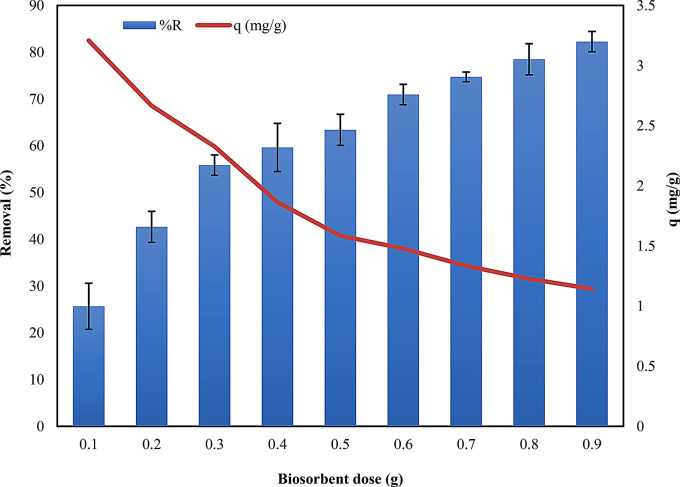
The biosorbent dose (0.1–0.9 g) effect on removing ARS at an initial concentration of 25 ppm was investigated at 30 min contact time and the real pH of the adsorbate solution. The study found that increasing the biosorbent dose led to a higher percentage of dye removal (Fig. 4). In this study, 0.9 g is considered the optimized quantity of biosorbent. Table S1 (see supplementary) and Fig. 4 indicate the minimum removal (%) of dye was 25.660% (at 0.1 g dose), and the maximum removal was 82.264% (at 0.9 g dose). The reason for the continual increase with increasing doses can be attributed to the greater availability of active adsorption sites on the surface of Alhagi maurorum [43].
Fig. 4.
Effect of biosorbent dose in removal (%) of ARS dye on the surface of Alhagi maurorum
The biosorbent’s maximum capacity was 3.207547 mg/g at 0.1 g dose, while its minimum capacity was 1.143 mg/g at 0.9 g. As the quantity of biosorbent was increased, the dye adsorption rate gradually rose, attributed to the aggregation or overlapping of the active sites on the adsorbent; this effect was linked to the reduction or minimization of the total surface area accessible to the dye, leading to a decreased ability of the adsorbent to bind dye molecules as the amount of biosorbent increased [44]. This phenomenon was observed given the fixed volume of dye, resulting in a lower amount of dye sorbed per gram of adsorbent. This behavior is consistent with similar studies on natural adsorbents [45, 46], indicating that an optimal dose exists for maximizing efficiency while minimizing material usage.
Upon conducting PCA analysis, two new variables emerged, with the first two principal components accounting for 100% of the system’s variability. Variables within the two red circles depicted in Fig. S1A (see supplementary) had the most significant impact on system volatility. Absorbance, Ce, q, and removal were identified as having the most substantial influence on system variability. A strong positive correlation was noted among absorbance, Ce, and q, while a strong negative correlation was observed between absorbance, Ce, q, and removal. The PCA analysis demonstrated that the primary component PC1, accounting for 99.44% of the variance, was most influenced by the amount of adsorbent (Fig. S1B). Positive principal values of PC1 were associated with a lower amount of adsorbent values, whereas negative values of PC1 were linked to higher amount of adsorbent values.
3.2.1. Effect of contact time
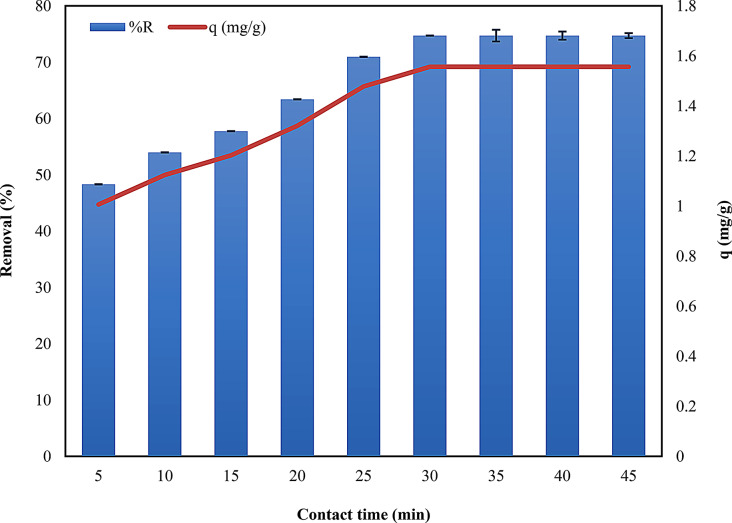
Contact time has a significant effect on the adsorption process. The effects of contact time on dye uptake were studied at an initial concentration of 25 ppm using the optimum dose of 0.9 g. Data exhibited that the uptake of dye by adsorbent increased significantly with an increase in contact time up to a certain extent, and then it became almost constant (Fig. 5). After 30 min, equilibrium was established, and no more dye was removed. The minimum capacity of dye uptake by adsorbent was 1.006 mg/g, whereas the maximum capacity was 1.556 mg/g (Table S2 and Fig. 5). This trend because the adsorption sites were occupied by the available dye more quickly at the initial time. At this stage, the adsorbent concentration was high, and active sites freely available for binding the dye molecule. After a certain time, no more vacant active sites were available for further reactions [47]. This rapid adsorption indicated a high affinity between Alhagi maurorum and Alizarin dye molecules. The overall trend observed in contact time experiments aligns with the behavior of other biosorbents in other studies [48, 49], confirming that adsorption a time-dependent process that requires careful consideration in practical applications to ensure adequate treatment times [50]. Shorter contact times could be applied to reduce the operational costs.
Fig. 5.
Effect of contact time in removal (%) of ARS dye on the surface of Alhagi maurorum
Upon completing the PCA analysis, a new variable emerged, accounting for the entire system’s 100% variability. Every parameter significantly impacted the system’s volatility, as detailed in Table S3. Factors such as absorbance, Ce, q, and removal were identified as having the most substantial influence on the variability of the system. A strong positive correlation was observed between absorbance and ‘Ce’, as well as between ‘q’ and removal. Conversely, a strong negative correlation was noted among absorption, Ce, q, and removal. The PCA analysis further indicated that the primary component, PC1, completely accounted for the scenario involving the amount of Adsorbent (100%), as seen in Table S4. The positive values of the main component, PC1, corresponded to the outcomes from the lowest Contact time values. In contrast, the negative values of PC1 were associated with progressively higher Contact time values, showing no variation at the 30 minute mark.
Effect of pH
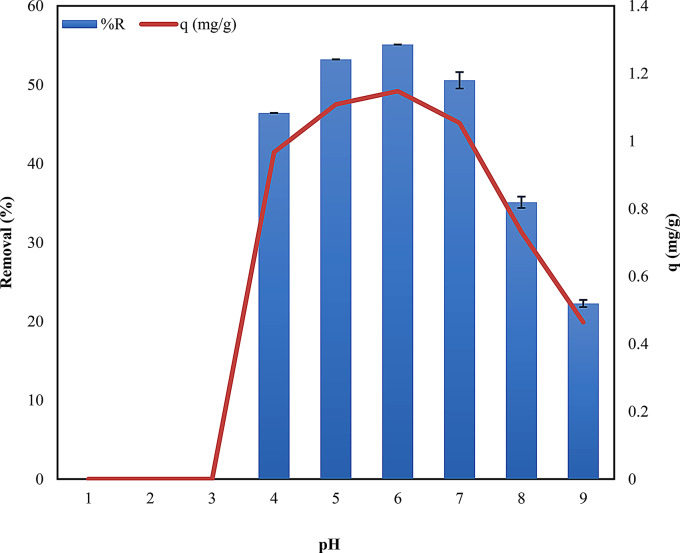
The pH of the adsorbate solution emerged as a pivotal determinant in governing the adsorption of dye on the adsorbent. A series of batch experiments were conducted to investigate the impact of pH on the adsorption process, employing an initial concentration of 25 parts per million (ppm) and 0.9 g biosorbent, which was agitated for 30 min. In an acidic environment (pH 1 to 3), the integrity of the dye’s structure was compromised, resulting in the absence of adsorption (Fig. 6). Following a pH of 3, the dye exhibited a gradual removal process within a slightly acidic environment, specifically within the pH range of 4.0 to 6.0. At lower pH levels (4.0–6.0), the surface of the biosorbent may become more positively charged, which can enhance the attraction between the negatively charged ARS dye molecules and the biosorbent. Conversely, at higher pH values (above pH 6), the surface charge of the biosorbent may become negative, leading to electrostatic repulsion between the dye molecules and the biosorbent, thereby reducing the removal. The study’s findings indicate that pH of 6 was determined to be the optimal condition with a maximum adsorption capacity of 1.147 mg/g (Table S5, Fig. 6) indicating the importance of maintaining optimal pH levels for effective dye removal. The pH-dependent behavior observed in this study is consistent with existing literature [51–53], with an optimum pH of 6 achieved for dye removal using other plant-based adsorbents. This highlights the importance of pH in optimizing adsorption processes for various contaminants.
Fig. 6.
pH effect in removal (%) of ARS dye on the surface of Alhagi maurorum
Performing the PCA analysis allowed 2 new variables; the first two principal components described the 100% variability of the system. The parameters contained between the two red circles have the greatest impact on its volatility (Fig. S2A). Absorbance, Ce, q, and removal have the greatest influence on system variability. A strong positive correlation was observed between ‘Absorbance and Ce’ and between ‘q and removal’. Conversely, no significant correlation was observed between Absorbance, Ce, and the relationship between ‘q’ and removal. The PCA analysis revealed that the first principal component, PC1, accounted for 78.21% of the system’s variability concerning pH value, as shown in Fig. S2B. The positive values of PC1 were associated with lower pH values up to 3.0, while its negative values corresponded to higher pH ranges (4 to 9). Meanwhile, PC2 contributed to 21.79% of the system’s variability. The positive aspects of the PC2 principal component were indicated of lower pH values (4 to 7) and showed a correlation with q and removal. In contrast, the negative aspects of PC2 were related to higher pH values (8.0 to 9.0) and were linked with absorption Ce.
Effect of temperature
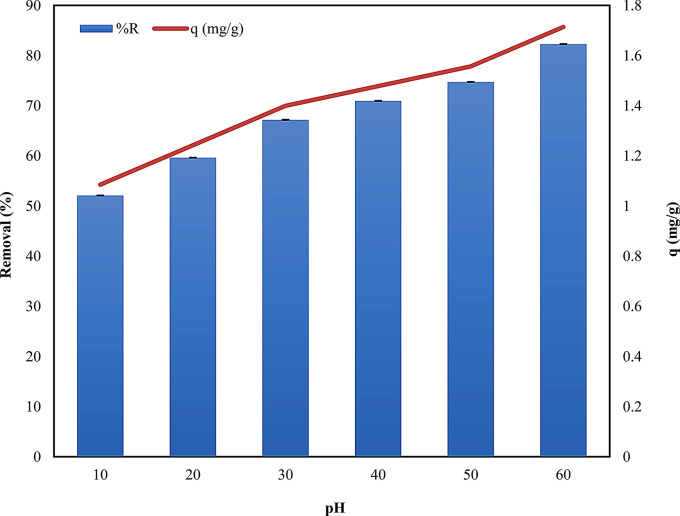
The role of temperature in adsorption and the thermodynamic modeling of adsorption data is of utmost significance. The effect of temperature on the adsorption process was evaluated to understand its influence on the efficiency of Alhagi maurorum as a biosorbent. The impact of temperature on dye adsorption on A. maurorum exhibited a notable enhancement as the temperature escalated from 10 to 60 °C (Fig. 7). The adsorption process was found to be endothermic (that is adsorption increased with increasing temperature) [54, 55], with the adsorption capacity increasing from 1.084 mg/g mg/g at 10 °C to 1.713 mg/g at 60 °C (Table S6 and Fig. 7). This increase in adsorption capacity at higher temperatures may be due to increase in mobility of the dye molecules, which enhances their interaction with active sites on the biosorbent surface. Additionally, higher temperatures may cause the pores within the biosorbent to expand, allowing more dye molecules to be adsorbed [56]. This temperature-dependent behavior is consistent with other studies on biosorption [55, 57], where increased temperature typically results in higher adsorption capacities. However, the balance between operational costs and adsorption performance must be carefully evaluated for practical applications.
Fig. 7.
Temperature effect in removal (%) of ARS dye on the surface of Alhagi maurorum
The PCA analysis resulted in the identification of a singular new variable, accounting for the system’s total variability (100%). Each parameter significantly influenced the system’s volatility, as detailed in Table S7. Factors such as Ce, q, and removal were found to have the most pronounced effect on system variability. There was a notable strong positive correlation between q and removal. Conversely, a significant negative correlation was observed between Ce, q, and removal. Furthermore, the PCA analysis demonstrated that the first principal component, PC1, captured the impact of temperature on the system entirely (100%), as indicated in Table S8. The positive values of the PC1 main component corresponded to the outcomes at lower temperature ranges from 10 to 30 °C, whereas the negative values of PC1 were linked to the results at increasing temperature values.
While the results demonstrate the efficacy of Alhagi maurorum as a biosorbent for ARS under controlled laboratory conditions, it is important to consider the complexity of real effluents. The presence of organic and inorganic components in actual wastewater can significantly impact the sorption capacity of the material. These components may compete with dye molecules for available adsorption sites or alter the surface characteristics of the biosorbent, potentially reducing its overall effectiveness. This highlights the need for further studies to assess the performance of A. maurorum in more complex and varied effluent conditions, which is crucial for real-world application.
Modeling of biosorption process
Adsorption isotherms are widely recognized as the primary method for characterizing adsorption. Essentially, an adsorption isotherm represents the amount of adsorbate absorbed onto the adsorbent’s surface. These isotherms are instrumental in determining the specific surface properties of materials, such as pore size, average particle size, evaluating the efficiency and capacity of adsorbents in pollutants removal. Various approaches exist for presenting adsorption isotherms, and different models are employed to elucidate the adsorption mechanism and forecast the adsorbate’s equilibrium distribution. An adsorption isotherm a curve describes the phenomenon of a substance’s release or mobility from the aqueous solution to a solid phase at a constant ‘T’ and ‘pH’. Adsorption isotherms are a basic requirement for analyzing and designing the adsorption systems. This study studied the equilibrium data using three adsorption isotherms: Langmuir, Freundlich, and Temkin isotherm model.
Langmuir model
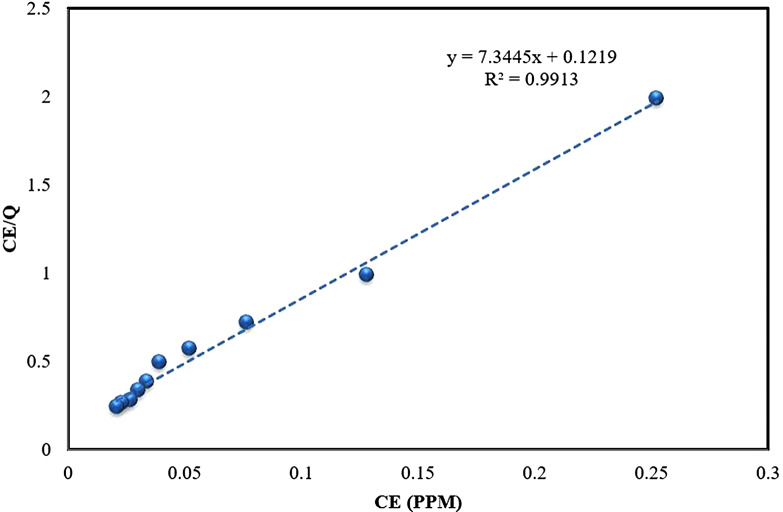
The Langmuir model (Eq. 3), hypothesizes monolayer adsorption onto homogenous surfaces with limited binding sites and no interaction among the adsorbate molecules [58]. This model aptly characterizes the adsorption process. According to the data (Table S9, Fig. 8), the slope and intercept were used to determine the maximum adsorption capacity (qmax) and a constant related to the adsorption’s free energy. Figure 8; Table 1 indicated a strong fit of the Langmuir isotherm model to the adsorption process. The excellent fit of the Langmuir isotherm validates the monolayer adsorption concept [59]. A correlation coefficient (R2) of 0.9913 suggesteds a high-quality adsorption process attributed to the homogeneous distribution of active sites on the Alhagi maurorum surface. This model revealed a maximum adsorption capacity, qmax of 8.203 mg/g. Based on these findings, a single-stage batch biosorption system for dye removal could be designed. This outcome is consistent with studies on other biosorbents, such as Eichhornia crassipes leaves, which effectively removed alizarin yellow and rhodamine B, with the Langmuir model providing a good fit for the equilibrium data [60]. Similar results were found in studies by Safa and Bhatti [61], Sadaf and Bhatti [62], and Akram et al [5], where the Langmuir model best described the adsorption equilibrium data.
Fig. 8.
Langmuir equilibrium plot for the biosorption of ARS onto Alhagi maurorum
Table 1.
Isotherm parameters for the biosorption of ARS onto Alhagi maurorum
| Isotherm | Parameters | Value |
|---|---|---|
| Langmuir | qmax (mg/g) | 8.2034 |
| b (L/mg) | 0.0166 | |
| R2 | 0.9913 | |
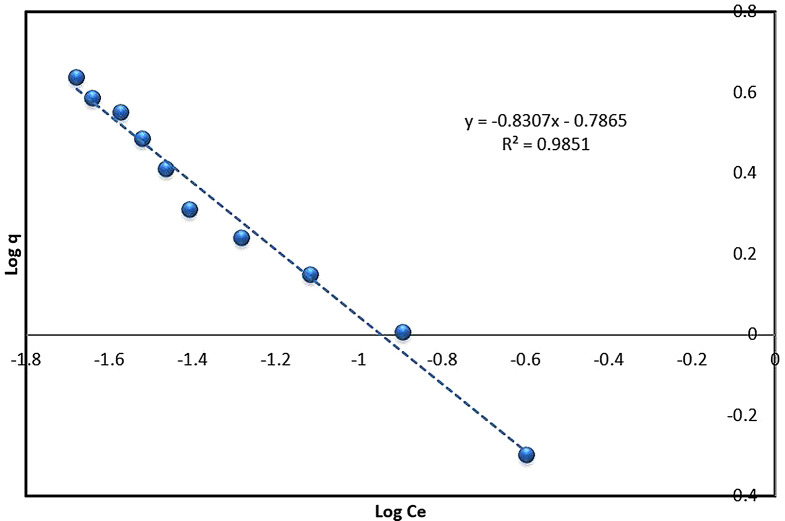
| Freundlich | n | 1.2038 |
| KF (L/g) | 0.1635 | |
| R2 | 0.9851 | |
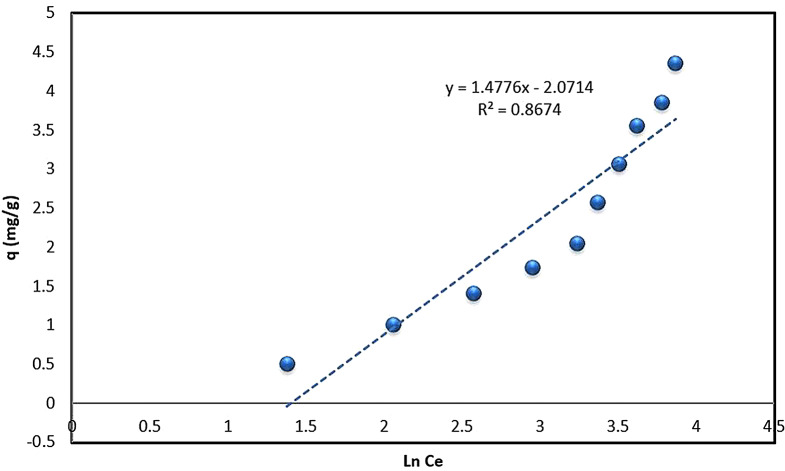
| Temkin | BT (J/mg) | 1.4776 |
| KT | 0.0469 | |
| R2 | 0.8674 |
The PCA analysis resulted in five new variables, with the first two principal components explaining 99.76% of the system’s variability. The parameters within the two red circles (Fig. S3A) influenced most the system’s variability. A strong, positive correlation was observed between parameters 1/q and 1/Ce, which was similarly noted for q, Ce, and removal. Conversely, a negative correlation was found between 1/q, 1/Ce, and q, Ce, removal. The principal component PC1 explained 90.57% of the concentration variability (Fig. S3B). The negative values of PC1 represented low concentrations, while its positive values indicated high concentrations. Parameters 1/q and 1/Ce positively correlated with low concentrations, whereas q, Ce, and removal correlated with high concentrations.
Freundlich model
The equilibrium data in this study were also analyzed using the Freundlich isotherm model (Eq. 4). This model employs an empirical equation suitable for heterogeneous adsorption, reflecting the diversity of adsorption sites [33, 63, 64]. According to the data (Table S10, and Fig. 9) the slope and intercept were used to determine the constant KF, indicative of the relative adsorption capacity, and the factor n (Table 1). The factor n indicates the extent of non-linearity between solution concentration and adsorption [65]. The 𝑛 values ranging between 2 and 10 typically indicate favorable chemical adsorption [66, 67], whereas values from 1 to 2 suggest the moderate adsorption challenges, and values below 1 are associated with weak adsorption efficiency [68]. The correlation coefficient R2 of 0.9851 suggested that the Freundlich model aptly describe the adsorption process. This model’s applicability has been confirmed in several studies, including the adsorption of reactive azo dyes using Citrus sinensis biomass [69] and the removal of Alizarin Yellow and Malachite Green with Calophyllum inophyllum seed husk [70]. Similar adsorption behavior was observed with Polyalthia longifolia composites for Methylene Blue and Alizarin Red S [71] and with Ficus religiosa bark powder for ARS dye removal [72]. Additionally, F Deniz and SD Saygideger [73] reported the successful application of the Langmuir and Temkin models for Acid Orange 52 adsorption onto Paulownia tomentosa leaf powder, which aligns with the results of this study.
Fig. 9.
Freundlich equilibrium model plot for the biosorption of ARS onto Alhagi maurorum
Five novel variables were identified after the PCA analysis, with the initial two principal components accounting for 99.73% of the system’s variability. The parameters situated between two red circles in the analysis significantly influence the system’s variability. A marked and positive correlation was observed among Log q, Log Ce, Ce, q, and removal parameters. The first principal component (PC1) explained 97.27% of the concentration variability, as illustrated in Fig. S4A and Fig. S4B. The positive values of the primary PC1 component are indicative of low concentration levels, whereas its negative values represented the high concentration levels. All parameters demonstrated a positive correlation with higher concentration levels.
Temkin model
The Temkin model considers adsorbate-adsorbate interactions and suggests that the adsorption energy decreases with coverage. This is useful in designing processes where managing the heat of adsorption and preventing excessive energy release is important. The values of the Temkin model (Eq. 5) parameters are given in Table 1 with the data for the plot of Fig. 10 in Table S11. The Temkin model’s lower the correlation coefficient (R² = 0.8674) indicated a weaker fit compared to the other models. BT value less than 8 indicated the physisorption type of adsorption type [74]. This suggests a more complex adsorption mechanism beyond simple physisorption. Similar observations were made by Gouamid et al [75], they found the Temkin model to be the best fit for the adsorption of Methylene Blue onto date palm leaf powder.
Fig. 10.
Temkin equilibrium model plot for the biosorption of ARS onto Alhagi maurorum
Further analysis through PCA revealed five new variables, with the first two principal components accounting for 99.59% of the system’s variability. The parameters within the two red circles are the most influential regarding the system’s variability (Fig. S5A). There was a notable strong and positive correlation among the parameters q, ln Ce, Ce, q, and removal. The PC1 accounts for 97.49% of the concentration variability, as depicted in Fig. S5B. The positive values of the main PC1 component are associated with low concentration levels. In contrast, its negative values correlate with high concentration levels. A positive correlation was observed for all parameters in relation to high concentration.
Kinetic modeling
To understand the mechanisms governing adsorption dynamics, various kinetic models were opt for elucidating the adsorption process. Specifically, pseudo-first-order and pseudo-second-order models were utilized to determine characteristics like the type of adsorption, its rate, and the system’s adsorption capacity.
Pseudo-first-order kinetic model
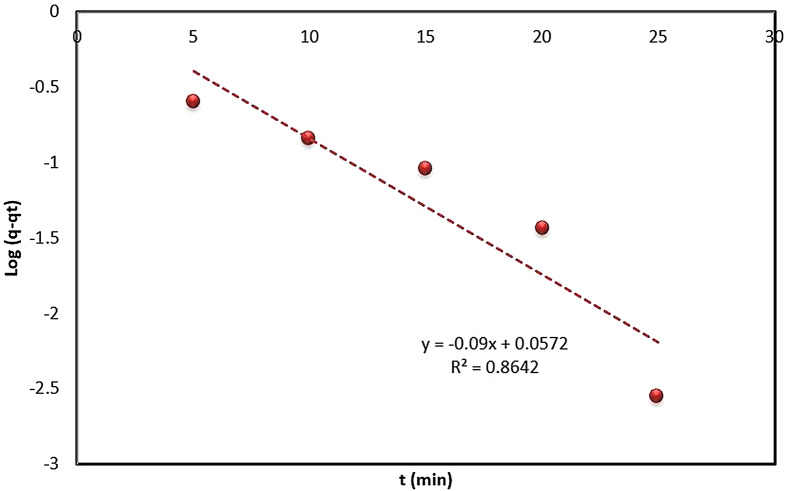
The adsorption kinetics were analyzed using the pseudo-first-order kinetic model, one of the earliest models for predicting the reaction rate based on adsorption capacity. A graph plotting time against ln(q-qt) (Fig. 11) according to the linear equation of the pseudo-first-order kinetic model (Eq. 6) was constructed. The calculated parameters of this model are presented in Table 2. The correlation coefficient (R²) was calculated to be 0.8642, suggesting that the pseudo-first-order model does not adequately describe the adsorption process (R² < 0.9), indicating its limited applicability.
Fig. 11.
Pseudo-first-order kinetic plot for the biosorption of ARS onto Alhagi maurorum
Table 2.
Kinetic parameters for the biosorption of ARS onto Alhagi maurorum
| Kinetic model | Parameter | Value |
|---|---|---|
| Pseudo-first order | K1 (min− 1) | 0.0900 |
| q (mg/g) | 1.0589 | |
| R2 | 0.8642 | |
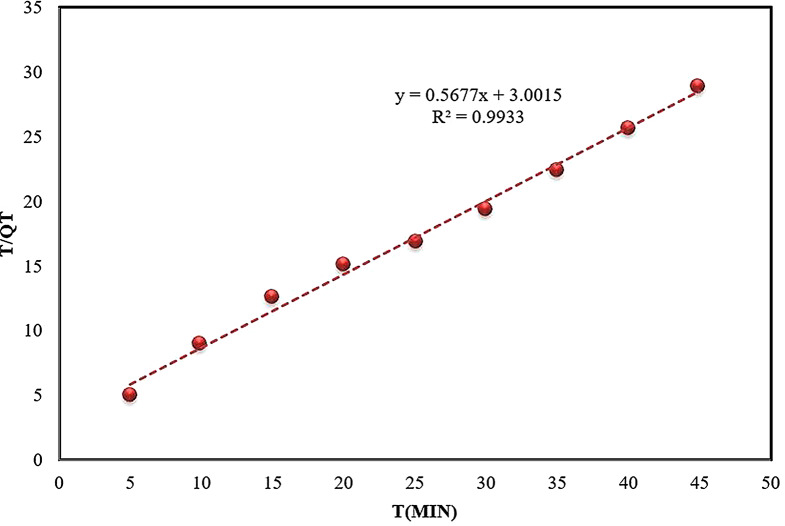
| Pseudo-second order | K2 (g/mg/min) | 0.3332 |
| q (mg/g) | 1.7615 | |
| R2 | 0.9933 |
Additionally, a PCA was performed to further analyze the data, revealing two principal components that account for the total variability (100%) in the system. Parameters within the two red circles significantly impact the system’s variability, as depicted in Fig. S6A. A strong, positive correlation was observed between Ce and q-qt and between removal and qt. Conversely, a very strong, negative correlation was noted between Ce, q-qt, and removal, qt. No correlation was found between ln(q-qt) and other parameters. The principal component PC1, accounting for 81.96% of the time variation, is shown in Fig. S6B. The negative values of this principal component correspond to shorter time intervals, while its positive values represent longer time durations. The parameter ln(q-qt) showed a positive correlation with longer time intervals, specifically 30–45 min.
Pseudo-second-order kinetic model
The kinetic data were further scrutinized using the pseudo-second-order kinetic model (Eq. 7). This model’s various parameters are detailed in Table 2. The constant for the pseudo-second-order,  , and the adsorption capacity, q, were determined from the intercept and slope, respectively, of the plot between time and t/qt (Fig. 12). The value of K2 (0.3332) and the correlation coefficient (R2 = 0.9933) demonstrated superior performance compared to the pseudo-first-order model. The adsorption of ARS onto Alhagi maurorum is most accurately described by the pseudo-second-order kinetic model, as evidenced by high correlation coefficients, indicating chemical adsorption (chemisorption mechanism) [76]. This process likely involves the formation of covalent or ionic bonds between the dye molecules and functional groups such as hydroxyl, carboxyl, and amino groups on the biosorbent surface. These groups facilitate dye binding through electrostatic interactions, hydrogen bonding, and complexation mechanisms. Such findings are consistent with previous studies by Safa and Bhatti [61], Sadaf and Bhatti [62], and Asgher et al [69], where the pseudo-second-order model also accurately described the kinetics of dye adsorption.
Fig. 12.
Pseudo-second-order kinetic plot for the biosorption of ARS onto Alhagi maurorum
Additionally, PCA was employed to further understand the system’s variability. Three new variables were derived, with the first two principal components accounting for 98.45% of the variability. Parameters within the two red circles significantly impact the system’s variability, as shown in Fig. S7A. There was a strong, positive correlation between Ce and q, and similarly between removal, qt, and t/qt. A strong, negative correlation was observed between Ce, q, and the combination of removal, qt, and t/qt. The PC1 principal component, explaining 95.01% of the time variation, is illustrated in Fig. S7B. The negative values of this principal component correspond to shorter time intervals (5 to 20 min), while its positive values are associated with longer time intervals (25 to 45 min). In the case of longer times (25–45 min), Removal, qt, and t/qt showed positive correlations. Conversely, for shorter time intervals (5 to 20 min), Ce and q parameters were more prevalent.
Thermodynamics modeling
The adsorption process’s temperature dependence provides the critical insights into its thermodynamic properties. Understanding these parameters, such as Gibbs free energy (∆G°), enthalpy change (ΔH°), and entropy change (ΔS°), are essential for evaluating the spontaneity and feasibility of the biosorption process. In this study, these thermodynamic parameters were derived from the slope and intercept of the linear plot of ln K𝑐 versus 1/T (Eq. 8), with the results summarized in Table 3. The G° is a key indicator of the spontaneity of the adsorption process. The negative values of ∆G° across all temperature ranges, calculated using Eq. 9, suggested that the adsorption of ARS onto Alhagi maurorum is spontaneous and feasible without requiring additional energy input [35]. This implies that the process can be efficiently harnessed for practical dye removal applications. The positive value of ΔS° (0.076 kJ/mol) indicated an increased randomness at the solid-solution interface during adsorption [77]. Moreover, the positive ΔH° value (21.41 kJ/mol) confirms that the process is endothermic, meaning that it absorbs heat, which may enhance adsorption efficiency at higher temperatures. These findings align with similar studies of Guerrero-Coronilla et al [78] on Acid Red 27 dye adsorption and Gautam et al [79] on ARS removal using mustard husk, both of which reported the spontaneous and endothermic adsorption processes. The positive ΔS° and ΔH° values indicated that the adsorption process is feasible and endothermic. Understanding ΔH° helps in selecting or designing biosorbents based on the desired adsorption strength and reversibility. The ΔS° value suggests that biosorbents with specific surface properties can be engineered to enhance adsorption through entropy-driven processes. The endothermic nature of the process implies that Alhagi maurorum could be particularly effective in warmer climates or industrial settings with higher operational temperatures.
Table 3.
Thermodynamic modeling analysis the for biosorption of ARS onto Alhagi maurorum
| Temp. (oC) |
Co (ppm) |
Ce (ppm) |
Removal (%) |
q (mg/g) |
KD | T (K) |
ΔGo (Exp.) (J/mol) |
ΔGo (Cal.) (J/mol) |
|---|---|---|---|---|---|---|---|---|
| 10 | 25 | 11.981 | 52.075 | 1.085 | 1.087 | 283.16 | -195.555 | -0.195 |
| 20 | 25 | 10.094 | 59.623 | 1.242 | 1.477 | 293.16 | -949.99 | -0.950 |
| 30 | 25 | 8.208 | 67.170 | 1.399 | 2.046 | 303.16 | -1804.34 | -1.804 |
| 40 | 25 | 7.264 | 70.943 | 1.478 | 2.442 | 313.16 | -2324.08 | -2.324 |
| 50 | 25 | 6.321 | 74.717 | 1.557 | 2.955 | 323.16 | -2911.3 | -2.9113 |
| 60 | 25 | 4.434 | 82.264 | 1.714 | 4.638 | 333.16 | -4249.98 | -4.245 |
Following the PCA analysis, four new variables were identified, with the first two principal components explaining 99.82% of the system’s variability. Parameters within the two red circles significantly impact the system’s variability, as shown in Fig. S8A. A strong, positive correlation was observed between Ce, ΔG0 (Exp.), and ΔG0 (Cal.) parameters. Similarly, a strong, positive correlation was found between removal, q, T, and KD. A very strong, negative correlation was also noted between Ce, ΔG0 (Exp.), ΔG0 (Cal.), and the combination of removal, q, T, KD. The PC1 principal component, accounting for 98.65% of the temperature variation, is depicted in Fig. S8B. The negative values of this principal component correspond to lower temperatures (10 to 30 °C). In comparison, its positive values indicate higher temperatures (40 to 60 °C). At higher temperatures (40 to 60 °C), parameters Removal, q, T, and KD showed positive correlations. Conversely, at lower temperatures (10 to 30 °C), parameters Ce, ΔG0 (Exp.), and ΔG0 (Cal.) were more relevant.
Mechanism of alizarin Red S onto Alhagi maurorum
The adsorption of Alizarin Red S (ARS) onto Alhagi maurorum involves the multiple mechanisms, as suggested by the modeling studies. These mechanisms are influenced by factors such as pH, equilibrium, kinetics, thermodynamics, and the inherent properties of both the adsorbate and the adsorbent, including the pKa values of ARS and the functional groups present on the biosorbent’s surface.
The modeling results suggest that chemisorption plays a significant role in the dye uptake. To better understand the forces driving this process, it’s important to consider the specific interactions between ARS and the biosorbent. In solution, ARS is typically negatively charged, particularly in its deprotonated form, due to its sulfonic acid groups. These groups lose protons at higher pH levels, resulting in a negatively charged dye species. The pKa values of ARS (pKa1 = 5.88 and pKa2 = 10.81) indicate that the dye predominantly exists in its anionic form (negatively charged) at pH levels above 5.88 [80–82]. At lower pH levels, ARS undergoes protonation, whereas at higher pH levels, it remains deprotonated. Electrostatic interactions play a significant role in the adsorption process, particularly when the biosorbent surface is positively charged. This positive charge is likely when functional groups like hydroxyl and carboxyl groups on the biosorbent are protonated at lower pH levels, leading to attraction between the negatively charged ARS and the positively charged biosorbent surface. Additionally, the negatively charged sulfonic acid groups on ARS can interact electrostatically with positively charged sites on the biosorbent.
The functional groups on Alhagi maurorum including hydroxyl, carboxylate, and alkyl groups have been confirmed through FTIR analysis. These groups can form hydrogen bonds with the ARS molecules, particularly through the interaction of hydrogen atoms in ARS with oxygen atoms in the hydroxyl groups on the biosorbent. Hydrogen bonds, a specific type of dipole-dipole interaction, are characterized by weak partial intermolecular forces occurring when alkyl hydrogens on the biosorbate interact with oxygen atoms in the biosorbent’s functional groups [83]. The OH or C = O groups on the biosorbent surface may also engage in weak dipole–dipole interactions with ARS, given that ARS is an ionic compound [84] since ARS is an ionic compound. Furthermore, ARS contains polycyclic aromatic structures with multiple benzene rings, which can participate in π-π stacking interactions with the biosorbent, enhancing biosorption through a donor-acceptor relationship [33]. The process is further influenced by hydrophobic interactions and the presence of C = C double bonds [85]. The unsaturated carbon–carbon double bonds (π bonds) contribute to π–π electron interactions [86].
The thermodynamic analysis further supports the dominance of chemisorption in this process. The negative values of ΔG° indicate that the adsorption is spontaneous, while the positive ΔH° value suggests an endothermic process, which is typically associated with stronger interactions, such as chemical bonding, rather than simple physical adsorption. These thermodynamic insights suggest that the adsorption mechanism likely involves a combination of electrostatic interactions, hydrogen bonding, and π-π interactions, with the dominant process being chemisorption, particularly under conditions where the biosorbent surface is positively charged at lower pH levels.
Conclusion
This study investigated the adsorption of Alizarin Red S (ARS) dye onto Alhagi maurorum, focusing on optimizing conditions such as temperature, contact time, and biosorption equilibrium modeling. The results revealed that the adsorption capacity (q) increased with temperature, confirming the endothermic nature of the process. The highest adsorption capacity was 1.713 mg/g at 60 °C, while the lowest was 1.084 mg/g at 10 °C. Principal Component Analysis (PCA) highlighted temperature as the dominant factor influencing adsorption, with PC1 accounting for 100% of its impact. Adsorption equilibrium was reached within 30 min, and the pseudo-second-order kinetic model provided the best fit, indicating that chemisorption was the primary mechanism governing the rate of adsorption.
The Langmuir isotherm model showed an excellent fit (R² = 0.9913), suggesting monolayer adsorption on a homogeneous surface with a maximum capacity of 8.203 mg/g. The Freundlich isotherm also fit well (R² = 0.9851), indicating adsorption on a heterogeneous surface, with favorable 𝑛 values between 2 and 10. In contrast, the Temkin isotherm exhibited a weaker fit (R² = 0.8674), pointing to weaker interactions between the adsorbate and adsorbent, with physisorption playing a lesser role.
The findings demonstrated that Alhagi maurorum is an effective and low-cost biosorbent for the removal of ARS from aqueous solutions, aligning with the principles of green chemistry by offering an eco-friendly and economical solution for wastewater treatment. Its performance is on par with other natural adsorbents, making it a viable alternative, particularly in regions where the plant is abundant. The strong fit of the Langmuir isotherm model is consistent with other studies on natural adsorbents, where monolayer adsorption is commonly observed. The endothermic nature of the adsorption process suggests that A. maurorum could be particularly effective in warm climates or industrial processes where elevated temperatures are common.
The economic implications of this study include the potential for reduced costs in dye wastewater treatment compared to conventional methods. Environmentally, the use of Alhagi maurorum could lead to decreased reliance on synthetic chemicals, reducing environmental impact. This research not only contributes to the growing body of knowledge on biosorption but also provides practical insights for scaling up the process for industrial applications. The potential to scale up this biosorption process using large-scale units or columns packed with A. maurorum could result in more sustainable and cost-effective wastewater management solutions.
While the study demonstrated that Alhagi maurorum has promising potential as a low-cost biosorbent for ARS dye removal from aqueous solutions, it is important to recognize the limitations. The experiments were conducted under controlled laboratory conditions with pure dye solutions, which do not fully capture the complexity of industrial wastewater. In real wastewater, the presence of other pollutants, both organic and inorganic, may compete for adsorption sites and affect the efficiency of A. maurorum. Future studies should focus on testing its performance in more complex and diverse wastewater scenarios. Additionally, it is crucial to investigate the biosorbent’s regeneration and reusability to enhance its economic feasibility for large-scale applications.
Although, the results are encouraging, practical applications would require pilot-scale studies to confirm the feasibility of using Alhagi maurorum in real-world wastewater treatment processes. Further investigation into the regeneration and reusability of the biosorbent is crucial for improving cost-effectiveness and practicality in wastewater treatment to ensure that the process is not only efficient but also economically viable for large-scale application. Efforts should also be made to enhance the biosorption capacity and durability through physical and chemical modifications of the biosorbent, as well as optimizing operating conditions such as pH and ionic strength. Gaining deeper insights into the mechanisms of biosorption, including ion exchange, electrostatic interactions, and surface complexation, will be essential for refining and improving the biosorption process.
Electronic supplementary material
Below is the link to the electronic supplementary material.
Acknowledgements
The authors extend their appreciation to the Researchers Supporting Project (RSP2024R306), King Saud University, Riyadh, Saudi Arabia.
Author contributions
Conceptualization, BA, AU; methodology, BA; software, AU, CAI; validation, BA, AU, CAI; investigation AU, SG, RI; resources, AU, MSE, MAA, CAI; writing original draft preparation, BA, AU, CAI; writing, review and editing, AU, MSE, MAA, CAI; supervision, AU. All authors have read and agreed to publish this version of the manuscript.
Funding
Not Applicable.
Data availability
Data and materials will be available from corresponding authors on personal request.
Declarations
Ethical approval
Not applicable.
Consent for publication
Not applicable.
Consent to publish
Not applicable.
Competing interests
The authors declare no competing interests.
Footnotes
Publisher’s note
Springer Nature remains neutral with regard to jurisdictional claims in published maps and institutional affiliations.
Contributor Information
Aisha Umar, Email: ash.dr88@gmail.com.
Soumya Ghosh, Email: soumyaghosh@yahoo.com, Email: s.ghosh@unizwa.edu.om.
References
- 1.Ramavandi B, Najafpoor AA, Alidadi H, Bonyadi Z. Alizarin red-S removal from aqueous solutions using Saccharomyces cerevisiae: kinetic and equilibrium study. Desalin Water Treat. 2019;144:286–91. [Google Scholar]
- 2.Mishra S, Chowdhary P, Bharagava RN. Conventional methods for the removal of industrial pollutants, their merits and demerits. Emerging and eco-friendly approaches for waste management 2019;1–31.
- 3.Ameri M, Khavari-Nejad R, Soltani N, Najafi F, Bagheri A. Application of immobilized microalgae for native wastewater treatment. Int J Algae. 2020;22(1):77–88. [Google Scholar]
- 4.Bhatti HN, Mahmood Z, Kausar A, Yakout SM, Shair OH, Iqbal M. Biocomposites of polypyrrole, polyaniline and sodium alginate with cellulosic biomass: Adsorption-desorption, kinetics and thermodynamic studies for the removal of 2, 4-dichlorophenol. Int J Bio Macromol. 2020;153:146–57. [DOI] [PubMed] [Google Scholar]
- 5.Akram M, Salman M, Farooq U, Saleem U, Tahir S, Nazir H, Arsalan H. Phthalate-functionalized Sorghum bicolor L.; an effective biosorbent for the removal of alizarin red S and bromophenol blue dyes from simulated wastewater. Desalin Water Treat. 2020;190(3137870):383–92. [Google Scholar]
- 6.Sadeghi A, Ehrampoush MH, Ghaneian MT, Najafpoor AA, Fallahzadeh H, Bonyadi Z. The effect of diazinon on the removal of carmoisine by Saccharomyces cerevisiae. Desalin Water Treat. 2019;137:273–8. [Google Scholar]
- 7.Tang S, Xia D, Yao Y, Chen T, Sun J, Yin Y, Shen W, Peng Y. Dye adsorption by self-recoverable, adjustable amphiphilic graphene aerogel. J Colloi Interface Sci. 2019;554:682–91. [DOI] [PubMed] [Google Scholar]
- 8.Tasrin S, Mohamed Madhar Fazil S, Senthilmurugan S, Selvaraju N. Facile preparation of nanocellulose embedded polypyrrole for dye removal: unary and binary process optimization and seed toxicity. Int J Environ Sci Technol. 2021;18:365–78. [Google Scholar]
- 9.Katheresan V, Kansedo J, Lau SY. Efficiency of various recent wastewater dye removal methods: a review. J Environ Chem Eng. 2018;6(4):4676–97. [Google Scholar]
- 10.Obiora-Okafo IA, Onukwuli OD, Igwegbe CA, Onu CE, Omotioma M. Enhanced performance of natural polymer coagulants for dye removal from wastewater: coagulation kinetics, and mathematical modelling approach. Environ Proces. 2022;9(2):20. [Google Scholar]
- 11.Zhu G, Fang H, Xiao Y, Hursthouse AS. The application of fluorescence spectroscopy for the investigation of dye degradation by chemical oxidation. J Fluoresc. 2020;30(5):1271–9. [DOI] [PubMed] [Google Scholar]
- 12.Onyechi C. Textile wastewater treatment using activated carbon from agro wastes. M. Eng. Thesis, Department of Chemical Engineering, Nnamdi Azikiwe University, Awka; 2014.
- 13.Ahmad MA, Eusoff MA, Oladoye PO, Adegoke KA, Bello OS. Statistical optimization of Remazol Brilliant Blue R dye adsorption onto activated carbon prepared from pomegranate fruit peel. Chem Data Coll. 2020;28:100426. [Google Scholar]
- 14.da Silva Santos DH, Xiao Y, Chaukura N, Hill JM, Selvasembian R, Zanta CLS, Meili L. Regeneration of dye-saturated activated carbon through advanced oxidative processes: a review. Heliyon, 2022;8(8). [DOI] [PMC free article] [PubMed]
- 15.San Miguel G, Lambert S, Graham N. The regeneration of field-spent granular-activated carbons. Water Res. 2001;35(11):2740–8. [DOI] [PubMed] [Google Scholar]
- 16.Ali I. The quest for active carbon adsorbent substitutes: inexpensive adsorbents for toxic metal ions removal from wastewater. Sep Purif Rev. 2010;39(3–4):95–171. [Google Scholar]
- 17.Crini G, Lichtfouse E, Wilson LD, Morin-Crini N. Conventional and non-conventional adsorbents for wastewater treatment. Environ Chem Lett. 2019;17:195–213. [Google Scholar]
- 18.Enyoh EC, Ovuoraye P, Isiuku O, Igwegbe CA. Artificial neural network and response surface design for modeling the competitive biosorption of pentachlorophenol and 2, 4, 6-trichlorophenol to Canna indica L. in Aquaponia. Anal Method Environ Chem J. 2023;6(01):79–99. [Google Scholar]
- 19.Kamran U, Bhatti HN, Iqbal M, Jamil S, Zahid M. Biogenic synthesis, characterization and investigation of photocatalytic and antimicrobial activity of manganese nanoparticles synthesized from Cinnamomum verum bark extract. J Mol Struct. 2019;1179:532–9. [Google Scholar]
- 20.Madhogaria B, Banerjee S, Kundu A, Dhak P. Efficacy of new generation biosorbents for the sustainable treatment of antibiotic residues and antibiotic resistance genes from polluted waste effluent. Infect Med. 2024;3(1):100092. [DOI] [PMC free article] [PubMed]
- 21.Kumar A, Singh R, Upadhyay SK, Kumar S, Charaya M, Biosorption. The removal of toxic dyes from industrial effluent using phytobiomass-A review. Plant Arch. 2021;21:1320–5. [Google Scholar]
- 22.Kazemi M, Bezdi KG. An investigation of the nutritional value of camelthorn (Alhagi maurorum) at three growth stages and its substitution with part of the forage in Afshari ewes’ diets. Anim Feed Sci Technol. 2021;271:114762. [Google Scholar]
- 23.Ebrahimi A, Ehteshami M, Dahrazma B. Isotherm and kinetic studies for the biosorption of cadmium from aqueous solution by Alhaji maurorum seed. Proc Safe Environ Prot. 2015;98:374–82. [Google Scholar]
- 24.Kazemi M, Valizadeh R. Can Alhaji maurorum as a halophyte plant be ensiled with molasses and Saccharomyces cerevisiae well? AMB Exp. 2023;13(1):28. [DOI] [PMC free article] [PubMed] [Google Scholar]
- 25.Chinnathambi A, Alahmadi TA. Zinc nanoparticles green-synthesized by Alhagi maurorum leaf aqueous extract: Chemical characterization and cytotoxicity, antioxidant, and anti-osteosarcoma effects. Arab J Chem. 2021;14(4):103083. [Google Scholar]
- 26.Iqbal U, Ali A, Daad A, Aslam MU, Rehman FU, Farooq U, Gul MF. Unraveling the defensive strategies of camel thorn Alhagi maurorum medik. For thriving in arid and semi-arid environments. J Arid Environ. 2023;219:105076. [Google Scholar]
- 27.Balasubramani K, Sivarajasekar N, Naushad M. Effective adsorption of antidiabetic pharmaceutical (metformin) from aqueous medium using graphene oxide nanoparticles: equilibrium and statistical modelling. J Mol Liq. 2020;301:112426. [Google Scholar]
- 28.Gülen J, Gezerman AO. A novel biosorbent for remediation of colored waste water. Biomass Convers Biorefin. 2023;13(4):3227–35. [Google Scholar]
- 29.Gewers FL, Ferreira GR, Arruda HFD, Silva FN, Comin CH, Amancio DR, Costa LF. Principal component analysis: a natural approach to data exploration. ACM Comput Surv. 2021;54(4):1–34. [Google Scholar]
- 30.Khalifa HA, Elattar AM, Eleiwa NZ. Possible analgesic, 1anti-inflammatory and anti-ulcerogenic effects of Alhagi maurorum methanolic extract in rats and mice. Slov Vet Res. 2018;55(Suppl 20):375–82. [Google Scholar]
- 31.Voudrias E, Fytianos K, Bozani E. Sorption–desorption isotherms of dyes from aqueous solutions and wastewaters with different sorbent materials. Global Nest Int J. 2002;4(1):75–83. [Google Scholar]
- 32.Muthukkumaran A, Aravamudan K. Combined homogeneous surface diffusion model – design of experiments approach to optimize dye adsorption considering both equilibrium and kinetic aspects. J Environ Manage. 2017;204:424–35. [DOI] [PubMed] [Google Scholar]
- 33.Igwegbe CA, Kozłowski M, Wasowicz J, Peczek E, Białowiec A. Nitrogen removal from landfill leachate using biochar derived from wheat straw. Materials. 2024;17(4):928. [DOI] [PMC free article] [PubMed] [Google Scholar]
- 34.Igwegbe CA, Onukwuli OD, Onyechi KK, Ahmadi S. Equilibrium and kinetics analysis on vat yellow 4 uptake from aqueous environment by modified rubber seed shells: nonlinear modelling. J Mater Environ Sci. 2020;11(9):1424–44. [Google Scholar]
- 35.Sharma V, Shahnaz T, Subbiah S, Narayanasamy S. New insights into the remediation of water pollutants using nanobentonite incorporated nanocellulose chitosan based aerogel. J Pol Environ. 2020;28:2008–19. [Google Scholar]
- 36.Al-Najar JA. Removal of dyes from synthetic wastewater by agricultural waste. Iraqi J Chem Pet Eng. 2017;18(3):31–48. [Google Scholar]
- 37.Cramer J, Sager CP, Ernst B. Hydroxyl groups in synthetic and natural-product-derived therapeutics: a perspective on a common functional group. J Med Chem. 2019;62(20):8915–30. [DOI] [PubMed] [Google Scholar]
- 38.Igwegbe CA, Ighalo JO, Ghosh S, Ahmadi S, Ugonabo VI. Pistachio (Pistacia vera) waste as adsorbent for wastewater treatment: a review. Biomass Convers Biorefinery. 2023;13(10):8793–811. [Google Scholar]
- 39.Garaga MN, Nayeri M, Martinelli A. Effect of the alkyl chain length in 1-alkyl-3-methylimidazolium ionic liquids on inter-molecular interactions and rotational dynamics: a combined vibrational and NMR spectroscopic study. J Mol Liq. 2015;210:169–77. [Google Scholar]
- 40.Yin S, Wang C, Xu Q, Lei S, Wan L, Bai C. Studies of the effects of hydrogen bonding on monolayer structures of C18H37X (X = OH, SH) on HOPG. Chem Phy Lett. 2001;348(3–4):321–8. [Google Scholar]
- 41.Al-Ahmed ZA. Surface methodology for optimized adsorption of hazardous organic pollutant from aqueous solutions via novel magnetic metal organic framework: kinetics, isotherm study, and DFT calculations. J Mol Liq. 2024;409:125507.
- 42.Ighalo JO, Igwegbe CA, Adeniyi AG. The utilization of rubber (Hevea brasiliensis) seed shells as adsorbent for water pollution remediation. In: Anastopoulos I, Lima E, Meili L, Giannakoudakis D, editors. Biomass-derived materials for environmental applications. Elsevier; 2022. p. 13–28.
- 43.Malbenia John M, Benettayeb A, Belkacem M, Ruvimbo Mitchel C, Hadj Brahim M, Benettayeb I, Haddou B, Al-Farraj S, Alkahtane AA, Ghosh S, et al. An overview on the key advantages and limitations of batch and dynamic modes of biosorption of metal ions. Chemosphere. 2024;357:142051. [DOI] [PubMed] [Google Scholar]
- 44.Orozco CI, Freire MS, Gómez-Díaz D, González-Álvarez J. Removal of copper from aqueous solutions by biosorption onto pine sawdust. Sust Chem Pharm. 2023;32:101016. [Google Scholar]
- 45.Aniagor CO, Hussein DM, Farag S, Hashem A. Application of novel organic acid-modified biosorbent in the sequestration of aqueous zinc ion. Sust Wat Res Manag. 2023;9(2):61. [Google Scholar]
- 46.Alotaibi AM, Alnawmasi JS, Alshammari NA, Abomuti MA, Elsayed NH, El-Desouky MG. Industrial dye absorption and elimination from aqueous solutions through bio-composite construction of an organic framework encased in food-grade algae and alginate: Adsorption isotherm, kinetics, thermodynamics, and optimization by Box–Behnken design. Int J Biol Macromol. 2024;274:133442. [DOI] [PubMed]
- 47.Banerjee S, Chattopadhyaya M. Adsorption characteristics for the removal of a toxic dye, tartrazine from aqueous solutions by a low cost agricultural by-product. Arab J Chem. 2017;10:S1629–38. [Google Scholar]
- 48.Kitemangu A, Vegi MR, Malima NM. Biosorption of Congo Red Dye from Aqueous Solution Using Adsorbent Prepared from Vangueria infausta Fruit Pericarp. Ads Sci. Tech. 2023; 2023:4319053.
- 49.Ukpong AA, Asuquo EO, Edekhe GI. The Adsorption Equilibrium and Kinetic studies for the removal of Crystal Violet Dye (Methyl Violet 6b) from aqueous solution using avocado pear seed activated Carbon. Int J Res Sci Innov. 2023;4(10):154–64. [Google Scholar]
- 50.Abuzerr S, Darwish M, Mahvi AH. Simultaneous removal of cationic methylene blue and anionic reactive red 198 dyes using magnetic activated carbon nanoparticles: equilibrium, and kinetics analysis. Wat Sci Tech. 2018;2017(2):534–45. [DOI] [PubMed] [Google Scholar]
- 51.Abewaa M, Mengistu A, Takele T, Fito J, Nkambule T. Adsorptive removal of malachite green dye from aqueous solution using Rumex abyssinicus derived activated carbon. Sci Rep. 2023;13(1):14701. [DOI] [PMC free article] [PubMed] [Google Scholar]
- 52.Sen N, Shefa NR, Reza K, Shawon SMAZ, Rahman MW. Adsorption of crystal violet dye from synthetic wastewater by ball-milled royal palm leaf sheath. Sci Rep. 2024;14(1):5349. [DOI] [PMC free article] [PubMed] [Google Scholar]
- 53.Sutherland C, Chittoo B, Laltoo V. Biosorption of methylene blue dye using banana floret: kinetic, equilibrium, thermodynamic and mass transfer studies. Desal Wat Treat. 2023;293:224–42. [Google Scholar]
- 54.Soltani A, Faramarzi M, Mousavi Parsa SA. A review on adsorbent parameters for removal of dye products from industrial wastewater. Wat Qual Res J. 2021;56(4):181–93. [Google Scholar]
- 55.Hambisa AA, Regasa MB, Ejigu HG, Senbeto CB. Adsorption studies of methyl orange dye removal from aqueous solution using Anchote peel-based agricultural waste adsorbent. App Wat Sci. 2023;13(1):24. [Google Scholar]
- 56.Shahnaz T, S MMF VCP, Narayanasamy S. Surface modification of nanocellulose using polypyrrole for the adsorptive removal of Congo red dye and chromium in binary mixture. Int J Biol Macromol. 2020;151:322–32. [DOI] [PubMed] [Google Scholar]
- 57.Arnata IW, Suprihatin S, Fahma F, Richana N, Sunarti T. Adsorption of anionic Congo red dye by using cellulose from sago frond. Poll Res. 2019;38(3):43–53. [Google Scholar]
- 58.Lombardo S, Thielemans W. Thermodynamics of adsorption on nanocellulose surfaces. Cellulose. 2019;26:249–79. [Google Scholar]
- 59.Shahnaz T, Bedadeep D, Narayanasamy S. Investigation of the adsorptive removal of methylene blue using modified nanocellulose. Int J Biol Macromol. 2022;200:162–71. [DOI] [PubMed] [Google Scholar]
- 60.Sawasdee S, Watcharabundit P. Adsorption behavior and mechanism of alizarin yellow and rhodamine B dyes on water hyacinth (Eichhornia crassipes) leaves. Sci Asia. 2022;48(6):804–12. [Google Scholar]
- 61.Safa Y, Bhatti HN. Kinetic and thermodynamic modeling for the removal of Direct Red-31 and direct Orange-26 dyes from aqueous solutions by rice husk. Desalination. 2011;272(1–3):313–22. [Google Scholar]
- 62.Sadaf S, Bhatti HN. Batch and fixed bed column studies for the removal of Indosol Yellow BG dye by peanut husk. J Taiwan Inst Chem Eng. 2014;45(2):541–53. [Google Scholar]
- 63.Al-Ghouti MA, Da’ana DA. Guidelines for the use and interpretation of adsorption isotherm models: a review. J Hazard Mater. 2020;393:122383. [DOI] [PubMed] [Google Scholar]
- 64.Saleh TA. Isotherm models of adsorption processes on adsorbents and nanoadsorbents. In: Saleh TA, editor Interface Science Technology. Volume 34. Elsevier; 2022. p. 99–126.
- 65.Okpara OG, Ogbeide OM, Ike OC, Menechukwu KC, Ejike EC. Optimum isotherm by linear and nonlinear regression methods for lead (II) ions adsorption from aqueous solutions using synthesized coconut shell–activated carbon (SCSAC). Toxin Rev. 2021;40(4):901–14. [Google Scholar]
- 66.Shahnaz T, Vishnu Priyan V, Jayakumar A, Narayanasamy S. Magnetic nanocellulose from Cyperus rotundas grass in the absorptive removal of rare earth element cerium (III): toxicity studies and interpretation. Chemosphere. 2022;287:131912. [DOI] [PubMed] [Google Scholar]
- 67.Igwegbe CA, Ighalo JO, Onyechi KK, Onukwuli OD. Adsorption of Congo Red and malachite green using H 3 PO 4 and NaCl-modified activated carbon from rubber (Hevea brasiliensis) seed shells. Sustain Water Resour Manag. 2021;7:1–16. [Google Scholar]
- 68.Húmpola P, Odetti HS, Fertitta AE, Vicente JL. Thermodynamic analysis of adsorption models of phenol in liquid phase on different activated carbons. J Chil Chem Soc. 2013;58(1):1541–4. [Google Scholar]
- 69.Asgher M, Bhatti HN. Mechanistic and kinetic evaluation of biosorption of reactive azo dyes by free, immobilized and chemically treated Citrus sinensis waste biomass. Ecol Eng. 2010;36(12):1660–5. [Google Scholar]
- 70.Ogunlusi GO, Amos OD, Olatunji OF, Adenuga AA. Equilibrium, kinetic, and thermodynamic studies of the adsorption of anionic and cationic dyes from aqueous solution using agricultural waste biochar. J Iran Chem Soc. 2023;20(4):817–30. [Google Scholar]
- 71.Ikram K, Jamila N, Salman M, Shehrbano M, Siddique A. Use of Polyalthia longifolia based alumina composites for the removal of reactive dyes from aqueous medium. Desalin Water Treat. 2020;185(3137870):364–74. [Google Scholar]
- 72.Gul A, Muhammad S, Nawaz S, Munir S, Rehman KU, Ahmad S, Humphrey OS. Ficus religiosa bark an efficient adsorbent for alizarin Red S dye: equilibrium and kinetic analysis. J Iran Chem Soc. 2022;19:1737–1746.
- 73.Deniz F, Saygideger SD. Equilibrium, kinetic and thermodynamic studies of Acid Orange 52 dye biosorption by Paulownia tomentosa Steud. Leaf powder as a low-cost natural biosorbent. Bioresour Technol. 2010;101(14):5137–43. [DOI] [PubMed] [Google Scholar]
- 74.Nandiyanto ABD, Girsang GCS, Rizkia RS. Isotherm adsorption characteristics of 63-um calcium carbonate particles prepared from eggshells waste. J Eng Sci Technol Rev. 2022;17(5):3203–10. [Google Scholar]
- 75.Gouamid M, Ouahrani M, Bensaci M. Adsorption equilibrium, kinetics and thermodynamics of methylene blue from aqueous solutions using date palm leaves. Energy Procedia. 2013;36:898–907. [Google Scholar]
- 76.Orugba HO, Osagie C, Ukpenusiowho D, Igwegbe CA, Odigie GO. In-situ and ex-situ synthesized activated carbons derived from Raphia hookeri Kernels for Ibuprofen adsorption in wastewater. Desalin Water Treat. 2024;100534.
- 77.Ibrahim HS, Ammar NS, Soylak M, Ibrahim M. Removal of cd (II) and pb (II) from aqueous solution using dried water hyacinth as a biosorbent. Spectrochim Acta Mol Biomol Spectrosc. 2012;96:413–20. [DOI] [PubMed] [Google Scholar]
- 78.Guerrero-Coronilla I, Morales-Barrera L, Cristiani-Urbina E. Kinetic, isotherm and thermodynamic studies of amaranth dye biosorption from aqueous solution onto water hyacinth leaves. J Environ. 2015;152:99–108. [DOI] [PubMed] [Google Scholar]
- 79.Gautam RK, Mudhoo A, Chattopadhyaya MC. Kinetic, equilibrium, thermodynamic studies and spectroscopic analysis of alizarin Red S removal by mustard husk. J Environ Chem Eng. 2013;1(4):1283–91. [Google Scholar]
- 80.Shalaby AA, Mohamed AA. Determination of acid dissociation constants of alizarin Red S, Methyl Orange, Bromothymol Blue and Bromophenol Blue using a digital camera. RSC adv. 2020;10(19):11311–6. [DOI] [PMC free article] [PubMed] [Google Scholar]
- 81.Bellaj M, Yazid H, Aziz K, Regti A, Haddad ME, Achaby ME, Abourriche A, Gebrati L, Kurniawan TA, Aziz F. Eco-friendly synthesis of clay-chitosan composite for efficient removal of alizarin red S dye from wastewater: a comprehensive experimental and theoretical investigation. Environ Res. 2024;247:118352. [DOI] [PubMed] [Google Scholar]
- 82.Rabiee F, Sarkhosh M, Azizi S, Jahantigh A, Hashemi SY, Baziar M, Gholami M, Azari A. The superior decomposition of 2, 4-Dinitrophenol under ultrasound-assisted Fe3O4@ TiO2 magnetic nanocomposite: process modeling and optimization, Effect of various oxidants and degradation pathway studies. Int J Environ Anal Chem. 2024;104(6):1243–65. [Google Scholar]
- 83.Steiner T. The hydrogen bond in the solid state. Angew Chem Int Ed. 2002;41(1):48–76. [DOI] [PubMed] [Google Scholar]
- 84.Zhang L, Zhang S, Xu S, Ren X, Zhang Y, Cao F, Sun Q, Wennersten R, Yang L. The Effect of Nitrogen-and oxygen-containing functional groups on C2H6/SO2/NO adsorption: a density functional theory study. Energies. 2023;16(22):7537. [Google Scholar]
- 85.Xu B, Zhai Y, Zhu Y, Peng C, Wang T, Zhang C, Li C, Zeng G. The adsorption mechanisms of ClO 4 – onto highly graphited and hydrophobic porous carbonaceous materials from biomass. RSC Adv. 2016;6(96):93975–84. [Google Scholar]
- 86.Hernández Velázquez J, Barroso-Flores J, Gama Goicochea A. Ab initio modeling of friction reducing agents shows quantum mechanical interactions can have macroscopic manifestation. J Phys Chem A. 2016;120(46):9244–8. [DOI] [PubMed] [Google Scholar]
Associated Data
This section collects any data citations, data availability statements, or supplementary materials included in this article.
Supplementary Materials
Data Availability Statement
Data and materials will be available from corresponding authors on personal request.


