

Summary
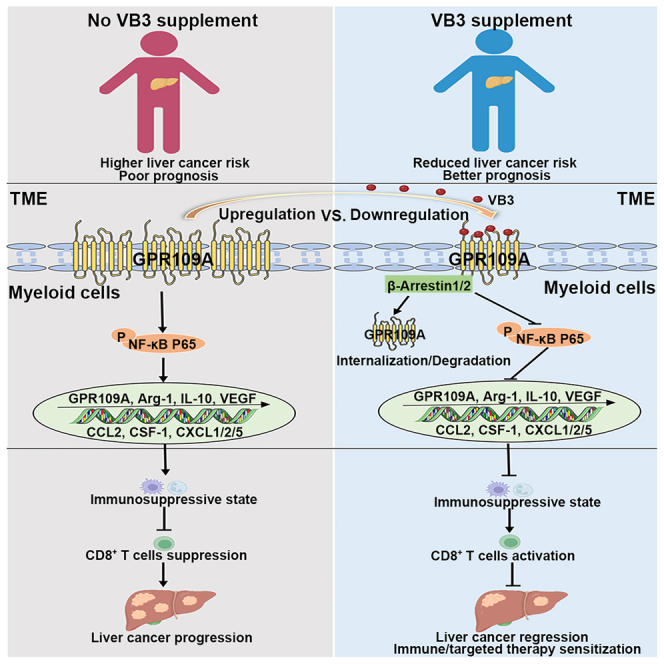
The impact of dietary nutrients on tumor immunity remains an area of ongoing investigation, particularly regarding the specific role of vitamins and their mechanism. Here, we demonstrate that vitamin B3 (VB3) induces antitumor immunity against liver cancer through biased GPR109A axis in myeloid cell. Nutritional epidemiology studies suggest that higher VB3 intake reduces liver cancer risk. VB3 supplementation demonstrates antitumor efficacy in multiple mouse models through alleviating the immunosuppressive tumor microenvironment (TME) mediated by tumor-infiltrating myeloid cell, thereby augmenting effectiveness of immunotherapy or targeted therapy in a CD8+ T cell-dependent manner. Mechanically, the TME induces aberrant GPR109A/nuclear factor κB (NF-κB) activation in myeloid cell to shape the immunosuppressive TME. In contrast, VB3 activates β-Arrestin-mediated GPR109A degradation and NF-κB inhibition to suppress the immunosuppressive polarization of myeloid cell, thereby activating the cytotoxic function of CD8+ T cell. Overall, these results expand the understanding of how vitamins regulate the TME, suggesting that dietary VB3 supplementation is an adjunctive treatment for liver cancer.
Graphical abstract
Highlights
-
•
High intake of VB3 is associated with a reduced risk of liver cancer
-
•
VB3 supplementation leads to a T cell-dependent liver tumor control
-
•
VB3 induces antitumor immunity via activating biased GPR109A axis in myeloid cell
-
•
VB3 enhances the antitumor efficacy of immunotherapy and targeted therapy
Yang et al. report VB3 supplementation as an adjunctive treatment for liver cancer. VB3 demonstrates antitumor efficacy in multiple mouse models through alleviating GPR109A/NF-κB-mediated immunosuppression in tumor-infiltrated myeloid cells, thereby augmenting effectiveness of immunotherapy or targeted therapy in a CD8+ T cell-dependent manner.
Introduction
Liver cancer is a significant global health concern, ranking among the most lethal malignancies.1 Unfortunately, due to the absence of early-stage symptoms, over 50% of liver cancer cases are diagnosed at an advanced stage, limiting treatment options to systemic therapies.2,3 Only a small proportion of patients benefit from systemic approaches due to genetic, metabolic, and inflammatory heterogeneity and immunosuppressive microenvironments.4 Hence, there is an urgent need to investigate novel therapeutic interventions aimed at halting the progression of liver cancer in its early stages.
The composition of diet plays a crucial role in determining the availability of nutrients in the plasma and tumor microenvironment (TME), affecting both cancer cells or immune cells.5 Nutrients encompass macronutrients such as proteins, carbohydrates, and fatty acids, as well as micronutrients like vitamins and minerals.6,7 Observational epidemiological studies and experimental research have provided evidence that dietary nutrients can modulate immune homeostasis and impact the progression and outcomes of various cancers.8,9,10,11 Given the widespread use of dietary nutritional supplements among cancer patients, there is a growing research interest in exploring the potential of these supplements as adjunctive approaches during conventional cancer therapy.12 However, the precise mechanisms through which nutritional factors influence cancer progression and therapeutic response remain largely unknown. Therefore, it is crucial to identify the clinical relevance of dietary nutritional supplements and elucidate their underlying mechanisms of action in improving cancer therapy. This knowledge can guide the clinical application of nutritional supplements for the benefit of cancer patients.
Vitamins are a crucial subgroup of micronutrients that play an essential role in various cellular processes, contributing to overall human health.13 Vitamins have a significant impact on the proinflammatory and carcinogenic effects, as well as the antitumor immune responses of immune cells, thereby influencing the development and prevention of malignant cancers.14 For instance, dietary supplementation of vitamin E and B6 has been shown to activate dendritic cells (DCs) and natural killer (NK) cells, thereby enhancing the antitumor immunity of T cells against melanoma, mammary tumor, or pancreatic ductal adenocarcinoma.6,15 Therefore, growing insight into cancer immunity is highlighting the importance of specific vitamin supply on tumor development and therapeutic response. In this study, we demonstrate how dietary vitamin B3 (VB3) remodels the immunosuppressive TME to induce the antitumor immunity against liver cancer.
Results
Dietary VB3 supplementation reduces the risk of liver cancer
The investigation of relationship between B group vitamins supplementation and cancer development, specifically digestive system cancer influenced by dietary factors, holds substantial importance considering the widespread use of these supplements among adults. Firstly, we utilized the cross-sectional data from the National Health and Nutrition Examination Survey (NHANES) 1999–2020 cycles to assess the potential association of diet-derived B group vitamins (VB1, VB2, VB3, VB6, and VB12) with digestive system cancers. The study involved 47,269 participants (Figure S1A; Table S1). Baseline characteristics revealed a deficiency of diet-derived B group vitamins in individuals with digestive system cancer compared to non-cancer counterparts, notably VB3 (p < 0.01) (Table S1). Subsequently, the investigation of correlations between typical B group vitamins intake and the incidence of digestive system cancers was further conducted. After adjusting for gender, age, and race, we specifically focused on the higher intake of VB3, which was found to be associated with a lower incidence of liver cancer, esophageal cancer, and gastric cancer (Figure 1A).
Figure 1.

Dietary VB3 supplementation reduces the risk of human liver cancer
(A) Multivariable logistic regression models to analyze the relationship between dietary B group vitamins intake and digestive system cancers in the NHANES database; error bars represent 95% confidence intervals.
(B) Multivariable Cox regression models to analyze the relationship between dietary B group vitamins intake and liver cancer in the UK Biobank database; error bars represent 95% confidence intervals.
(C) Kaplan-Meier survival curves for VB3 supplementation with overall cancer-related mortality outcomes in the NHANES database.
Considering the vital role of the liver in vitamin storage, absorption, transportation, modification, and utilization, we further confirmed the association between higher VB3 intake and reduced risk of liver cancer in a larger prospective cohort of 84,476 participants in the UK Biobank database with a median follow-up of 11.6 years (Table S2; Figure S1B). The higher intake of VB3 also specifically decreased the liver cancer risk compared to other B group vitamins (hazard ratio = 0.68, 95% confidence interval: 0.48–0.96, p = 0.03) (Figure 1B). To further explore the impact of VB3 supplementation on the prognosis of cancer patients, Kaplan-Meier analysis was employed to illustrate the correlation between VB3 supplementation and cancer-related death outcomes in the NHANES database. We found cancer patients who took VB3 supplementation had a lower cancer-related death rate (p < 0.001) (Figure 1C). Similarly, a lower cancer-related death risk was observed in digestive system cancer patients with VB3 supplementation, although the association was not statistically significant due to the limited population size of digestive system cancer patients in this analysis (p = 0.15) (Figure S1E).
Previous studies have revealed that long-term VB3 intake (over 1,000 mg/daily, over 6 months) could cause liver damages.16 Here, the daily VB3 intake of included participants ranged from 0 to 379.852 mg (median value, 21.869 mg) in the NHANES database and 0 to 215.95 mg (median value, 37.5 mg) in the UK Biobank database, which was substantially lower than dosage implicated in liver damage. Furthermore, the serum aspartate transferase (AST) and alanine aminotransferase (ALT) levels of enrolled participants were extracted to evaluate their liver function. Analysis indicated little difference in AST and ALT levels between the low and high VB3 intake group (Figures S1C and S1D), suggesting no occurrence of liver damage in the included participants. Based on these epidemiological results, we hypothesize that VB3 supplementation may potentially slow down the progression of liver cancer.
Dietary VB3 supplementation inhibits liver cancer growth
The epidemiological findings prompted further investigation into the potential of dietary VB3 supplementation to prevent liver cancer progression in animal models. A preventive tumor model was established to assess the effect of VB3 on liver tumor growth, involving a 7-day VB3 pretreatment prior to the implantation of subcutaneous Hepa1-6, LPC-H12, and H22 liver tumors (Figures 2A, S2A, and S2D). The results indicated that the tumor growth and weight of tumor were significantly inhibited in VB3-treated mice (Figures 2B, 2C, and S2B–S2G). Intragastric administration exhibited a better antitumor efficacy compared to intraperitoneal administration (Figures S2B and S2C). However, there was no dose-dependent response observed with intragastric VB3 treatment (Figures S2E and S2F), possibly due to the comparable VB3 levels in tumor interstitial fluid after different dosages of VB3 supplementation (Figure S2I). Furthermore, the accumulated levels of endogenous 3-hydroxybutyric acid and butyric acid were found to be low in tumor interstitial fluid and serum compared to VB3 (Figures S2I and S2J). Considering both safety and antitumor efficiency (Figures 2B and S2H), 50 mg/kg VB3 was selected for further in vivo treatment dosage in the subsequent study.
Figure 2.

Dietary VB3 supplementation inhibits liver cancer growth
(A–C) The schedule of establishing subcutaneous liver cancer models and VB3 treatment (A). Tumor volumes (B) and tumor weights (C) of Hepa1-6 (n = 8), LPC-H12 (n = 7), and H22 (n = 6) were measured.
(D–F) The schematic of the experimental design and timeline for DEN+CCl4-indued primary liver cancer model and VB3 treatment (D). Representative images of liver were shown (E). Total tumor number and liver weight were quantified (F, n = 12).
(G) Representative histopathology images of the liver. Scar bar, 210 μm.
(H) Representative images of AFP and Ki67 staining. Scar bar, 100 μm.
(I) Tumor volumes and tumor weights were observed in the prevention (P) and treatment (T) model of VB3 intervention. Data are presented as means ± SEM. Experiments were conducted independently in triplicates or more. Statistical analysis was performed by two-way ANOVA (B and I), one-way ANOVA (C and I), or Student’s t test (F). ns, p > 0.05; ∗, p < 0.05; ∗∗, p < 0.01; ∗∗∗, p < 0.001.
Next, we evaluate the antitumor effect of VB3 against primary liver cancer in diethylnitrosamine (DEN) and carbon tetrachloride (CCl4) model, which mimics genotoxic injury and advanced fibrosis-associated human liver cancer (Figure 2D). In the vehicle group, a significant incidence of the liver tumors was observed. However, VB3 intervention effectively reduced the tumor number and tumor weight in the liver (Figures 2E and 2F). Histopathology analysis further indicated that VB3 provided protection against DEN+CCl4-induced orthotopic liver cancer (Figure 2G). Immunostaining of alpha fetoprotein (AFP) and Ki67 confirmed that VB3 postponed hepatocarcinogenesis and inhibited abnormal cell proliferation in both tumors and surrounding liver tissues (Figure 2H).
The aforementioned findings prompted further investigation into the potential antitumor effect of VB3 against liver cancer in a therapeutic model. In Hepa1-6- or LPC-H12-implanted mice, we found VB3 treatment also effectively suppressed tumor growth (Figure 2I). However, the therapeutic effect of VB3 was inferior to the prevention effect (Figure 2I). Taking together, these findings demonstrate that dietary supplementation of VB3 plays a protective role in the initiation and progression of liver cancer.
VB3 remodels the immunosuppressive TME to activate antitumor immune response
To decipher the antitumor effect of VB3, we initially assessed its potential to directly inhibit tumor cells proliferation and colony formation. However, the results demonstrated that VB3 did not have a direct impact on the proliferation and colony formation of Hepa1-6 and LPC-H12 (Figures S2K and S2L). Next, we investigated the potential involvement of the immune system in the antitumor efficacy of VB3. In VB3-treated mice, flow cytometric analysis of tumor tissues revealed a significant increase of CD8+ T cells and M1-like tumor-associated macrophages (TAMs), as well as a dramatic decrease in granulocyte-like myeloid derived suppressor cells (G-MDSCs) and M2-like TAMs compared to the vehicle group (Figures 3A–3D and S3E). The infiltration of other immune cells, such as CD4+ T cells, monocytic myeloid-derived suppressor cells (M-MDSCs), DCs, and NK cells, remained unchanged (Figures S3A–S3D). Immunostaining of CD8, inducible nitric oxide synthase (INOS), arginase 1 (Arg-1), and Ly6G in Hepa1-6 tumor tissues further confirmed a decrease in M2-like TAMs (Arg-1) and G-MDSCs (Ly6G), and an increase in M1-like TAMs (INOS) and CD8+ T cells (Figure 3E). In addition, VB3 supplementation did not impact the proportion of CD4+ T and CD8+ T cells in mice spleen (Figure S3F).
Figure 3.

VB3 remodels immunosuppressive TME to activate adaptive immune response
(A–D) The frequency of infiltrated immune cells in the TME was analyzed from Hepa1-6 (A, n = 8), LPC-H12 (B, n = 7), H22 (C, n = 6), and DEN+CCl4 tumor model (D, n = 12) after VB3 treatment.
(E) Representative images of CD8, INOS, Arg-1, Ly6G, cleaved caspase-3, and TUNEL staining form Hepa1-6 tumors. Scar bar, 100 μm for IHC and 60 μm for IF.
(F) VB3-induced changes in tumor-infiltrated CD8+ T cells were determined (n = 6), including activation (naive-like CD8+ T, CD8+CD44−CD62L+; effector CD8+ T, CD8+CD44+CD62L−), cytotoxic function (Perforin, GZMB, IFN-γ, and TNF-α), proliferation (Ki67), and exhaustion (PD-1, TIM-3, LAG-3, and TIGIT).
(G) VB3-induced CD4+ T component changes in the TME were determined (n = 6). CD4+ Tcon, CD4+FOXP3−, CD4 Treg, CD4+FOXP3+.
(H and I) Tumor volumes (H) and tumor weights (I) were observed in VB3-treated mice after CD8+ T cells depletion (n = 6).
(J) The proportion of infiltrated immune cells in tumors was determined (n = 6). Data are presented as means ± SEM. Experiments were conducted independently in triplicates or more. Statistical analysis was performed by one-way ANOVA (A, B, C, I, and J), Student’s t test (D, F, and G) or two-way ANOVA (H). ns, p > 0.05; ∗, p < 0.05; ∗∗, p < 0.01; ∗∗∗, p < 0.001.
Following VB3 intervention, a noteworthy increase in the effector cell population within tumor-infiltrated CD8+ T cells was observed (Figure 3F). This increase was attributed to the upregulated proliferation ability (Ki67) and enhanced cytotoxic function (Perforin, granzyme B [GZMB], interferon [IFN]-γ, and tumor necrosis factor alpha [TNF-α]), coupled with a decrease in exhausted states (programmed death-1 [PD-1], T cell immunoglobulin and mucin-containing molecule 3 [TIM-3], lymphocyte activation gene 3 [LAG-3], and T cell immunoglobulin and ITIM domain [TIGIT]). Conversely, VB3 exhibited no impact on the CD4+ regulatory T cell (Treg) components or DC subtypes within the tumor-infiltrated CD4+ T cells and DCs (Figures 3G and S3H). The activation, proliferation, exhaustion, or cytotoxic states of tumor-infiltrated CD4+ T cells and DCs remained unaffected by VB3 (Figures S3G and S3H). Moreover, immunostaining results showed an increase in cleaved caspase-3 and TUNEL, indicating that VB3 promoted the apoptosis of liver cancer cells in vivo (Figure 3E). These results suggested that VB3 supplementation led to fundamental remodeling of the TME through modulation of tumor-associated myeloid cells and CD8+ T cells.
To further assess the importance of CD8+ T cells in the antitumor efficacy of VB3, mice were treated with an anti-CD8 neutralization antibody in conjunction with VB3. Depletion of CD8+ T cells was found to eliminate the antitumor effect of VB3 in Hepa1-6 and LPC-H12 tumor models, confirming the cytotoxic role of CD8+ T cells in VB3 supplementation (Figures 3H and 3I). Indeed, it is interesting to note that, in the CD8+ T cells-depletion groups, where intratumor CD8+ T cells level was nearly underdetectable, there was still a noticeable inhibition of M2-like TAMs and G-MDSCs, as well as an increase in M1-like TAMs after VB3 intervention (Figure 3J). These findings suggest that CD8+ T cells play a crucial role in mediating the antitumor function of VB3, while the immunomodulation of tumor-associated myeloid cells may be responsible for this particular effect.
VB3 acts on tumor-associated myeloid cells to boost antitumor effect of CD8+ T cells
TAMs and G-MDSCs are recognized as two major subtypes of immunosuppressive myeloid cells that accumulate in liver cancer TME. They impair the antitumor function of CD8+ T cells by promoting anti-inflammatory factors and chemokines.17,18 The aforementioned findings led us to explore whether the increase of CD8+ T cells was related to VB3-mediated suppression of myeloid cells infiltration and polarization. To investigate the role of myeloid cells in VB3-treated mice, we used clodronate liposomes and anti-Ly6G neutralization antibody. Depletion of myeloid cells in the TME suppressed the tumor progression and increased the proportions and cytotoxic effect of CD8+ T cells in tumors, indicating the facilitating role of myeloid cells in liver cancer development (Figures 4A–4D). However, in myeloid cells-deleted mice, VB3 treatment no longer suppressed tumor progression and failed to elevate the infiltrated numbers and cytotoxic function of CD8+ T cells (Figures 4A–4D). Furthermore, we sorted the CD45+CD11b+ myeloid cells in tumor tissues by flow cytometry and evaluated their immunosuppressive status by quantitative reverse-transcription PCR (RT-qPCR) (Figures 4E–4G). In VB3-treated mice, there was a significant decrease in anti-inflammation factors (Arg-1, CD163, interleukin [IL]-10, and vascular endothelial growth factor [VEGF]) and myeloid cell recruitment-related chemokines (CCL2, CSF-1, CXCL1, CXCL2, and CXCL5). These results suggest that VB3 may activate CD8+ T cells by inhibiting immunosuppressive myeloid cells.
Figure 4.

VB3 acts on myeloid cells to boost antitumor effect of CD8+ T cells
(A and B) Tumor volumes (A) and tumor weights (B) were observed in VB3-treated mice after myeloid cells depletion (n = 6).
(C and D) The proportion (C) and cytotoxic function (D) of CD8+ T cells were explored (n = 6).
(E–G) The myeloid cells were sorted by flow cytometry in tumor tissues. The mRNA expression of Arg-1, CD163, IL-10, VEGF, CCL2, CSF-1, CXCL1, CXCL2, and CXCL5 was detected (n = 6).
(H) Primary BMDM, G-MDSC, or RAW264.7 were treated with LPC-H12 CM and VB3 for 12 h. The mRNA expression of Arg-1, CD163, IL-10, VEGF, CCL2, CSF-1, CXCL1, CXCL2, and CXCL5 was detected (n = 3).
(I and J) Primary BMDM and G-MDSC were treated with LPC-H12 CM and VB3 for 24 h. The polarization ratio of G-MDSCs or M1-like TAMs and M2-like TAMs were explored by flow cytometry. Representative gating images were shown (I). The polarization ratio was quantified (J, n = 3).
(K and L) Carboxyfluorescein succinimidyl ester (CFSE)-labeled CD8+ T cells were co-incubated with VB3-primed myeloid cells for 48 h. The proliferation rates of CD8+ T cells were detected by flow cytometry. Representative gating images were shown (K). The proliferation ratio was quantified (L, n = 4–5). Data are presented as means ± SEM. Experiments were conducted independently in triplicates or more. Statistical analysis was performed by two-way ANOVA (A), one-way ANOVA (B, C, D, H, J, and L), or Student’s t test (E–G). ns, p > 0.05; ∗, p < 0.05; ∗∗, p < 0.01; ∗∗∗, p < 0.001.
Next, we investigated the effect of VB3 on the polarization of myeloid cells in vitro. An LPC-H12 conditioned medium (CM) was employed to mimic the TME to treat primary bone marrow-derived macrophages (BMDM), G-MDSC, and RAW264.7 cell line with VB3. We found VB3 treatment decreased the mRNA expression of Arg-1, CD163, IL-10, VEGF, CCL2, CSF-1, CXCL1, CXCL2, and CXCL5 (Figure 4H). Flow cytometric analysis demonstrated that the CM induced the polarization of primary myeloid cells into immunosuppressive M2-like TAMs and G-MDSCs, whereas VB3 suppressed this immunosuppressive polarization (Figures 4I and 4J). Furthermore, we investigated the influence of VB3-educated G-MDSCs and TAMs on CD8+ T cells by co-culturing (Figures 4K and 4L). The results showed that VB3-educated G-MDSCs and TAMs promoted the proliferation of CD8+ T cells, indicating that VB3 abolished the immunosuppressive role of myeloid cells in the TME. Overall, our findings suggest that VB3 remodels the immunosuppressive TME mediated by tumor-associated myeloid cells to activate the antitumor effect of CD8+ T cells.
GPR109A is required for the antitumor effect of dietary VB3 supplementation
Given that GPR109A is identified as the receptor of VB3 and highly expressed in myeloid cells in vivo,19 we first analyzed the clinical relevance of GPR109A in liver cancer patients. Compared to early stage, the expression of GPR109A was gradually increased in advanced stages (Figure S4A). Kaplan-Meier analysis of The Cancer Genome Atlas data revealed that increased expression of GPR109A was associated with poor prognosis in liver cancer patients (Figure 5A), suggesting GPR109A may involve liver cancer progression. To determine which cell types express GPR109A in liver cancer TME, bioinformatic analysis of single-cell RNA sequencing data from 133 HCC samples revealed GPR109A was mainly expressed on myeloid cells compared to other immune cells (Figure S4B). In Hepa1-6 and LPC-H12 tumors, GPR109A was also highly expressed in tumor-infiltrated myeloid cells, while CD45− cells (major tumor cells) and other immune cells (CD45+CD11b−) showed low expression level of GPR109A (Figures 5B and 5O). Meanwhile, there was an accumulation of GPR109A+ myeloid cells in the TME with liver cancer progression (Figures 5C, 5D, and S4C). Furthermore, we analyzed the association between GPR109A expression, myeloid cells abundance, and patient prognosis via the Tumor Immune Estimation Resource (TIMER2.0) database. As expected, Kaplan-Meier analysis showed that high expression of GPR109A and increased infiltration of macrophages/MDSCs indicated a poor prognosis in liver cancer patients (Figure 5E). To elucidate the role of GPR109A in liver cancer progression, we utilized GPR109A-deficiency mice and a GPR109A blocker mepenzolate bromide (MPN). Both GPR109A deficiency and MPN treatment significantly slowed down tumor growth and reduced tumor weight (Figures 5I, 5J, 5L, and 5M). Flow cytometric analysis of the TME revealed a significant increase of CD8+ T cells and M1-like TAMs, as well as a dramatic decrease in G-MDSCs and M2-like TAMs in GPR109A-deficient or MPN-treated mice (Figures 5K and 5N). These results suggest GPR109A may play a role in shaping the immunosuppressive TME, making it a potential therapeutic target.
Figure 5.

GPR109A is required for the antitumor effect of VB3
(A) The Kaplan-Meier survival analysis for liver cancer patients based on GPR109A mRNA expression.
(B) The GPR109A expression on non-immune cells (CD45−), other immune cells (CD45+CD11b−), and myeloid cells (CD45+CD11b+) was detected by flow cytometry in tumor tissues (n = 6).
(C) The proportion of GPR109A+ myeloid cells in TME was explored at day 5, 10, and 15 after tumor implantation (n = 6).
(D) Representative images of CD11b and GPR109A staining in DEN+CCl4 model. Scar bar, 60μm.
(E) The Kaplan-Meier survival analysis for GPR109A expression and MDSCs or macrophages abundance of liver cancer patients.
(F) The GPR109A expression on myeloid cells were determined in DEN+CCl4-induced tumor tissues after VB3 treatment (n = 6).
(G and H) The mRNA expression (G, n = 6) and protein expression (H) of GPR109A in sorted tumor-associated myeloid cells were explored.
(I–K) Tumor volumes (I) and tumor weights (J) in WT and GPR109A−/− mice were observed after VB3 treatment (n = 6). The frequency of infiltrated immune cells in TME was analyzed (K).
(L–N) Tumor volumes (L) and tumor weights (M) in WT mice were observed with VB3 and MPN treatment (n = 6). The frequency of different infiltrated immune cells in TME was analyzed (N).
(O) Representative gating images of GPR109A expression on CD45− cells, CD45+CD11b− cells, and CD45+CD11b+ cells. Data are presented as means ± SEM. Experiments were conducted independently in triplicates or more. Statistical analysis was performed by one-way ANOVA (B, C, J, K, M, and N), Student’s t test (F and G), or two-way ANOVA (I and L). ns, p > 0.05; ∗, p < 0.05; ∗∗, p < 0.01; ∗∗∗, p < 0.001.
Next, we investigated the impact of VB3 treatment on GPR109A in the TME. In DEN+CCl4-induced tumors, there was a significant decrease of GPR109A+ myeloid cells after VB3 treatment (Figure 5F). Immunostaining of GPR109A and CD11b in tumor tissues also confirmed this finding (Figure 5D). Western blot and RT-qPCR analysis of sorted tumor-associated myeloid cells verified the downregulated mRNA and protein expression of GPR109A in tumors from VB3-treated mice (Figures 5G and 5H). In vivo, both GPR109A deficiency and MPN treatment abolished the VB3-mediated tumor inhibition (Figures 5I, 5J, 5L, and 5M). Consistently, flow cytometry analysis showed that GPR109A deficiency or MPN treatment abolished the VB3-mediated increase of CD8+ T cells and M1-like TAMs, as well as the decrease of M2-like TAMs and G-MDSCs in the TME (Figures 5K and 5N). Based on these results, we speculate that GPR109A is required for the antitumor effect of dietary VB3 supplementation.
Biased β-Arrestin/GPR109A axis activation in myeloid cells is responsible for antitumor effect of VB3
To further verify the role of GPR109A and downstream signaling responsible for the regulation of VB3 on myeloid cells, we isolated primary G-MDSC and BMDM and used the RAW264.7 cell line. In normal myeloid cells, VB3 had no impact on the GPR109A expression and inflammatory status (Figures 6A and S5A). In contrast, the increased mRNA and protein expression of GPR109A induced by CM was significantly inhibited after VB3 intervention (Figures 6A and 6B). Compared to normal myeloid cells, VB3 effectively suppressed the immunosuppressive polarization of CM-treated myeloid cells (Figures 6C and 6D). To elucidate the differential effects of VB3 on normal and CM-stimulated myeloid cells, the classical cyclic AMP (cAMP)/protein kinase A (PKA), extracellular signal-regulated kinase (ERK), and biased β-Arrestin axis in cells were explored, which have been identified as the downstream signaling pathway after GPR109A activation.20 In addition, nuclear factor κB (NF-κB) signaling was also observed, which has been proven to regulate GPR109A expression and inflammatory responses in macrophages.21,22 As indicated in the normal myeloid cells, we found a decrease of the cAMP level after VB3 treatment (Figure S5B). Consistently, VB3 decreased the downstream P-PKA expression and increased P-ERK expression, where P-P65 was not affected, suggesting VB3 activated classical inhibitory G protein (Gi) signaling in normal myeloid cells without affecting the NF-κB axis (Figure S5C). In contrast, in CM-treated myeloid cells, CM alone was sufficient to suppress the cAMP level and VB3 could not further affect the cAMP level (Figure S5B). Accordingly, the CM-induced downregulated P-PKA expression and upregulated P-ERK expression were not impacted after VB3 intervention, whereas VB3 inhibited the CM-mediated upregulated P-P65 expression (Figures 6B and S5D). These results indicated that VB3 could not further activate classical Gi signaling but specifically suppressed NF-κB signaling in tumor-associated myeloid cells. This discrepancy could be closely related to the GPR109A activation that was profoundly influenced by cellular context.
Figure 6.

Biased β-Arrestin/GPR109A axis activation in myeloid cells is responsible for antitumor effect of VB3
(A) Myeloid cells from WT mice or RAW264.7 were treated with/without LPC-H12 CM and VB3 for 12 h. The GPR109A mRNA expression in cells was detected (n = 3).
(B) Myeloid cells from WT mice or RAW264.7 were treated with LPC-H12 CM and 50 μM VB3 for 0, 3, 6, 12, and 24 h. The protein expression of GPR109A, P-P65, and P65 was detected.
(C and E) Myeloid cells from WT or GPR109A−/− mice were treated with/without Hepa1-6 CM and VB3 (50 μM) for 12 h. The mRNA expression of GPR109A, Arg-1, IL-10, VEGF, CCL2, CSF-1, CXCL1, CXCL2, and CXCL5 was explored (C, n = 3). The protein expression of GPR109A, P-P65, and P65 was detected (E).
(D and F) Myeloid cells from WT mice were treated with MPN (50 μM) previously for 4 h and treated with Hepa1-6 CM and VB3 (50 μM) for another 12 h. The mRNA expression of GPR109A, Arg-1, IL-10, VEGF, CCL2, CSF-1, CXCL1, CXCL2, and CXCL5 was detected (D, n = 3). The protein expression of GPR109A, P-P65, and P65 was evaluated (F).
(G–I) Scheme of myeloid cells treatment and coincubation. Myeloid cells from WT mice were previously stimulated with CM for 12 h before treatment with VB3 (50 μM), ACTD (50 μM), and CHX (50 μM) for another 12 h (G). The mRNA expression (H, n = 3) and protein expression (I) of GPR109A were detected.
(J) Myeloid cells from WT mice were treated with LPC-H12 CM and VB3 for 12 h. The binding between GPR109A and β-Arrestin1or β-Arrestin2 was determined.
(K and L) β-Arrestin1/2-knockdown RAW264.7 cells were treated with LPC-H12 CM and VB3 (50 μM) for 12 h. The mRNA expression of GPR109A, Arg-1, IL-10, VEGF, CCL2, CSF-1, CXCL1, CXCL2, and CXCL5 was detected (K). The protein expression of GPR109A, P-P65, and P65 was explored (L). Data are presented as means ± SEM. Experiments were conducted independently in triplicates or more. Statistical analysis was performed by one-way ANOVA. ns, p > 0.05; ∗, p < 0.05; ∗∗, p < 0.01; ∗∗∗, p < 0.001.
Because biased β-Arrestin1/2 act as regulators of GPR109A activation and degradation, as well as function to inhibit NF-κB pathway activation,23,24,25 our focus shifted to the β-Arrestin axis. Although VB3 had little effect on the β-Arrestin1/2 expression in CM-treated myeloid cells (Figure S5D), the coimmunoprecipitation assay showed that VB3 enhanced the binding of β-Arrestin1/2 with GPR109A, suggesting that VB3 facilitated the activation of the biased Gi axis in the TME (Figure 6J). Further exploration of the relationship between GPR109A, β-Arrestin1/2, and NF-κB signaling in CM-treated myeloid cells with VB3 intervention was conducted by the use of GPR109A−/− mice, GPR109A blocker MPN, NF-κB inhibitor JSH-23, and β-Arrestin1/2-small interfering RNA. After GPR109A deletion, the increased immunosuppressive polarization and P-P65 expression in CM-treated wild-type (WT) myeloid cells were markedly attenuated in CM-treated GPR109A−/− myeloid cells (Figures 6C and 6E). This finding was further confirmed in MPN-treated WT myeloid cells (Figures 6D and 6F). Moreover, JSH-23 significantly inhibited the GPR109A expression and downstream inflammatory responses in CM-treated myeloid cells (Figures S5E and S5F), consistent with previous studies that the NF-κB axis regulated GPR109A expression and inflammatory responses.21 These effects of JSH-23 on CM-treated myeloid cells were no longer existed following GPR109A depletion (Figures S5E and S5F). The aforementioned results indicated that liver cancer TME may activate the GPR109A/NF-κB P65 axis to create a positive feedback loop to promote the immunosuppressive polarization of myeloid cells. In GPR109A-deleted or GPR109A-blocked myeloid cells, VB3 no longer decreased the protumor polarization and NF-κB signaling activation in CM-treated myeloid cells (Figures 5C–5F), indicating the downregulated GPR109A/NF-κB P65 axis was responsible for the antitumor effect of VB3. After knocking down β-Arrestin1/2 in myeloid cells, VB3 also exerted no effect on suppressing CM-induced GPR109A upregulation, NF-κB axis activation, and immunosuppression polarization (Figures 5K, 5L, and S5G), which was in line with the previous finding that β-Arrestin inhibited NF-κB activity.24,25 Thus, the aforementioned results indicated β-Arrestin was important for VB3-mediated inhibition of the GPR109A/NF-κB P65 axis.
Based on our in vivo and in vitro experiments, we observed that VB3 decreased both mRNA and protein expression of GPR109A in tumor-associated myeloid cells. We were interested in determining whether VB3-induced downregulation of GPR109A protein expression was solely attributed to the reduced transcription and subsequent translation of GPR109A mRNA or it also involved β-Arrestin-mediated GPR109A degradation. The transcription inhibitor actinomycin-D (ACTD) and protein synthesis inhibitor cycloheximide (CHX) were employed. Myeloid cells were previously stimulated with CM for 12 h to activate GPR109A expression and then treated with VB3/ACTD/CHX (Figure 6G). In ACTD-treated myeloid cells, VB3 could not further suppress the GPR109A mRNA expression, whereas the decreased GPR109A protein expression induced by VB3 was still existed (Figures 6H and 6I), indicating that VB3-downregulated GPR109A protein expression was dependent of GPR109A translation. In CHX-treated myeloid cells, CHX failed to block the VB3-induced inhibition of GPR109A mRNA and protein expression (Figures 6H and 6I), eliminating the possibility that the VB3-mediated downregulated GPR109A protein totally relied on protein synthesis. Therefore, we speculated that β-Arrestin-mediated GPR109A degradation was also essential for the antitumor effect of VB3.
To further understand the importance of the biased β-Arrestin axis in the antitumor effect of VB3, we conducted a comparative analysis using a partial GPR109A agonist MK-0354 and GPR109A antagonist MPN. Given that VB3 is identified as a full GPR109A agonist, MK-0354 only activates the classical Gi signaling without affecting the β-Arrestin pathway, while MPN blocks GPR109A-mediated downstream signaling activation.26 We found MK-0354 treatment did not suppress liver cancer progression and had no impact on tumor-infiltrated CD8+ T cells, G-MDSCs, M1-like TAMs, and M2-like TAMs compared to VB3 or MPN (Figures S6A and S6B). Meanwhile, the antitumor immunity of MPN was inferior to that of VB3 (Figures S6A and S6B). In vitro experiments demonstrated that MK-0354 had no impact on CM-mediated GPR109A upregulation, NF-κB axis activation, and immunosuppression polarization of tumor-associated myeloid cells (Figures S6C and S6D). These results suggest that biased β-Arrestin activation-mediated GPR109A degradation and downstream NF-κB P65 inhibition are important for the antitumor immunity of VB3 against liver cancer.
VB3 augments the immune/targeted therapy against liver cancer
The unresponsiveness and resistance to immune/targeted therapy present substantial challenges in the clinical treatment of liver cancer.4 Patients with targeted/immune-resistant liver cancer often have an immunosuppressive TME, characterized by a lack of the antitumor CD8+ T cells, or an abundance of tumor-promoting myeloid cells.2 Our findings demonstrated that VB3 can reshape the immunosuppressive TME mediated by tumor-associated myeloid cells and promote antitumor immunity of CD8+ T cells. This raises the hypothesis that VB3 may enhance the efficacy of immune checkpoint blockade or targeted therapy. To investigate this, we conducted experiments combining VB3 with anti-PD-L1 antibody or lenvatinib in Hepa1-6 and LPC-H12 models. Compared to treatment with anti-PD-L1 or lenvatinib treatment alone, the combined treatment induced a marked regression of tumor growth and tumor weight (Figures 7A, 7B, 7D, and 7E), indicating a synergistic antitumor effect of VB3. In the immunotherapy models, flow cytometry analysis of tumor-infiltrated immune cells revealed an increase in CD8+ T cells and M1-like TAMs and a decrease in G-MDSCs and M2-like TAMs in mice tumor tissues treated with anti-PD-L1 antibody alone (Figure 7C). Importantly, these effects were dramatically amplified in the combination group (Figure 7C). In the targeted therapy models, lenvatinib treatment alone had minimal effect on immune cell populations, except for an increase in G-MDSCs in Hepa1-6 tumors; however, the combination treatment resulted in the increase of CD8+ T cells and M1-like TAMs in the TME compared to VB3 or lenvatinib treatment alone (Figure 7F). These results provide evidence of a potent synergy between VB3 and PD-L1 blockade or lenvatinib in sensitizing targeted/immune refractory liver cancer.
Figure 7.

VB3 augments the immune/targeted therapy against liver cancer
(A–C) Tumor volumes (A) and tumor weights (B) were observed (n = 6) with/without VB3 and anti-PD-L1 antibody treatment. The frequency of infiltrated immune cells in TME was analyzed (C, n = 6).
(D–F) Tumor volumes (D) and tumor weights (E) were measured (n = 8–9) with/without VB3 and lenvatinib treatment. The frequency of different infiltrated immune cells in the TME was explored (F, n = 7–8). Data are presented as means ± SEM. Experiments were conducted independently in triplicates or more. Statistical analysis was performed by two-way ANOVA (A and D) or one-way ANOVA (B, C, E, and F). ns, p > 0.05; ∗, p < 0.05; ∗∗, p < 0.01; ∗∗∗, p < 0.001.
Discussion
There is a growing interest in elucidating the relationship between diet and health, particularly how it may affect cancer.9 The concept that dietary changes can potentially hinder tumor progression and improve response to cancer treatment is highly appealing to cancer patients.9,27 However, there is limited compelling evidence supporting the use of dietary interventions for cancer prevention and treatment, and the underlying mechanisms are still being explored. Here, our study demonstrated that VB3, a commonly used dietary supplementation, can rescue the compromised antitumor immunity by eliminating the immunosuppressive TME induced by GPR109A+ myeloid cells in liver cancer. These led to an enhancement in the antitumor function of CD8+ T cells and improved immune/targeted therapeutic against liver cancer. Mechanistically, TME upregulated GPR109A expression and activated downstream NF-κB axis in tumor-associated myeloid cells, promoting their immunosuppressive polarization. In contrast, VB3 activated biased GPR109A/β-Arrestin axis in intratumor myeloid cells to degrade GPR109A and inhibited downstream NF-κB pathway, thereby eliminating the immunosuppression of the TME. These findings indicate that VB3 has the potential as an adjunctive therapy for preventing liver cancer progression. Our results also contribute to a better understanding of how vitamins are mechanistically linked to cancer.
The local nutrient availability in TME greatly influences tumor development and therapeutic response.28 Vitamins, as important components of dietary interventions, play multiple roles in cancer progression and therapy. On one hand, restriction of certain vitamins, such as VB5 and VB6, can impede cancer-related metabolic pathways.6,29 For example, VB5 supports myelocytomatosis viral oncogene homolog (MYC) oncogenic metabolism in breast cancer progression,29 while restricting VB6 can suppress NK cells cytotoxicity in pancreatic ductal adenocarcinoma cells.6 Limitation of VB5 or VB6 in specific cancers may effectively reduce tumor burden and augment the therapeutic effect of clinical treatment. On the other hand, deficiencies in certain vitamins, including VB9, VB12, VB6, and vitamin C (VC), can cause DNA damage and contribute to the development of cancer.30 These findings suggest that vitamins can have contradictory functions in certain types of cancer. In our study, we observed a deficiency of B group vitamins, especially VB3, in digestive cancer patients. Higher intake of VB3 effectively reduced the risk of liver cancer, and dietary supplementation of VB3 was positively associated with improved cancer prognosis, consistent with other cohort studies.31 Furthermore, we confirmed the antitumor effect of dietary VB3 supplementation against liver cancer in multiple mouse models. Although nutrients originate from diverse foods and diets, examining individual nutrients can help identify the molecular mechanisms underlying nutritional influences on human health and disease, as well as effectiveness of therapies.
The crosstalk between tumor cells and immune cells within the TME is a crucial factor in tumor progression and response to treatment.32 Tumor-associated myeloid cells are the most abundant immune cells in the TME and account for nearly 50% of the total tumor mass in solid tumors.33,34 The accumulation of myeloid cells suppresses the antitumor role of CD8+ T cells and NK cells, facilitates the accumulation of Treg cells, and hinders antigen presentation of DCs. These create an immunosuppressive TME that promotes immune escape and liver cancer progression.35 Moreover, myeloid cells contribute to the resistance of current antitumor strategies, including chemotherapy, targeted therapy, and immunotherapy.36 This resistance is partly due to the release of chemokines and anti-inflammatory factors, which activate and recruit immunosuppressive cells like MDSCs, Treg, and TAMs, thereby evading immune surveillance.33,37 Recently, therapeutic strategies targeting myeloid cells have been proposed, involving modulation of their functional activities, recruitment, and survival through targeting specific cell surface receptors, epigenetic machinery, or metabolic regulators.38 However, the high heterogeneity of myeloid cell subsets and the lack of uniform markers for these subsets pose challenges in implementing these approaches.32,33 Therefore, understanding the functional heterogeneity of tumor-associated myeloid cells is crucial for deciphering their role in the TME and developing new immunotherapy strategies for cancer. In our research, we identified a subpopulation of myeloid cells, known as GPR109A+ myeloid cells, which contributed to the formation of immunosuppressive TME and were closely associated with poor prognosis of liver cancer patients. Genetic deletion or pharmacological blockade of GPR109A both effectively promoted the antitumor effect of CD8+ T cells and inhibited cancer progression by inhibiting immunosuppressive polarization and recruitment of G-MDSCs and M2-TAMs. GPR109A controlled the polarization status of these myeloid cells by regulating the expression of Arg-1, IL-10, VEGF, CCL2, CSF-1, CXCL1, CXCL2, and CXCL5. Moreover, targeting GPR109A with VB3 enhanced the efficacy of immune/targeted therapy against liver cancer. Therefore, GPR109A can be considered a biomarker for immunosuppressive myeloid cells and potential therapeutic target for activating specific T cell immunity in liver cancer treatment.
VB3, which is used as a pharmacological agent for the treatment of cardiovascular diseases in clinical practice,39 has also shown efficacy in preclinical studies of various diseases, including obesity, hepatic steatosis, and colitis.14,40,41 VB3 possesses anti-inflammatory properties by downregulating the expression of IL-1β, IL-6, IL-10, VEGF, and CCL2 in macrophages.14,40 However, previous research has also demonstrated that VB3 can stimulate proinflammatory properties to suppress brain tumors via upregulation of IFN-14 in myeloid cells.42 In the context of liver cancer, the TME educates infiltrated myeloid cells to polarize into M2-like TAMs and G-MDSCs, which contribute to the construction of an immunosuppressive microenvironment. However, our study showed that VB3 supplementation can overcome the compromised immunity induced by tumor-educated myeloid cells and activated the antitumor function of CD8+ T cell against liver cancer. The crucial role of myeloid cells in mediating the benefits of VB3 was confirmed by the loss of VB3 efficacy in mice depleted of myeloid cells. Moreover, we identified GPR109A on myeloid cells as responsible for the effect. We found that GPR109A regulated the anti-inflammatory function of tumor-associated myeloid cells, consistent with previous studies showing that GPR109A signaling promotes anti-inflammatory properties in macrophages and dendritic cells.19 VB3 reduced the expression of GPR109A on myeloid cells by activating biased GPR109A/β-Arrestin1/2 interaction in the TME. Blocking GPR109A by genetic deletion or small-molecule blocker abolished the antitumor immunity induced by VB3.
In summary, our research uncovers the immune-modulatory activity of VB3 in the TME. Dietary supplementation of VB3 enhances the antitumor responses of adaptive immunity by counteracting immunosuppressive myeloid cells and improves the efficacy of immune/targeted therapy. These findings establish a mechanistic link between dietary vitamins supplementation and cancer progression, suggesting that VB3 could be readily translated into clinical use as an adjunctive treatment for liver cancer.
Limitations of the study
Several limitations should be acknowledged. While our findings demonstrate a reduction in liver cancer risk with high VB3 intake in two separate cohorts, the prevention and treatment effect of VB3 against liver cancer based on our preclinical findings is still lacked with supporting evidence from clinical trial. Besides, the more detailed mechanism of how the TME increases GPR109A expression and downstream NF-κB axis is unknown and needs further explorations. Moreover, the murine liver cancer models in our study are based on carcinogen-induced liver neoplasia and transplantable syngeneic liver tumors; both of them cannot provide insights to recapitulate spontaneous development of liver cancer. Thus, a genetically engineered mouse model (hepatic PTEN knockout mice [HepPten−/−]) of liver cancer is still needed to evaluate the prevention function of VB3 in the future study.
Resource availability
Lead contact
Further information and requests for resources and reagents should be directed to and will be fulfilled by the lead contact, Hui Wang (huiwang@shsmu.edu.cn).
Materials availability
This study did not generate new unique reagents.
Data and code availability
-
•
This paper analyzes existing, publicly available data. These accession numbers for the datasets are listed in the key resources table.
-
•
This paper does not report original code.
-
•
Any additional information required to reanalyze the data reported in this paper is available from the lead contact upon request.
Acknowledgments
This work was supported by grants from the National Natural Science Foundation of China (82030099 and 81972820), the National Key R&D Program of China (2022YFD2101500), Shanghai Public Health System Construction Three-Year Action Plan (GWVI-11.1-43 and GWVI-11.1-22), the China Postdoctoral Science Foundation (2022T150421 and 2022M712105), the Science and Technology Commission of Shanghai Municipality (22DZ2303000), Natural Science Foundation of Shanghai (23ZR1435900), the Innovative research team of high-level local universities in Shanghai, and Shanghai Jiao Tong University Key Program of Medical Engineering (YG2021ZD01). We appreciate the participants in UK Biobank for their participation and contribution to the research. The study has been conducted using the UK Biobank Resource under Application 194423.
Author contributions
Y.Y., X.L., Q.B., and H.W. conceived and designed experiments. Y.Y. and X.L. analyzed data and wrote the manuscript. H.W. supervised the project. Y.Y., T.P., and Y.L. performed all the experiments. X.H. performed bioinformatic analysis. Y. Huang. and T.W. helped with epidemiology study. C.L., F.C., B.G., and Y. Hong. helped with the sample collection. All authors reviewed and approved the manuscript.
Declaration of interests
The authors declare no competing interests.
STAR★Methods
Key resources table
| REAGENT or RESOURCE | SOURCE | IDENTIFIER |
|---|---|---|
| Antibodies | ||
| InVivoMAb anti-mouse CD8α | BioXcell | Cat# BE0061; RRID: AB_1125541 |
| InVivoMAb anti-mouse Ly6G | BioXcell | Cat# BE0075-1; RRID: AB_1107721 |
| InVivoMAb anti-mouse PDL1 | BioXcell | Cat# BE0101; RRID: AB_10949073 |
| InVivoMAb rat IgG2a isotype control | BioXcell | Cat# BE0089; RRID: AB_1107769 |
| InVivoMAb rat IgG2b isotype control | BioXcell | Cat# BE0090; RRID: AB_1107780 |
| Fixable Viability Stain 780 | BD Biosciences | Cat# 565388; RRID: AB_2869673 |
| Fixable Viability Stain 510 | BD Biosciences | Cat# 564406; RRID: AB_2869572 |
| Mouse anti-CD16/32 | BD Biosciences | Cat# 553141; RRID: AB_394656 |
| Mouse CD45 FITC | BD Biosciences | Cat# 553080; RRID: AB_394609 |
| Mouse CD4 APC | BD Biosciences | Cat# 553051; RRID: AB_398528 |
| Mouse CD11 b PE | BD Biosciences | Cat# 553311; RRID: AB_396680 |
| Mouse CD3e BV421 | BD Biosciences | Cat# 562600; RRID: AB_11153670 |
| Mouse NK1.1 PE | BD Biosciences | Cat# 553165; RRID: AB_396674 |
| Mouse CD11C APC | BD Biosciences | Cat# 550261; RRID: AB_398460 |
| Mouse MHC II PercpCy5.5 | BD Biosciences | Cat# 562363; RRID: AB_11153297 |
| HM74A APC | R&D Systems | Cat#FAB2760A; RRID: AB_573115 |
| Mouse CD8α BV421 | Biolegend | Cat# 100738; RRID: AB_11204079 |
| Mouse Ly6G PE-Cy7 | Biolegend | Cat# 127618; RRID: AB_1877261 |
| Mouse F4/80 BV421 | Biolegend | Cat# 123132; RRID: AB_11203717 |
| Mouse CD206 APC | Biolegend | Cat# 141708; RRID: AB_10900231 |
| Mouse Ly6C APC | Biolegend | Cat# 128016; RRID: AB_1732076 |
| Mouse PD-1 PE | Biolegend | Cat#109103; RRID: AB_313420 |
| Mouse Tim-3 BV421 | Biolegend | Cat#119723; RRID: AB_2616908 |
| Mouse Lag-3 PE-Cy7 | Biolegend | Cat#125226; RRID: AB_2715764 |
| Mouse TIGIT APC | Biolegend | Cat#156106; RRID: AB_2750515 |
| Mouse IgG2b APC | Biolegend | Cat#403806; RRID: AB_3096358 |
| Mouse CD8α BV785 | Biolegend | Cat#100750; RRID: AB_2562610 |
| Mouse Ki-67 PE-Cy7 | Biolegend | Cat#652426; RRID: AB_2632694 |
| Mouse FOXP3 PE | Biolegend | Cat#126404; RRID: AB_1089117 |
| Mouse CD44 APC-Cy7 | Biolegend | Cat#103028; RRID: AB_830785 |
| Mouse CD62L PercpCy5.5 | Biolegend | Cat#104432; RRID: AB_2285839 |
| Mouse CD279 APC-Cy7 | Biolegend | Cat#135224; RRID: AB_2563523 |
| Mouse CD366 PE | Biolegend | Cat#119704; RRID: AB_345378 |
| Mouse CD223 PercpCy5.5 | Biolegend | Cat#125212; RRID: AB_2561517 |
| Mouse TIGIT PE-Cy7 | Biolegend | Cat#142108; RRID: AB_2565649 |
| Mouse IFN-γ APC-Cy7 | Biolegend | Cat#505850; RRID: AB_2616698 |
| Mouse Granzyme B PE-Cy7 | Biolegend | Cat#372214; RRID: AB_2728381 |
| Mouse TNF-α PercpCy5.5 | Biolegend | Cat#506322; RRID: AB_961434 |
| Mouse Perforin PE | Biolegend | Cat#154406; RRID: AB_2721641 |
| Mouse CD11c APC | Biolegend | Cat#117310; RRID: AB_313779 |
| Mouse I-A/I-E PercpCy5.5 | Biolegend | Cat#107626; RRID: AB_2191071 |
| Mouse XCR1 PE | Biolegend | Cat#148204; RRID: AB_2563843 |
| Mouse CD172a APC-Cy7 | Biolegend | Cat#144018; RRID: AB_2629558 |
| Mouse CD80 BV421 | Biolegend | Cat#104726; RRID: AB_2561445 |
| Mouse CD86 BV605 | Biolegend | Cat#105037; RRID: AB_11204429 |
| Mouse CD274 BV785 | Biolegend | Cat#124331; RRID: AB_2629659 |
| Anti-mouse CD3e antibody | Biolegend | Cat# 100359; RRID: AB_2616673 |
| Anti-mouse CD28 antibody | Biolegend | Cat# 102121; RRID: AB_2810330 |
| Anti-HM74 antibody | Santa Cruz | Cat# sc-377292; RRID: AB_2942072 |
| Anti-β-arrestin1 antibody | Santa Cruz | Cat#sc-53780; RRID: AB_781486 |
| Anti-β-arrestin2 antibody | Santa Cruz | Cat#sc-365445; RRID: AB_10841589 |
| Anti-β-arrestin2 antibody | Santa Cruz | Cat#sc-13140; RRID: AB_626701 |
| Anti-CD8α antibody | Servicebio | Cat# GB11068; RRID: AB_2905511 |
| Anti-INOS antibody | Abcam | Cat# ab15323; RRID: AB_301857 |
| Anti-AFP antibody | Proteintech | Cat#14550-1-AP; RRID: AB_2223933 |
| Anti-GPR109A antibody | Novus | Cat# NBP1-92180; RRID: AB_11039155 |
| Anti-GPR109A antibody | Cohesion Bio | Cat# CPA6195; RRID: AB_3096221 |
| Anti-Ly6G antibody | CST | Cat# 87048; RRID: AB_2909808 |
| Anti-Arg-1 antibody | CST | Cat# 93668; RRID: AB_2800207 |
| Anti-Ki67 antibody | CST | Cat#12202; RRID: AB_2620142 |
| Anti-Cleaved Caspase-3 Antibody | CST | Cat#9661; RRID: AB_2341188 |
| Anti-Phospho-ERK1/2 antibody | CST | Cat# 9101S; RRID: AB_331646 |
| Anti-ERK1/2 antibody | CST | Cat# 9102S; RRID: AB_330744 |
| Anti-β-arrestin1 antibody | CST | Cat#12697S; RRID: AB_2797996 |
| Anti-NF-κB p65 antibody | CST | Cat# 4764; RRID: AB_823578 |
| Anti-Phospho-NF-κB p65 antibody | CST | Cat# 3033; RRID: AB_331284 |
| Anti-Phospho-PKA C antibody | CST | Cat#4781; RRID: AB_2300165 |
| PKA C-α Antibody antibody | CST | Cat#4782; RRID: AB_2170170 |
| Anti-GAPDH antibody | CST | Cat# 2118L; RRID: AB_561053 |
| Anti-rabbit IgG HRP-linked | CST | Cat# 7074S; RRID: AB_2099233 |
| Anti-mouse IgG HRP-linked | CST | Cat# 7076S; RRID: AB_330924 |
| Chemicals, peptides, and recombinant proteins | ||
| Mouse GM-CSF | Novoprotein | Cat# CK02 |
| Mouse G-CSF | Novoprotein | Cat# CB53 |
| Mouse M-CSF | Novoprotein | Cat# CB34 |
| Mouse IL-2 | Novoprotein | Cat# CK24 |
| Vitamin B3 | Sigma | Cat#N4126-100G |
| Lenvatinib | Psaitong | Cat# L10232 |
| Mepenzolate bromide | Sigma | Cat# M5651 |
| Actinomycin D | MCE | Cat#HY-17559 |
| MK-0354 | MCE | Cat#HY-13008 |
| Cycloheximide | MCE | Cat#HY-12320 |
| JSH-23 | Selleck | Cat#S7351 |
| Diethylnitrosamine | Meilun Biotech | Cat# 55-18-5 |
| Carbon tetrachloride | Sibas | Cat# H1S0670 |
| Critical commercial assays | ||
| DMEM | Thermo Fisher | Cat# 11965118 |
| RMPI 1640 | Thermo Fisher | Cat# 11875119 |
| IMDM | Thermo Fisher | Cat# 12440061 |
| MEM | Gibco | Cat# 41500034 |
| FBS | Gibco | Cat# 10091148 |
| Matrigel | Corning | Cat# 354248 |
| Clodronate liposomes | FormuMax | Cat# F70101C-N |
| CellTrace™ CFSE Kit | Thermo Fisher | Cat# C34554 |
| Mouse CD8+ T cell Isolation Kit | Stemcell Tech | Cat# 19853 |
| Mouse Tumor Dissociation Kit | Miltenyibiotech | Cat# 130-096-730 |
| Cell Counting Kit-8 | MCE | Cat#HY-K0301 |
| Lipofectamine® RNAiMAX | Thermo Fisher | Cat# 13778075 |
| DAPI Fluoromount-G | SouthernBiotech | Cat#0100-20 |
| TUNEL Apoptosis Assay Kit | Beyotime | Cat#C1086 |
| cAMP Parameter Assay Kit | R&D | Cat#KGE002B |
| BD Pharmingen™ Transcription Factor Buffer Set | BD Pharmingen | Cat#562574 |
| Cytofix/Cytoperm™ Fixation/Permeabilization Kit | BD Pharmingen | Cat#554714 |
| BD Pharmingen™ Leukocyte Activation Cocktail | BD Pharmingen | Cat#550583 |
| Deposited data | ||
| NHANES | NHANES | https://www.cdc.gov/nchs/nhanes/index.htm |
| UK Biobank | UK Biobank |
https://www.ukbiobank.ac.uk/ Application ID: 194423 |
| TCGA | Genomic Data Commons Data Portal |
https://portal.gdc.cancer.gov |
| TIMER2.0 | TIMER2.0 | http://timer.cistrome.org/ |
| Kaplan-Meier Plotter | Kaplan-Meier Plotter | https://www.kmplot.com/analysis/ |
| OncoDB | OncoDB | https://oncodb.org/ |
| GepLiver | GepLiver | http://www.gepliver.org/ |
| Experimental models: Cell lines | ||
| Hepa1-6 | ATCC | Cat#CRL-1830 |
| LPC-H12 | Cell Bank of Shanghai Institutes for Biological Sciences | N/A |
| H22 | Cell Bank of Shanghai Institutes for Biological Sciences | N/A |
| RAW264.7 | Cell Bank of Shanghai Institutes for Biological Sciences | Cat#TCM13 |
| Experimental models: Organisms/strains | ||
| C57BL/6 mice | Shanghai Slac Laboratory Animal Co. | N/A |
| BALB/C mice | Shanghai Slac Laboratory Animal Co. | N/A |
| GPR109A−/− C57BL/6 mice | Cyagen Biosciences | Cat#S-KO-15323 |
| Oligonucleotides | ||
| Arrb1-siRNA: CCUACAAAGUCAAGGUGAATT |
This paper | N/A |
| Arrb2-siRNA: CCUACAGGGUCAAGGUGAATT |
This paper | N/A |
| Negative control-siRNA: UUCUCCGAACGUGUCACGUTT |
This paper | N/A |
| Primers used for RT-qPCR | This paper | Table S3 |
| Software and algorithms | ||
| TCGAbiolinks | TCGAbiolinks | https://www.bioconductor.org/packages/release/bioc/html/TCGAbiolinks.html |
| GraphPad Prism Version 9.0 | GraphPad Software | https://www.graphpad.com/ |
| FlowJo_V10 | FlowJo Software | https://www.flowjo.com/ |
| R version 4.3.3 | The R Foundation | https://www.r-project.org/ |
| ImageJ | ImageJ Software | https://imagej.net/ |
Experimental model and study participant details
Human data
The first epidemiology study in this study were obtained from National Health and Nutrition Examination Survey (NHANES) conducted by the National Center for Health Statistics (NCHS). Information on the intake and supplement of B group vitamins was collected from the dietary recall questionnaire. The NHANES protocols were approved by the Ethics Review Board of the National Center for Health Statistics, and participants provided informed consent. Participants who self-reported being diagnosed with one or more types of cancer were classified as cancer survivors, while those reporting no cancer diagnosis were considered non-cancer individuals. Participants with digestive system cancers, including colorectal, esophageal, gallbladder, liver, pancreatic, and gastric cancers, were specialized categorized as having digestive system cancer. Mortality data, obtained from NCHS and linked to the National Death Index, were available until December 31, 2019. The International Statistical Classification of Diseases and Related Health Problems and Tenth Revision (ICD-10) was used to record the underlying cause of death, particularly for cancer-related mortality (ICD-10 codes C00-C97). For participants without cancer, the follow-up duration was defined as the time between the follow-up date and either the date of death or December 31, 2019, measured in years. All analyses considered the complex sampling of NHANES and were weighted to ensure national representativeness. Group differences were estimated using t-tests and chi-square tests, while association analysis was performed using multivariable logistic regression and generalized additive models. The covariates adjusted for in the analysis included age, gender, and race. The Kaplan-Meier curves were constructed for survival analysis to assess the prognosis of cancer survivors. All analyses were conducted using R version 4.3.3, with two-sided tests and significance set at p < 0.05. Inclusion and exclusion criteria are showed in Figure S1A. The Baseline characteristics were provided in Table S1.
The second epidemiology study in this study were obtained from the UK Biobank (Application ID: 194423). In our analysis, participants were excluded if they met the following criteria: 1) identified with cancer at baseline (defined as completing the last round of 24-h dietary recall), including those who had been diagnosed with cancer corresponding to ICD codes C00-C97, based on health outcome data linked to hospital admission records, primary care, or death records in the UK Biobank (n = 24,394), or self-reported a history of cancer during the baseline oral interview (n = 20,215); 2) no or only one round of 24-h dietary recall data that reported typical diet (n = 362,880); 3) Missing covariate data (n = 10,279). Finally, a total of 84,476 participants were included for analysis. The included participants were divided into two groups based on median intake of VB3. The t-tests and rank sum tests were used to estimate differences between two group. The association between VB3 intake and the incidence of liver cancer was analyzed using a multivariate Cox regression model, with Model 1 adjusting for covariates of age, gender, ethnicity, and alcohol intake, and Model 2 further adjusting for BMI, Townsend deprivation index, smoking frequency, and educational level. All analyses were conducted using R version 4.3.3, with statistical tests being two-sided and significance set at p < 0.05. Inclusion and exclusion criteria are showed in Figure S1B. The Baseline characteristics were provided in Table S2.
The GPR109A expression profiles and clinical metadata of liver cancer patients were acquired using TCGAbiolinks, while the percentage results of macrophages and MDSCs in liver cancer TME were obtained from the TIMER2.0 database. Subsequently, the samples were stratified into low and high expression groups based on their GPR109A expression levels utilizing the Kaplan-Meier plotter website. Specifically, samples with MDSCs/Macrophages abundance exceeding 70% were categorized into the high-expression group, whereas those with percentages below 30% were assigned to the low-expression group. The RNA-seq datasets of different stages HCC were obtained from TCGA and OncoDB. Processed single-cell RNA-seq data from 133 HCC samples, along with all processed bulk TCGA expression data, were acquired from the GepLiver database.
Cell lines
The Hepa1-6 mouse liver cancer cell line was procured from the American Type Culture Collection (ATCC, USA), while the LPC-H12 and H22 mouse liver cancer cell lines and the RAW264.7 mouse monocyte cell line were sourced from the Cell Bank of Shanghai Institutes for Biological Sciences (Chinese Academy of Science). Routine mycoplasma testing by PCR and authentication via STR fingerprinting were conducted for all cell lines by the analytic facility of the Cell Bank of Shanghai Institutes for Biological Sciences. Hepa1-6 and LPC-H12 cell lines were cultured in DMEM medium, while H22 and RAW264.7 cell lines were cultured in RMPI 1640 medium, both supplemented with 10% FBS and 1% penicillin-streptomycin. All cell lines were maintained at 37°C in a humidified atmosphere with 5% CO2.
In vivo animal models
C57BL/6 mice and BALB/C mice (male, 2–4 weeks old) were obtained from Shanghai Slac Laboratory Animal Co. and fed in a pathogen-free vivarium under standard conditions. GPR109A−/− mice on C57BL/6 background were obtained from Cyagen Biosciences. The use principles and experimental protocols of animals were approved by the Animal Care and Use Committee of Laboratory Animal Center, Shanghai Jiao Tong University School of Medicine (No. A-2020-001).
To establish chemical-induced orthotopic HCC model, the 2 weeks old male C57BL/6 mice were injected intraperitoneally with Diethylnitrosamine (DEN, 25 mg/kg) and randomly divided into vehicle or VB3 treatment groups. At the age of 3 weeks, the mice were intraperitoneally injected with Carbon tetrachloride (CCl4, 1 mL/kg, dissolved in olive oil) once a week for up to the experiment ended. For VB3 treatment, the mice were treated with 50 mg/kg VB3 in drinking water at the age of 6 weeks until the experiment ended.
To establish the subcutaneous HCC model, Hepa1-6, LPC-H12 or H22 cells (2×10⁶ in 100μL FBS-free DMEM medium containing 40% matrigel) were injected into the left flanks of recipient mice. We recorded tumor occurrence by physical examination and measured the tumor size every 3 days starting from day 3 after tumor cells implantation. Tumors were measured by using vernier caliper and the volumes were calculated according to the formula 1/2a×b2 where a was the long diameter and b was the short diameter. For prevention model of VB3, the recipient mice were previously administrated with different dosages of VB3 (50, 100, 300, and 600 mg/kg/day) intraperitoneally (i.p) or intragastrically (i.g) for 7 days before tumor implantation until the experiment ended. For treatment model of VB3, the recipient mice were treated with VB3 (50 mg/kg, i.g) started at the day of planting with subcutaneous Hepa1-6 or LPC-H12 tumor until the experiment ended.
To deplete myeloid cells, recipient mice were intraperitoneally injected with 200μg of anti-Ly6G antibody and 150μL of clodronate liposomes on the day of Hepa1-6 or LPC-H12 tumor implantation, followed by subsequent injections every 3 days. CD8+ T cells were depleted by intraperitoneal injection of 200μg of neutralizing anti-CD8 antibody on the day of Hepa1-6 or LPC-H12 tumor implantation, followed by repeated injections every 4 days. The vehicle groups received an equivalent volume of saline or isotype IgG antibody.
To block GPR109A, the recipient mice were treated with 5 mg/kg/day mepenzolate bromide (MPN, i.p) for 7 days before LPC-H12 or Hepa1-6 tumor implantation until the experiment ended. For MK-0354, VB3 and MPN treatment model, the recipient mice were treated with 50 mg/kg/day MK-0354 (i.p), VB3 (i.g), and MPN (i.p) for 7 days before Hepa1-6 tumor implantation until the experiment ended. For PD-L1 blocking antibody treatment, 50 mg/kg/day VB3-treated (i.g, started at 7 days before tumor inoculation) mice were firstly administrated with 100μg PD-L1 blocking antibody (i.p) on the 3th day after LPC-H12 or Hepa1-6 tumor implantation followed by two times of 100μg antibody at 6th and 9th day. For lenvatinib treatment, 50 mg/kg/day VB3-treated (i.g, started at 7 days before tumor inoculation) mice were administrated with 10 mg/kg/day lenvatinib (i.p) on the 3th day after LPC-H12 or Hepa1-6 tumor implantation until the experiment ended.
Method details
Histology, immunohistochemistry, and immunofluorescence
The tumor tissues were fixed in 4% paraformaldehyde fix solution for 24h, followed by embedding into paraffin blocks using standard technical procedures. H&E-stained sections were deparaffinized with xylene and gradient alcohol before staining. Immunohistochemistry involved overlaying the slides with citrate antigen retrieval solution and incubating them in saturated steam for 20 min. After cooling, slides were washed with PBS, followed by a 30min incubation with 5% BSA to reduce background staining. The staining process included overnight incubation at 4°C with primary antibodies, such as AFP, Ki67, CD8, Arg-1, INOS, Ly6G, Cleaved caspase-3. Subsequently, slides were exposed to an HRP-conjugated secondary antibody at 37°C for 1h. These steps were repeated for each primary antibody. Immunofluorescence staining for GPR109A and CD11b involved the use of primary antibodies. After antigen retrieval, the tissues were exposed to primary antibodies overnight at 4°C, and later stained with fluorescence-labeled secondary antibodies at 37°C for 1h. Subsequent visualization of the target proteins was achieved using a confocal laser scanning microscope after staining with DAPI.
Flow cytometry
Fresh tumor tissues from mice were collected, minced, and processed into single-cell suspensions using mouse tumor dissociation kits from Miltenyi Biotech. For surface staining, the single-cell suspensions were centrifugated and resuspended in stain buffer after the removal of red blood cells. Then, cells were incubated with Fixable viability stain 510 or Fixable Viability Stain 780 (1:1000) to eliminate dead cells. Next, cells were treated with anti-mouse CD16/32 antibody (1:50) for 15 min to prevent non-specific binding. Following this, cells were stained with relevant antibodies for 1 h at 4°C in the absence of light. After staining, cells were washed by PBS and resuspended in 200 μL stain buffer. Finally, the single-cell suspensions were subjected to analysis using BD FACS Aria III or Beckman Coulter CytoFlex LX. Based on isotype and fluorescence-minus-one (FMO) controls, gating strategies were provided as follows: CD8+ T cells (Live+CD45+CD8+), CD4+ T cells (Live+CD45+ CD4+), M1 TAMs (Live+CD45+Ly6G−CD11b+F4/80+CD206-), M2-TAMs (Live+CD45+Ly6G−CD11b+F4/80+CD206+), M-MDSCs (Live+CD45+CD11b+Ly6C+), G-MDSCs (Live+CD45+CD11b+Ly6G+), NK cells (Live+CD45+CD3e−NK1.1+) and DC cells (Live+CD45+CD11C+MHCII+). Intracellular staining for FOXP3 and Ki67 was performed by using BD Pharmingen Transcription Factor Buffer Set (BD Biosciences) according to the instruction. For cytokines production detection, the single-cell suspensions were stimulated by BD Pharmingen Leukocyte Activation Cocktail (BD Biosciences) for 6h. Then cells were stained with surface antibodies and BD Cytofix/Cytoperm Fixation/Permeabilization Kit (BD Biosciences) as previously described. Data analysis was performed using FlowJo software.
Tumor interstitial fluid collection
Tumor interstitial fluid was collected form Hepa1-6 tumors. Tumors were washed twice by cold PBS. Equal weight tumors were dissected and then placed on 0.22μM filters on the top of 50mL centrifuge tubes followed by centrifugation at 100 × g for 15 min at 4°C. The centrifuged liquids form Hepa1-6 tumors were collected and measured for the content of VB3, 3-hydroxybutyric acid and butyric acid.
LC-MS
The LC-MS analysis was completed by Shanghai Applied Protein Technology Co., Ltd. In brief, samples were firstly thawed on ice-bath. Then, 20μL serum samples or tumor interstitial fluid samples, and serial dilutions of stock standards were added to a 96-well plate. 100μL of cold methanol with internal standards was added to each sample and vortexed vigorously for 5min. The plate was further centrifuged at 4000g for 30 min. 30μL supernatants was transferred to a new 96-well plate, and 20μL freshly prepared 3-NPH and EDC was added to each well. The plate was sealed and the derivatization was carried out at 30°C for 60min. After derivatization, 80μL cold 50% methanol was added to dilute the samples. Then the plate was stored at −20°C for 20 min and followed by 4000g centrifugation at 4°C for 30 min 120μL supernatants of each well were further transferred to a new 96-well plate. Finally, the plate was sealed for LC-MS analysis. A Shimadzu ultra-performance liquid chromatography coupled to QTrap 6500+ (AB Sciex Corp.) was used to quantitate targeted metabolites. A BEH C18 column (2.1 × 100 mm, 1.7μm) was used with the following gradient: 0-1min, 5%B; 1-4min, 5–25%B; 4-8min, 25–50%B; 8-10min, 50-100B%; 10-12min, 100%B; 12-12.1min, 100-5%B; 12.1–15min, 5%B. Mobile phase A was 0.1% formic acid in water, B was acetonitrile. The flow rate was 0.35 mL/min. The column temperature was kept at 40°C and the injection volume was 3μL. Peak area integration and quantification of targeted metabolites were performed using SCIEX OS software 1.0 (AB Sciex Corp.).
Tumor cell proliferation assay
Approximately 5×10³ Hepa1-6 or LPC-H12 tumors cells were seeded into a 96-well plate. Place the 96-well plate in incubator for 4-6h to allow cells adherence. Then, 50 or 100μM VB3 were added into indicated wells. After incubated for 72h, adding 10μL CCK-8 solution into each well. Gently shaking the culture plate and measuring the absorbance value at 450nm by microplate reader.
Tumor cell colony assay
Hepa1-6 and LPC-H12 tumor cells (1,000/well) were placed in six-well plates and treated with 50 or 100μM VB3. After 14 days, cells were fixed with 4% paraformaldehyde, tinted with 0.1% crystal violet, and left to dry. Cell colonies numbers were counted by ImageJ.
Tumor conditioned medium collection
After grew to 90% in DMEM media with 10% FBS, the culture supernatants of Hepa1-6 or LPC-H12 were collected and filtered using 0.22μm cell strainers as conditioned medium (CM) to mimic liver cancer TME.
Myeloid cells isolation and treatments
Dissecting the femurs from 8-week-old WT or GPR109A−/− C57BL/6 mice to isolate bone marrow-derived myeloid cells (BMDM and G-MDSC). After red blood cells removal, BMDM was cultivated in IMDM media with 10% FBS and 20 ng/mL M-CSF for 7 days, with media changes every 3 days. G-MDSC was cultured in 1640 media containing 10% FBS, 40 ng/mL GM-CSF, and 20 ng/mL G-CSF for 6 days, with media changes every 2 days. To mimic TME, G-MDSC or BMDM underwent treatment with Hepa1-6 or LPC-H12 CM and VB3 (50 or 100μM) for 0, 3, 6, 12, or 24h. To block VB3-mediated GPR109A activation, BMDM and G-MDSC were incubated with 50μM MPN for 4h prior to Hepa1-6 or LPC-H12 CM and 50μM VB3 treatment for another 12h. To directly activate or block GPR109A, BMDM and G-MDSC were incubated with LPC-H12 CM and 50μM VB3, MK-0354, or MPN for 12h. To block transcription and translation of GPR109A, G-MDSC and BMDM were previously stimulated with LPC-H12 CM for 12h and then treated with VB3 (50μM), ACTD (50μM), and CHX (50μM) for another 12h. To block NF-κB axis, BMDM and G-MDSC were incubated with LPC-H12 CM and 10μM JSH-23 for 12h.
CD8+ T cell isolation and proliferation assays
Fresh mouse spleen tissue obtained from 8-week-old C57BL/6 mice was processed through a 70μm Strainer to generate single-cell suspensions. Following the removal of red blood cells, CD8+ T cells were isolated using the EasySepTM Mouse CD8+ T cell Isolation Kit. For the T cell proliferation assay, the 96-well culture plates were precoated with 5 μg/mL anti-CD3e antibody and 5 μg/mL anti-CD28 antibody for 24 h at 4°C. Then CFSE labled-CD8+ T cells were co-cultured with VB3-educated WT or GPR109A−/− G-MDSC and BMDM with CM treatment (CD8+ T cells: myeloid cells = 2:1, CD8+ T cells number: 2×10⁵) in l640 medium supplemented with 10% FBS and 10 ng/mL IL-2. After incubation for 48h, the proliferation rate of CD8+ T cells was assessed by using flow cytometry and quantified by FlowJo software.
Quantitative reverse-transcription PCR
The TRIzol reagent and Direct-zol RNA MiniPrep were applied to extract total RNA from the indicated cells. The PrimeScriptTM RT reagent Kit was employed to reverse transcribed total RNA into cDNA. Quantitative reverse-transcription PCR assay used SYBR green as the detection fluorophore and was performed on Bio-Rad CFX384 Real-Time Systems. The target gene expressions were normalized to β-actin. The ΔΔCt method was applied to determine relative mRNA expression. The detailed primer sequences were provided in Table S3.
Western blotting
Cell lysates were prepared by using RIPA lysis buffer. The Bradford protein assay kit was employed to determine the total protein concentrations. Equal amounts of protein extracts were subjected to separation on 10% SDS-PAGE gels, followed by transfer to methanol preactivated-polyvinylidene difluoride membranes. Subsequently, the membranes were incubated in 5% BSA solution for 1h at room temperature and then exposed to primary antibodies overnight at 4°C. After washed by PBST, the membranes were further incubated with HRP-linked secondary antibodies for 1h at room temperature. Protein visualization on membranes was carried out using an enhanced chemiluminescence reagent. The uncropped membranes were provided in Figure S7.
siRNA knockdown assay
The siRNA targeting mouse Arrb1(5′-CCUACAAAGUCAAGGUGAATT-3′), Arrb2(5′-CCUACAGGGUCAAGGUGAATT-3′), and the negative control (5′-UUCUCCGAACGUGUCACGUTT-3′). Briefly, 1 × 10⁶ RAW264.7 cells were plated into six-well plate in 2mL RMPI 1640 media without FBS and antibiotics for 24h before transfection. Then, cells were transfected with 3μL of 10μM siRNA per well by using 9μL Lipofectamine RNAiMAX reagent and Opti-MEM medium. After transfection for 6h, culture medium was changed into fresh RMPI 1640 with 10% FBS. After another 48h, cells were treated with LPC-H12 CM and 50μM VB3 for 12h and then harvested for indicated experiments.
cAMP parameter assay
First, RAW264.7 cells were treated with/without LPC-H12 CM and 50μM VB3 for 12h. Then, treated cells was washed three times by cold PBS. A concentration of 1 × 10⁷ cells was lysed and centrifuged at 600 × g for 10 min at 4°C to remove cellular debris. The supernatants were collected and quantified by the cAMP content according to the manufacturer’s protocol of cAMP ELISA assay kit (R&D).
Immunoprecipitation assay
The VB3-treated G-MDSC or BMDM cell lysates were incubated with anti-β-Arrestin1 or anti-β-Arrestin2 at 4°C for 6 h followed by Protein A/G agarose beads for overnight. Beads were washed 3 times and eluted with SDS loading buffer. The immunoprecipitated proteins were performed by SDS-PAGE as described before.
Quantification and statistical analysis
Statistical analyses were performed by using GraphPad Prism Version 9.0. The statistical significances of differences between groups were examined with one-way ANOVA, two-way ANOVA, or Student’s t test. Kaplan-Meier survival curves were plotted and were compared by Log rank (Mantel-Cox) test. Flow cytometry data were analyzed by FlowJo_V10. p values < 0.05 were considered statistically significant. All experiments were replicated independently with three times or more. Throughout all figures: ns p > 0.05, ∗p < 0.05, ∗∗p < 0.01, and ∗∗∗p < 0.001.
Published: September 17, 2024
Footnotes
Supplemental information can be found online at https://doi.org/10.1016/j.xcrm.2024.101718.
Contributor Information
Qian Ba, Email: qba@shsmu.edu.cn.
Xiaoguang Li, Email: lixg@shsmu.edu.cn.
Hui Wang, Email: huiwang@shsmu.edu.cn.
Supplemental information
References
- 1.Toh M.R., Wong E.Y.T., Wong S.H., Ng A.W.T., Loo L.H., Chow P.K.H., Ngeow J. Global Epidemiology and Genetics of Hepatocellular Carcinoma. Gastroenterology. 2023;164:766–782. doi: 10.1053/j.gastro.2023.01.033. [DOI] [PubMed] [Google Scholar]
- 2.Yang C., Zhang H., Zhang L., Zhu A.X., Bernards R., Qin W., Wang C. Evolving therapeutic landscape of advanced hepatocellular carcinoma. Nat. Rev. Gastroenterol. Hepatol. 2023;20:203–222. doi: 10.1038/s41575-022-00704-9. [DOI] [PubMed] [Google Scholar]
- 3.Villanueva A. Hepatocellular Carcinoma. N. Engl. J. Med. 2019;380:1450–1462. doi: 10.1056/NEJMra1713263. [DOI] [PubMed] [Google Scholar]
- 4.Li X., Ramadori P., Pfister D., Seehawer M., Zender L., Heikenwalder M. The immunological and metabolic landscape in primary and metastatic liver cancer. Nat. Rev. Cancer. 2021;21:541–557. doi: 10.1038/s41568-021-00383-9. [DOI] [PubMed] [Google Scholar]
- 5.Kanarek N., Petrova B., Sabatini D.M. Dietary modifications for enhanced cancer therapy. Nature. 2020;579:507–517. doi: 10.1038/s41586-020-2124-0. [DOI] [PubMed] [Google Scholar]
- 6.He C., Wang D., Shukla S.K., Hu T., Thakur R., Fu X., King R.J., Kollala S.S., Attri K.S., Murthy D., et al. Vitamin B6 competition in the tumor microenvironment hampers antitumor functions of NK cells. Cancer Discov. 2024;14:176–193. doi: 10.1158/2159-8290.CD-23-0334. [DOI] [PMC free article] [PubMed] [Google Scholar]
- 7.Zitvogel L., Pietrocola F., Kroemer G. Nutrition, inflammation and cancer. Nat. Immunol. 2017;18:843–850. doi: 10.1038/ni.3754. [DOI] [PubMed] [Google Scholar]
- 8.Mayne S.T., Playdon M.C., Rock C.L. Diet, nutrition, and cancer: past, present and future. Nat. Rev. Clin. Oncol. 2016;13:504–515. doi: 10.1038/nrclinonc.2016.24. [DOI] [PubMed] [Google Scholar]
- 9.Tajan M., Vousden K.H. Dietary Approaches to Cancer Therapy. Cancer Cell. 2020;37:767–785. doi: 10.1016/j.ccell.2020.04.005. [DOI] [PubMed] [Google Scholar]
- 10.Jordan S., Tung N., Casanova-Acebes M., Chang C., Cantoni C., Zhang D., Wirtz T.H., Naik S., Rose S.A., Brocker C.N., et al. Dietary Intake Regulates the Circulating Inflammatory Monocyte Pool. Cell. 2019;178:1102–1114.e17. doi: 10.1016/j.cell.2019.07.050. [DOI] [PMC free article] [PubMed] [Google Scholar]
- 11.Fan H., Xia S., Xiang J., Li Y., Ross M.O., Lim S.A., Yang F., Tu J., Xie L., Dougherty U., et al. Trans-vaccenic acid reprograms CD8(+) T cells and anti-tumour immunity. Nature. 2023;623:1034–1043. doi: 10.1038/s41586-023-06749-3. [DOI] [PMC free article] [PubMed] [Google Scholar]
- 12.Rautiainen S., Manson J.E., Lichtenstein A.H., Sesso H.D. Dietary supplements and disease prevention - a global overview. Nat. Rev. Endocrinol. 2016;12:407–420. doi: 10.1038/nrendo.2016.54. [DOI] [PubMed] [Google Scholar]
- 13.Barker T. Vitamins and Human Health: Systematic Reviews and Original Research. Nutrients. 2023;15 doi: 10.3390/nu15132888. [DOI] [PMC free article] [PubMed] [Google Scholar]
- 14.Peterson C.T., Rodionov D.A., Osterman A.L., Peterson S.N. B Vitamins and Their Role in Immune Regulation and Cancer. Nutrients. 2020;12 doi: 10.3390/nu12113380. [DOI] [PMC free article] [PubMed] [Google Scholar]
- 15.Yuan X., Duan Y., Xiao Y., Sun K., Qi Y., Zhang Y., Ahmed Z., Moiani D., Yao J., Li H., et al. Vitamin E Enhances Cancer Immunotherapy by Reinvigorating Dendritic Cells via Targeting Checkpoint SHP1. Cancer Discov. 2022;12:1742–1759. doi: 10.1158/2159-8290.CD-21-0900. [DOI] [PMC free article] [PubMed] [Google Scholar]
- 16.Kashyap M.L., Ganji S., Nakra N.K., Kamanna V.S. Niacin for treatment of nonalcoholic fatty liver disease (NAFLD): novel use for an old drug? J. Clin. Lipidol. 2019;13:873–879. doi: 10.1016/j.jacl.2019.10.006. [DOI] [PubMed] [Google Scholar]
- 17.Liu C., Yang Y., Chen C., Li L., Li J., Wang X., Chu Q., Qiu L., Ba Q., Li X., Wang H. Environmental eustress modulates beta-ARs/CCL2 axis to induce anti-tumor immunity and sensitize immunotherapy against liver cancer in mice. Nat. Commun. 2021;12:5725. doi: 10.1038/s41467-021-25967-9. [DOI] [PMC free article] [PubMed] [Google Scholar]
- 18.Yang Y., Sun M., Yao W., Wang F., Li X., Wang W., Li J., Gao Z., Qiu L., You R., et al. Compound kushen injection relieves tumor-associated macrophage-mediated immunosuppression through TNFR1 and sensitizes hepatocellular carcinoma to sorafenib. J. Immunother. Cancer. 2020;8 doi: 10.1136/jitc-2019-000317. [DOI] [PMC free article] [PubMed] [Google Scholar]
- 19.Singh N., Gurav A., Sivaprakasam S., Brady E., Padia R., Shi H., Thangaraju M., Prasad P.D., Manicassamy S., Munn D.H., et al. Activation of Gpr109a, receptor for niacin and the commensal metabolite butyrate, suppresses colonic inflammation and carcinogenesis. Immunity. 2014;40:128–139. doi: 10.1016/j.immuni.2013.12.007. [DOI] [PMC free article] [PubMed] [Google Scholar]
- 20.Chai J.T., Digby J.E., Choudhury R.P. GPR109A and vascular inflammation. Curr. Atheroscler. Rep. 2013;15:325. doi: 10.1007/s11883-013-0325-9. [DOI] [PMC free article] [PubMed] [Google Scholar]
- 21.Feingold K.R., Moser A., Shigenaga J.K., Grunfeld C. Inflammation stimulates niacin receptor (GPR109A/HCA2) expression in adipose tissue and macrophages. J. Lipid Res. 2014;55:2501–2508. doi: 10.1194/jlr.M050955. [DOI] [PMC free article] [PubMed] [Google Scholar]
- 22.Taniguchi K., Karin M. NF-kappaB, inflammation, immunity and cancer: coming of age. Nat. Rev. Immunol. 2018;18:309–324. doi: 10.1038/nri.2017.142. [DOI] [PubMed] [Google Scholar]
- 23.Yang L.K., Hou Z.S., Tao Y.X. Biased signaling in naturally occurring mutations of G protein-coupled receptors associated with diverse human diseases. Biochim. Biophys. Acta, Mol. Basis Dis. 2021;1867 doi: 10.1016/j.bbadis.2020.165973. [DOI] [PMC free article] [PubMed] [Google Scholar]
- 24.Witherow D.S., Garrison T.R., Miller W.E., Lefkowitz R.J. beta-Arrestin inhibits NF-kappaB activity by means of its interaction with the NF-kappaB inhibitor IkappaBalpha. Proc. Natl. Acad. Sci. USA. 2004;101:8603–8607. doi: 10.1073/pnas.0402851101. [DOI] [PMC free article] [PubMed] [Google Scholar]
- 25.Gao H., Sun Y., Wu Y., Luan B., Wang Y., Qu B., Pei G. Identification of beta-arrestin2 as a G protein-coupled receptor-stimulated regulator of NF-kappaB pathways. Mol. Cell. 2004;14:303–317. doi: 10.1016/s1097-2765(04)00216-3. [DOI] [PubMed] [Google Scholar]
- 26.Gaidarov I., Chen X., Anthony T., Maciejewski-Lenoir D., Liaw C., Unett D.J. Differential tissue and ligand-dependent signaling of GPR109A receptor: implications for anti-atherosclerotic therapeutic potential. Cell. Signal. 2013;25:2003–2016. doi: 10.1016/j.cellsig.2013.06.008. [DOI] [PubMed] [Google Scholar]
- 27.Taylor S.R., Falcone J.N., Cantley L.C., Goncalves M.D. Developing dietary interventions as therapy for cancer. Nat. Rev. Cancer. 2022;22:452–466. doi: 10.1038/s41568-022-00485-y. [DOI] [PubMed] [Google Scholar]
- 28.Stine Z.E., Schug Z.T., Salvino J.M., Dang C.V. Targeting cancer metabolism in the era of precision oncology. Nat. Rev. Drug Discov. 2022;21:141–162. doi: 10.1038/s41573-021-00339-6. [DOI] [PMC free article] [PubMed] [Google Scholar]
- 29.Kreuzaler P., Inglese P., Ghanate A., Gjelaj E., Wu V., Panina Y., Mendez-Lucas A., MacLachlan C., Patani N., Hubert C.B., et al. Vitamin B(5) supports MYC oncogenic metabolism and tumor progression in breast cancer. Nat. Metab. 2023;5:1870–1886. doi: 10.1038/s42255-023-00915-7. [DOI] [PMC free article] [PubMed] [Google Scholar]
- 30.Ames B.N., Wakimoto P. Are vitamin and mineral deficiencies a major cancer risk? Nat. Rev. Cancer. 2002;2:694–704. doi: 10.1038/nrc886. [DOI] [PubMed] [Google Scholar]
- 31.Ying H., Gao L., Liao N., Xu X., Yu W., Hong W. Association between niacin and mortality among patients with cancer in the NHANES retrospective cohort. BMC Cancer. 2022;22:1173. doi: 10.1186/s12885-022-10265-4. [DOI] [PMC free article] [PubMed] [Google Scholar]
- 32.Barry S.T., Gabrilovich D.I., Sansom O.J., Campbell A.D., Morton J.P. Therapeutic targeting of tumour myeloid cells. Nat. Rev. Cancer. 2023;23:216–237. doi: 10.1038/s41568-022-00546-2. [DOI] [PubMed] [Google Scholar]
- 33.Goswami S., Anandhan S., Raychaudhuri D., Sharma P. Myeloid cell-targeted therapies for solid tumours. Nat. Rev. Immunol. 2023;23:106–120. doi: 10.1038/s41577-022-00737-w. [DOI] [PubMed] [Google Scholar]
- 34.Zhang L., Li Z., Skrzypczynska K.M., Fang Q., Zhang W., O'Brien S.A., He Y., Wang L., Zhang Q., Kim A., et al. Single-Cell Analyses Inform Mechanisms of Myeloid-Targeted Therapies in Colon Cancer. Cell. 2020;181:442–459.e29. doi: 10.1016/j.cell.2020.03.048. [DOI] [PubMed] [Google Scholar]
- 35.Zhou S., Zhao Z., Zhong H., Ren Z., Li Y., Wang H., Qiu Y. The role of myeloid-derived suppressor cells in liver cancer. Discov. Oncol. 2023;14:77. doi: 10.1007/s12672-023-00681-8. [DOI] [PMC free article] [PubMed] [Google Scholar]
- 36.Cheng X., Wang H., Wang Z., Zhu B., Long H. Tumor-associated myeloid cells in cancer immunotherapy. J. Hematol. Oncol. 2023;16:71. doi: 10.1186/s13045-023-01473-x. [DOI] [PMC free article] [PubMed] [Google Scholar]
- 37.Wu C., Lin J., Weng Y., Zeng D.N., Xu J., Luo S., Xu L., Liu M., Hua Q., Liu C.Q., et al. Myeloid signature reveals immune contexture and predicts the prognosis of hepatocellular carcinoma. J. Clin. Invest. 2020;130:4679–4693. doi: 10.1172/JCI135048. [DOI] [PMC free article] [PubMed] [Google Scholar]
- 38.Mantovani A., Marchesi F., Jaillon S., Garlanda C., Allavena P. Tumor-associated myeloid cells: diversity and therapeutic targeting. Cell. Mol. Immunol. 2021;18:566–578. doi: 10.1038/s41423-020-00613-4. [DOI] [PMC free article] [PubMed] [Google Scholar]
- 39.Jia D., Bai P., Wan N., Liu J., Zhu Q., He Y., Chen G., Wang J., Chen H., Wang C., et al. Niacin Attenuates Pulmonary Hypertension Through H-PGDS in Macrophages. Circ. Res. 2020;127:1323–1336. doi: 10.1161/CIRCRESAHA.120.316784. [DOI] [PubMed] [Google Scholar]
- 40.Salem H.A., Wadie W. Effect of Niacin on Inflammation and Angiogenesis in a Murine Model of Ulcerative Colitis. Sci. Rep. 2017;7:7139. doi: 10.1038/s41598-017-07280-y. [DOI] [PMC free article] [PubMed] [Google Scholar]
- 41.Cardoso-Lezama I., Fuentes-Figueroa M.Á., Ramos-Tovar E., Márquez-Quiroga L.V., Ortiz-Fernández A., Vargas-Pozada E.E., Arellanes-Robledo J., Tsutsumi V., Muriel P. Nicotinic acid attenuates experimental non-alcoholic steatohepatitis by inhibiting the NLRP3 inflammasome/pyroptosis pathway. Biochem. Pharmacol. 2023;216 doi: 10.1016/j.bcp.2023.115762. [DOI] [PubMed] [Google Scholar]
- 42.Sarkar S., Yang R., Mirzaei R., Rawji K., Poon C., Mishra M.K., Zemp F.J., Bose P., Kelly J., Dunn J.F., Yong V.W. Control of brain tumor growth by reactivating myeloid cells with niacin. Sci. Transl. Med. 2020;12 doi: 10.1126/scitranslmed.aay9924. [DOI] [PubMed] [Google Scholar]
Associated Data
This section collects any data citations, data availability statements, or supplementary materials included in this article.
Supplementary Materials
Data Availability Statement
-
•
This paper analyzes existing, publicly available data. These accession numbers for the datasets are listed in the key resources table.
-
•
This paper does not report original code.
-
•
Any additional information required to reanalyze the data reported in this paper is available from the lead contact upon request.