Abstract
Temporal ordering of cellular events offers fundamental insights into biological phenomena. Although this is traditionally achieved through continuous direct observations1,2, an alternative solution leverages irreversible genetic changes, such as naturally occurring mutations, to create indelible marks that enables retrospective temporal ordering3–5. Using a multipurpose, single-cell CRISPR platform, we developed a molecular clock approach to record the timing of cellular events and clonality in vivo, with incorporation of cell state and lineage information. Using this approach, we uncovered precise timing of tissue-specific cell expansion during mouse embryonic development, unconventional developmental relationships between cell types and new epithelial progenitor states by their unique genetic histories. Analysis of mouse adenomas, coupled to multiomic and single-cell profiling of human precancers, with clonal analysis of 418 human polyps, demonstrated the occurrence of polyclonal initiation in 15–30% of colonic precancers, showing their origins from multiple normal founders. Our study presents a multimodal framework that lays the foundation for in vivo recording, integrating synthetic or natural indelible genetic changes with single-cell analyses, to explore the origins and timing of development and tumorigenesis in mammalian systems.
Subject terms: Cancer genetics, Evolution, Biotechnology, Organogenesis, Colorectal cancer
Using a multipurpose, single-cell CRISPR platform, we demonstrate precise timing of tissue-specific cell expansion during mouse embryonic development, unconventional developmental relationships between cell types, new epithelial progenitor states and insights into precancer initiation by leveraging genetic histories.
Main
Mammalian development from a fertilized egg (zygote) comprises a highly orchestrated series of cell divisions and lineage diversifications6. The reconstruction of the Caenorhabditis elegans cell lineage and discernment of the temporal history from the zygote stage represents an important milestone for the field of developmental biology7. Tumorigenesis shares a number of cellular and molecular events with embryonic development that are yet to be fully understood8,9. Fundamental to understanding these mechanisms is knowledge of their cellular origins and temporal ordering1,10. Previous work has used non-reversible genetic alterations in tumours, such as mutations and copy number changes, in either bulk or spatially resolved sequencing to track temporal events11–13. Although these analyses are applicable to human tumour studies, they provide inferences of only chronological order or clonality, lacking the precision to track associated change in cell states or pathways.
Recent barcoding strategies in mammalian systems14,15, when combined with single-cell sequencing, have shown promise in unravelling the origins and chronology of cellular events. However, their potential for recording temporal events over the long term is constrained by limited barcode diversity16 and loss of information due to large deletion of multiple adjacent cut-sites17. More recently, studies have begun to show phylogenetic relationships among cancer cells by applying barcoding strategies to xenografts or chimeras18,19. However, these studies do not include tracking from normal cells, which would require long-term labelling, thereby limiting the study of clonal origins and evolutionary selection during spontaneous tumorigenesis. We present a multimodal framework that pairs long-term temporal tracking in mice with human single-cell multiomics data to address questions regarding cellular origins and chronology in development and cancer. We developed native single-guide RNA capture and sequencing (NSC–seq), a custom multipurpose, single-cell platform for concurrent capture of messenger RNAs and guide RNAs (gRNA), that leverages self-mutating CRISPR barcodes from homing guide RNAs (hgRNAs)20,21 for lineage tracking and temporal recording by accumulative mutation patterns. We use NSC–seq to decipher canonical developmental branching during mouse gastrulation. We demonstrate the ability of this platform to identify new embryonic progenitor cell populations and routes of cellular differentiation, as well as to provide new insights into the timing of tissue diversification. These results lay the foundation for in vivo multimodal recording for a wide variety of applications. We further leveraged this tracking approach by pairing it with genome-scale analysis of human tissues to illuminate the cellular origins of colorectal cancer. As part of the Human Tumor Atlas Network (HTAN), we collected one of the largest multiomic atlasing datasets on human sporadic polyps to date, comprising 116 polyps with single-cell RNA sequencing (scRNA-seq) data and 418 polyps with mutational data. Paired analysis of human atlasing data, in conjunction with mouse intestinal tumour models, showed the polyclonal origins of colorectal tumorigenesis. Our multimodal framework, which pairs natural genetic changes in humans with induced genetic changes in the mouse, illuminates the complexities of cellular origins and temporal transitions, and their relevance in early tumorigenesis.
A temporal recording platform
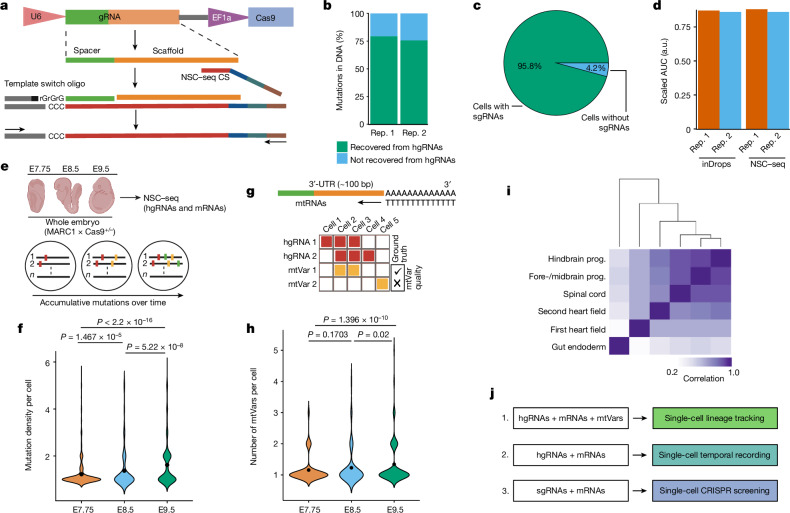
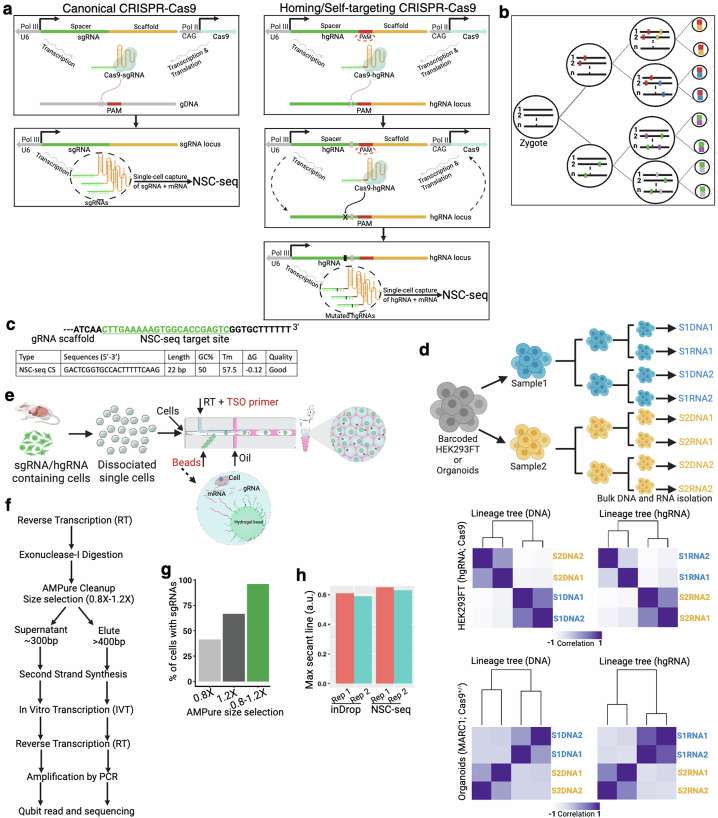
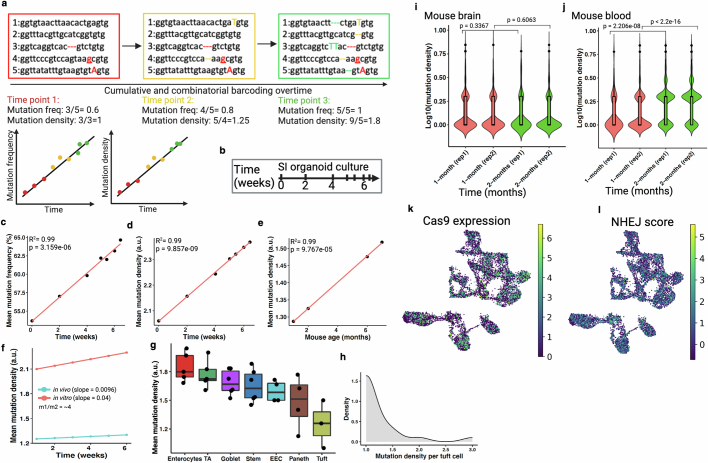
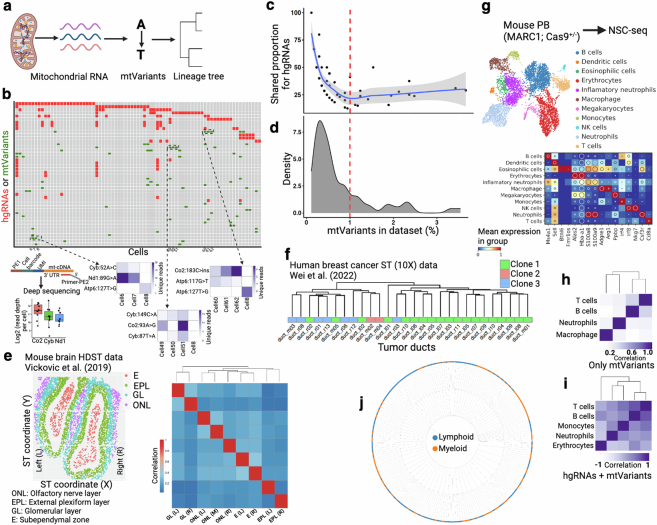
To enable CRISPR-based temporal recording at single-cell resolution, we developed a custom capture platform for non-polyadenylated hgRNAs that requires neither redesign of whole gRNA libraries22 nor indirect readouts23 (Fig. 1a and Extended Data Fig. 1a–c). Nearly 80% of gDNA mutations were detected in hgRNA with NSC–seq (Fig. 1b). Using controlled cell and organoid passage experiments, we demonstrated that hgRNA mutations are equivalent to gDNA mutations for lineage tree reconstruction (Extended Data Fig. 1d). Adaptation of NSC–seq to single-cell resolution demonstrated gRNA detection in 95% of cells, with transcriptome quality similar to a standard inDrops experiment (Fig. 1c,d, Extended Data Fig. 1e–h and Supplementary Methods). Previous work5 and our results here showed that gDNA barcode mutation frequency—as defined by the ratio of mutated versus wild-type barcodes—tracks linearly with cell or organoid culture time when measured in bulk (Extended Data Fig. 2a–c). However, we found mutational frequency to be unusable for single-cell applications owing to single-cell data sparsity, in which only a fraction of barcodes can be detected on a per-cell basis. Therefore, we introduced a mutational density metric, defined as the average number of mutations within barcodes, which is unaffected by single-cell data sparsity and also tracks with time in organoid cultures and the intestinal epithelium (Extended Data Fig. 2d,e). We observed that mutational density increases at a faster rate in intestinal organoid cultures than in intestinal epithelium in vivo (Extended Data Fig. 2f), confirming that epithelial cells under organoid conditions are more proliferative. Although high Wingless-related integration site (Wnt) activity in organoid culturing conditions mimics injury-induced regeneration and induces stem/progenitor cell proliferation, there may be additional in vitro factors that can marginally affect mutation rates. Cellular turnover rates of common intestinal cell types, as inferred by mutational density, were consistent with current knowledge (Extended Data Fig. 2g). Specifically, tuft cells exhibited a multimodal distribution of mutational densities, consistent with a heterogeneous cell population with different lifetimes24 (Extended Data Fig. 2h). NSC–seq applied to three mouse embryonic time points for profiling of hgRNAs and messenger RNAs simultaneously also showed mutation density to increase over time (Fig. 1e,f), driven by cell type-specific changes (Extended Data Fig. 2i,j), that is not due to cell type bias in Cas9 expression or non-homologous end-joining activity (Extended Data Fig. 2k,l). Although mutation density per barcode can be used for timing assessments, non-overlapping gRNA barcode expression detected per cell limits information content used for cell phylogeny reconstruction. We thus augmented hgRNA mutational information with somatic mitochondrial variants (mtVars). In brief, we filtered out germline mtVars using a custom ‘germline mtVars bank’ (Supplementary Methods) and then defined a lineage-determining cut-off from mtVar distributions using paired hgRNA mutations as ‘ground truth’ somatic variants (Extended Data Fig. 3a–d). Using this pipeline, we showed that mtVars also consistently increased over three embryonic time points (Fig. 1g,h), similar to hgRNA mutations (Fig. 1f). We further delineated the known developmental order of different mouse brain layers before left–right brain segregation21 (Extended Data Fig. 3e), and verified previously reported clonal relationships between three human breast tumour regions (Extended Data Fig. 3f), using mtVars on published spatial data. Single-cell analysis using hgRNA, mtVars or both was able to accurately identify lymphoid and myeloid cells as distinct lineages in peripheral blood mononuclear cells (Extended Data Fig. 3g–j), and to distinguish embryonic tissue types (Fig. 1i). Taken together, our findings demonstrate the efficacy of a comprehensive pipeline of temporal and lineage tracking that is coupled to single-cell transcriptomic analysis (Fig. 1j).
Fig. 1. Optimization of a multipurpose, single-cell capture platform.
a, gRNA capture schematic for the NSC–seq platform. The target site of gRNA scaffold anneals to NSC–seq capture sequence (CS) with a cellular barcode (blue) and unique molecular identifier (green). An additional sequence (grey) is added to the 3′-end of the complementary DNA via template switching during reverse transcription to enable downstream library amplification. This gRNA capture approach is compatible with any type of gRNA (single-guide RNA (sgRNA), hgRNA and self-targeting guide RNA) that contains the target site sequence in the scaffold (Extended Data Fig. 1). b, Cas9-induced mutation recovery by direct hgRNA capture as compared with mutations detected in DNA of the same samples. c, gRNA capture efficiency by NSC–seq assessed in an experiment in which all cells from a drug-selected cell line should contain sgRNAs. d, Comparative transcriptome capture efficiency between standard inDrops and NSC–seq experiments. e, NSC–seq experiments performed on developmentally barcoded whole embryos in which Cas9 is constitutively expressed (top). Accumulative mutations on homing barcode regions increase over time (bottom)5,20. f, Average mutation density over embryonic time points (Extended Data Fig. 2a). Black dots represent geometric mean for each time point, and P values are derived from unpaired two-tailed t-tests. g, Somatic mtVar calling from mitochondrial RNA (mtRNA) (top). Approach to filtering informative mtVars for lineage tracking using hgRNA mutations as ground truth (bottom) (Extended Data Fig. 3b–d). h, Number of somatic mtVars per cell over embryonic time points. Black dot represents geometric mean for each time point, and P values were derived from unpaired two-tailed t-tests. i, Pearson correlation coefficient heat map of variant proportions combining hgRNAs and mtVars for selected tissue types, presented as pseudobulk from an E9.5 embryo (Extended Data Fig. 4). j, Multimodal application of the NSC–seq platform. a,e,g,j, Schematics created using BioRender (https://BioRender.com). a.u., arbitrary units; AUC, area under the curve; rep., replicate; prog., progenitor; bp, base pairs.
Extended Data Fig. 1. Design and validation of NSC-seq platform.
(a) Schematic representation of canonical CRISPR-Cas9 (left) and homing/self-targeting CRISPR-Cas9 (right). In homing CRISPR, Cas9-hgRNA complex targets the DNA locus encoding the hgRNA itself. (b) Schematic representation of lineage tracking during development using Cas9-induced mutations. (c) Target site for NSC-seq capture sequence (green), along with quality metrics of the capture sequence primer. (d) Experimental design of control lineage tracking experiments using homing CRISPR-barcoded HEK293FT cell line and mouse intestinal organoids (MARC1;Cas9), where the hierarchy of the cultures are known through passage sampling. Similar lineage trees are observed from both bulk DNA and bulk hgRNA barcodes in this experiment (bottom). Cell lines were passaged after 1 week, whereas organoids were passaged after 3 days. (e) Overview of single-cell experiment using NSC-seq platform simultaneously capturing both gRNA and mRNA within the same droplet. Custom hydrogel beads are designed for NSC-seq experiment using inDrops61. See supplemental table 1 for primer sequences. (f) Workflow delineating two separate library preparations (gRNA and mRNA) of NSC-seq. (g) Different cDNA size selection approaches yield varying sgRNA capture efficiencies. The use of two separate library preparation approaches in (f) results in improved capture efficiency. (h) Comparative transcriptome (mRNA) capture efficiency between inDrops and NSC-seq experiments (see Fig. 1d and supplemental method). Schematic in a adapted from ref. 62, Springer Nature America, and schematics in a, b, d, e, and f created using BioRender (https://BioRender.com).
Extended Data Fig. 2. Overview of temporal recording.
(a) Schematic representation of increasing mutation density and mutation frequency overtime in self-mutating CRISPR system5,20. Mutation frequency denotes the proportion of wild-type barcodes at a given time. Mutation density is the number of unique mutations per mutated barcode. Color indicates different timepoints. Insertion (capital), deletion (dotted line) and base substitution (underline) mutations are shown here. Theoretical expected mutation frequency and mutation density are function of time (bottom). (b) Schematic of in vitro small intestinal (SI) organoids culture over 6 weeks and subsampled to analyze accumulative mutations. (c-d) Mutation frequency and mutation density exhibit a linear increase overtime. (e) Mutation density from adult mouse duodenum (SI) displays a linear increase overtime (in vivo). Pearson’s coefficient of determinant (R2) and p value (by F-test) are indicated in c-e. (f) Comparative mutation density increases in mouse SI between in vivo and in vitro. Values derived from previous linear model (d and e) to plot under same coordinate. Slope (m) indicates relative rate of cell division. In vitro cell division rate in intestinal organoids is almost 4 times higher than the in vivo intestinal epithelial cell division. (g) Comparative cell division (mutation density) across different small intestinal epithelial cell types (see Extended Data Fig. 11i). Here, each dot is a technical replicate (NSC-seq library) from the same mouse. Box plots show the median, box edges represent the first and third quartiles, and the whiskers extend to a maximum and maximum of 1.5*IQR beyond the box. TA, Transit-amplifying; and EEC, enteroendocrine; Stem, CBC. These data support the expected notion that enterocyte turnover is higher than Paneth cells. (h) Distribution of mutation density per tuft cell reflects only a small fraction of this cell type shows turnover signature, as reported before63. (i-j) Comparative mutation density between cycling (blood) and non-cycling/less-cycling (brain) tissue types over two time points. These data support that increasing mutation density is cell division dependent. Here, rep1 and rep2 are independent biological replicates and bulk DNA barcode-based mutation density assessment. Box plots inside the violin show the median value (thick line), box edges represent the first and third quartiles. P value from unpaired two-tailed t-test. (k) Cas9 expression is uniform across embryonic cell types (E7.75 and E8.5). (l) Nonhomologous end joining (NHEJ) activity score is also uniform across cell types. Panel a and b created using BioRender (https://BioRender.com).
Extended Data Fig. 3. Mitochondrial variants detection and validation for lineage analysis.
(a) Schematic of mitochondrial variants (mtVars) based lineage analysis64. (b) A representative plot of mtVars (green) and hgRNA mutations (red) from same selective group of intestinal cells (top). Validation of a few mtVars using targeted deep sequencing using previously reported targeted enrichment (bottom)65. Box plots (bottom right) show the median (n = 9 cells), box edges represent the first and third quartiles, and the whiskers extend to a minimum and a maximum of 1.5 × IQR beyond the box. Heatmaps (bottom left) color represents unique reads per cell. See Supplemental methods for details. (c-d) Pairwise shared hgRNA mutation proportion for each mtVar (c) and density plot of mtVars across dataset (d). mtVars distributed in a smaller number of cells (~1% of dataset) are more informative for lineage inference. Regression line (c) drawn from default local polynomial regression fit (loess) in R and shaded area indicates confidence interval. (e) mtVars calling from an adult mouse brain (coronal section) special transcriptomics (ST) data66. Pearson correlation coefficient heat map of mtVars proportions for distinct tissue layers in mouse left (L) and right (R) brain. Olfactory nerve layer (ONL) in between left and right is marked as middle (M). Annotations from original study are used here. Lineage tree suggests that tissue layers are established before L-R axis commitment during brain development. (f) Dendrogram of Pearson correlation coefficient heat map using only mtVars (10X ST data) from human breast cancer67. mtVars can identify clonal relationship in human breast cancer tissues corresponding to copy number based clonal relationship: clone 2 and clone 3 are closely related compared to clone 167. Duct annotations from original study are used here and the dendrogram- corresponding heat map is not shown here. (g) NSC-seq encapsulation of mouse peripheral blood (PB) cells, followed by cell type annotation using marker genes (dot plot). (h) Pearson correlation coefficient heat map of variant proportions using mtVars for selected cell types is presented as pseudobulk. (i) Pearson correlation coefficient heat map of variant proportions combining hgRNAs and mtVars for selected cell types is presented as pseudobulk. (j) Reconstruction of single cell lineage tree using custom LinTiMaT pipeline39. See supplemental methods and GitHub page. Cells in the leaf are broadly colored by lymphoid and myeloid lineages. Panel a and b created using BioRender (https://BioRender.com).
Lineage and cell division tracking
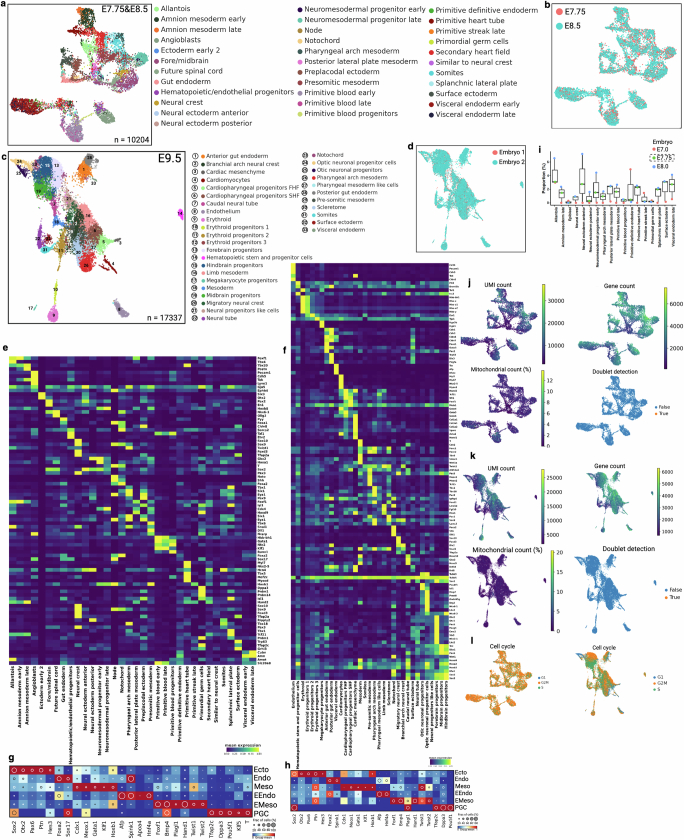
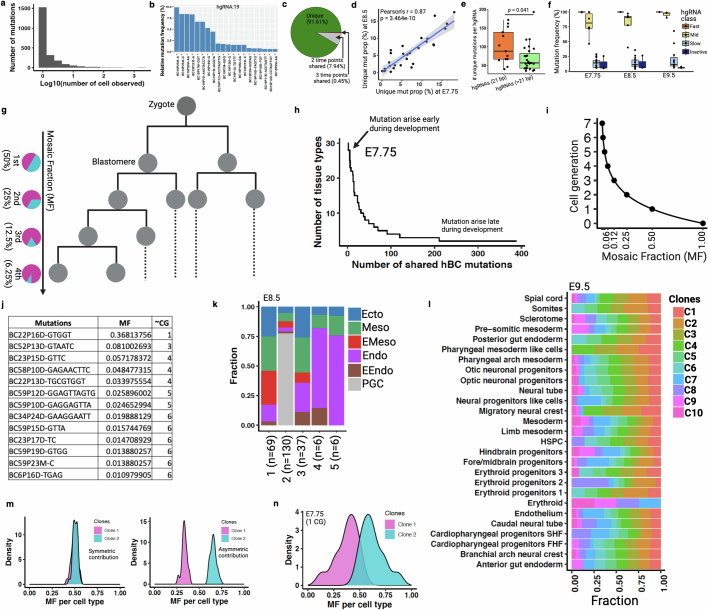
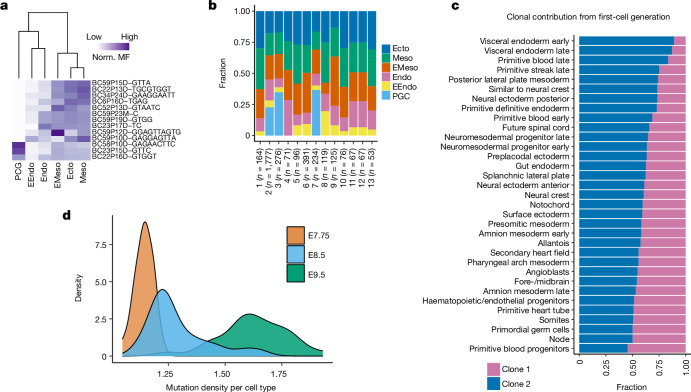
We then analysed the combined single-cell barcoding and transcriptome data of time point embryonic day (E)7.75, E8.5 and E9.5 embryos to glean biological insights pertaining to early development. Cell type annotation using conventional gene expression analysis showed canonical cell types and germ layers at each of the time points14,25 (Extended Data Fig. 4 and Supplementary Information). Consistent with the established timeline of mammalian development, more defined cell types emerged at E9.5 compared with earlier time points (E7.75/8.5), prompting two separate sets of cellular annotations (Extended Data Fig. 4a–h). Our data corresponded well with previously generated scRNA-seq data at E7.0 and E8.0, supporting the premise that our single-cell embryonic data were collected at the correct developmental times (Extended Data Fig. 4i), with data quality typical of this experimental platform (Extended Data Fig. 4j–l and Supplementary Methods). Our quality assessments focusing specifically on barcode mutations—including distribution of mutations amongst cells, frequency of different types of mutations, incidence of random collision mutations, number of mutations as a function of cell type, barcode lengths and barcode classifications—were consistent with previous reports21 (Extended Data Fig. 5a–f). We retrospectively investigated the initial phases of development by analysis of early embryonic mutations (EEMs), which manifest during the earliest cell divisions and are inherited by a substantial portion of cells within the embryo (Extended Data Fig. 5g,h). The proportional presence of these mutations amongst cells, referred to as the mosaic fraction, is an indicator of the cell generation when these mutations originated (Extended Data Fig. 5i,j). Progressive restriction of EEMs shared in tissues enables the use of mosaic fractions to model early divergence of germ layers and tissue types (Fig. 2a). Mouse primordial germ cell (PGC) lineage segregated from other embryonic and extra-embryonic lineages, supporting the early allocation of cells to the PGC lineage that has been reported in mice26 and humans27. We also found a similar mosaic fraction between mesoderm and ectoderm that supported a shared progenitor population, as previously reported28. Notably, extra-embryonic endoderm (EEndo) and embryonic endoderm (Endo) cells appeared to share origins, although these are reported to originate from two distinct tissue layers, hypoblast and epiblast, respectively. However, there is literature supporting some degree of shared progenitors, lineage convergence and intermixing between these tissues14,25,29,30. We also assessed the clonal contributions of different EEMs towards germ layers (early) or tissue types (late) and observed unequal contribution between different early clones (Fig. 2b and Extended Data Fig. 5k,l). We found unequal partitioning of first-cell generation clones across different tissue types (Fig. 2c; P = 1.057 × 10⁻¹³), suggesting that the specific lineage commitment of early embryonic progenitors is not predetermined, but rather subject to potential stochastic processes (Extended Data Fig. 5m,n). This phenomenon has previously been reported in mammals but was not observed in C. elegans31,32.
Extended Data Fig. 4. Cell-type annotation and data quality control metrics for mouse embryos.
(a) Uniform manifold approximation and projection (UMAP) embedding shows cell populations from two embryos. Cells are colored by annotated cell types. See supplemental note for embryonic cell type annotation. (b) Cells are colored by two embryonic time points. (c) UMAP embedding of two E9.5 embryos and cell type annotation. (d) Cells are colored by embryo number. (e-f) Heat map of mean expression of selective marker genes (y axis) for each cell type (x axis). Counts are normalized to median library size and log transformed. Separate heatmaps e and f are corresponding to a and c, respectively. (g-h) Dot plots of representative germ layers specific marker genes. Annotated cell types are grouped into germ layers for E7.75&E8.5 (g) and E9.5 (h) embryos. The size of the circle denotes the fraction of marker-positive cells, and color intensity indicates normalized group mean. (i) Box plots representing tissue proportions from E7.0, E7.75, and E8.0. Only E7.75 embryo is from this study. The proportion of shared selective cell types from wild-type embryos (E7.0 and E8.0) are calculated from GSE122187. Box plots show the median (n = 3 embryos), box edges represent the first and third quartiles, and the whiskers extend to a minimum and a maximum of 1.5 × IQR beyond the box. (j-k) UMAP plots are colored by unique molecular identifiers (UMIs), number of unique genes detected per cell, percentage of mitochondrial gene counts per cell, and predicted doublet score (Scrublet)68. See supplemental method and GitHub section for further data filter and quality control approaches. (l) UMAPs represent cell cycle status.
Extended Data Fig. 5. Temporal recording reveals asymmetric contribution of early embryonic clones to germ layers and tissue types.
(a) The histogram represents the number of cells in which each mutant allele is observed across three embryonic time points (3-ETP). (b) The top mutation frequency distribution is shown from a representative 21 bp long barcode of two E9.5 embryos. The mutation code along the x-axis is as follows: barcode number (BC), barcode position (P), mutation type (insertion, I; deletion, D; mismatch, M), and mutated base(s). (c) Proportion of shared and unique mutations across 3-ETP. (d) Scatter plot shows the proportion of unique mutations within each annotated cell types between E7.75 and E8.5 embryos. Pearson’s correlation (r) and p value (by F-test) are indicated. Shaded area indicates 95% confidence intervals of the regression line. See Extended Data Fig. 4 for cell type annotation. (e) Relatively fast mutation accumulation in small length hgRNAs, as reported before21. Data points are calculated from 3-ETP; p value is derived from unpaired two-tailed t-test. (f) Average hgRNA activity across time points. Box plots in e and f show the median, box edges represent the first and third quartiles, and the whiskers extend to a minimum and a maximum of 1.5 × IQR beyond the box. (g) A phylogenetic tree schematic represents early embryonic development. Mosaic fraction (MF) of somatic early embryonic mutations (EEMs) that are found across all three germ layers tracks cell generation (CG) stage32,69. MF represents the fraction of single cells that carry a certain mutation. (h) Distribution of hgRNA mutations that are shared between ≥ 2 tissue types at E7.75. The earlier a mutation arises during development; the more tissue types would share that mutation. (i) Relationship between MF and CG (. (j) EEMs and corresponding approximate CG for E7.75 embryo. Due to possible dropout in single-cell mutation detection, CG was assigned to the next closest CG stage as shown in i. (k) Unequal contribution of EEMs towards specific germ layers at E8.5. (l) MF distribution of 10 EEMs (found in >50% of tissue types) showing unequal contributions to specific tissue types at E9.5. The fraction of cells in each tissue contributed by clones C1 to C10 normalized by summing to 100%. (m) Simulated data representing symmetric (left) and asymmetric (right) contribution of first two clones (blastomeres) to tissue types during embryogenesis. (n) Asymmetric contribution of first two clones calculated from E7.75 embryo (Fig. 2c). Panel g created using BioRender (https://BioRender.com).
Fig. 2. Lineage and temporal recording of mouse embryogenesis.
a, Normalized (norm.) mosaic fraction (MF) of EEM heat map for E7.75 embryo, used to reconstruct lineage relationships within the major germ layers (Extended Data Figs. 5 and 7). b, Contribution of different EEMs towards various germ layers at E7.75. c, Clonal contribution from a first-cell-generation mutation (clone 1) at E7.75 across individual tissue types (P = 1.57 × 10⁻¹³, Kolmogorov–Smirnov test for the null hypothesis of symmetry) compared with all other clones aggregated as clone 2 (Extended Data Fig. 5l–n). d, Density plots representing cumulative turnover of different tissue types across three embryonic time points. The widths of mutation density distributions represent the variation by which different cell types have proliferated across time points (Extended Data Fig. 6 and Supplementary Table 2 show mutation density per cell type). EMeso, extra-embryonic mesoderm.
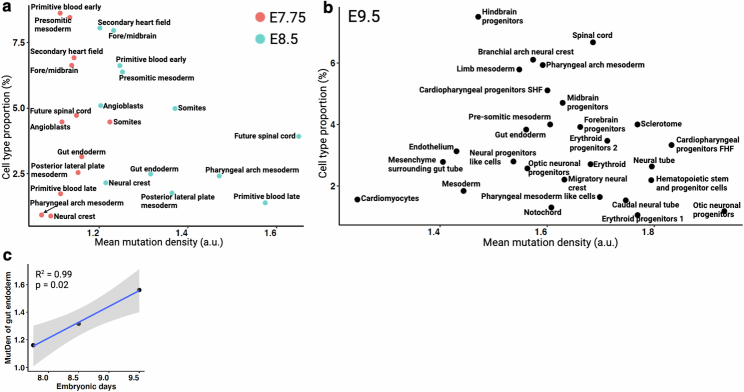
Regulation of organ size is a fundamental process of embryonic development, primarily governed by organ-specific cell division rates and, to a lesser extent, by rates of apoptosis33,34. Here, we developed a catalogue of cell division histories of different organs to show insights into the timing and scale of cell division across tissues during development (Supplementary Methods). Using mutations within NSC–seq barcodes, we quantified the cumulative number of cell divisions per tissue type at three gastrulation time points (Extended Data Fig. 6a,b and Supplementary Table 2). We observed that the relationship between the number of cell divisions and known tissue mass differs among various tissue types, which could be attributed to a number of variables, including differential progenitor field size, timing of progenitor specification, cell death, cellular lifespan and cell competition across tissue types35. In addition, our data showed a widening distribution of tissue-specific cumulative cell divisions at both the E8.5 and E9.5 stages, whereas a narrow unimodal distribution was observed for the E7.75 stage (Fig. 2d), suggesting that tissue-specific cell division and diversification initiates after the E7.75 stage. In general, we observed high proliferation of haematopoietic progenitors during gastrulation whereas cardiomyocytes and endothelial cells showed low proliferation (Extended Data Fig. 6a,b). We noticed an emergence of various intermediate haematopoietic progenitors at E9.5 with distinct cellular turnover histories, supporting diverse roots of haematopoiesis during early embryonic development as previously reported36,37. Cumulative cell division levels for forebrain progenitors were higher than those for hindbrain progenitors (Extended Data Fig. 6b), supporting known turnover kinetics that maintain relative sizes of brain regions during mammalian neurogenesis35,38. In addition, we found a constant rate of cell proliferation for gut endoderm over embryonic time points, similar to the turnover of the adult intestinal epithelium (Extended Data Figs. 2e and 6c). Overall, differential proliferation timing and kinetics among organs during gastrulation were observed. These variations mainly corresponded to organ size, although there were exceptions. We also demonstrated that, for certain tissues, proliferation rates were set during gastrulation and persisted throughout life33. Overall, this catalogue serves as a basis for the study of embryonic cellular proliferation kinetics and adds a temporal axis in lineage diversification1 to complement lineage tracking.
Extended Data Fig. 6. Catalog of cellular turnover across embryonic timepoints.
(a) Comparative mutation density that corresponds to cellular turnover between two time points (E7.75 and E8.5). Here we show only a selective list of tissue types. See supplemental table 2 for mutation density of all the tissue types. The difference between Primitive blood early vs late at E8.5, implies that this cell type is highly proliferating and/or this cell type is derived from alternative high proliferating progenitors. (b) Cellular turnover across cell types at E9.5 embryo. Hematopoietic cell types show relatively high cellular turnover compared to other somatic cell types. (c) Consistent increase of gut endoderm cellular turnover across 3-ETP. Pearson’s coefficient of determinant (R2) and p value (by F-test) are indicated. Shaded area indicates 95% confidence intervals of the regression line.
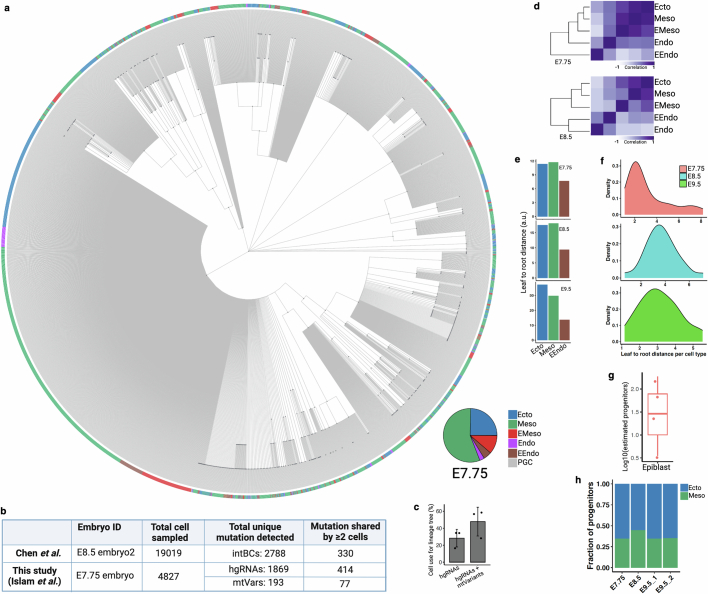
Next, a single-cell phylogenetic reconstruction39 (Supplementary Methods) was conducted using NSC–seq data, which provided more informative mutations for lineage analysis compared with previous approaches (Extended Data Fig. 7a–c). Pseudobulk reconstruction of embryonic tissue relationships generally reflected canonical knowledge of germ layer development (Extended Data Fig. 7d). Phylogenetic distance analysis from a single-cell tree supports the closer proximity of EEndo to root compared with Endo or embryonic mesoderm (Meso) to root (Extended Data Fig. 7e). A wider distribution of phylogenetic distances across cell types was observed at E8.5 and E9.5 compared with E7.75 (Extended Data Fig. 7f), supporting the initiation of tissue-type diversification following E7.75 as illustrated above (Fig. 2d). Furthermore, computational inference from single-cell lineage tree topology (Supplementary Methods) estimated the number of epiblast progenitors (n of around 28) and extrapolated unequal progenitor field size between ectoderm and mesoderm stemming from these progenitors (Extended Data Fig. 7g,h). These data underscore the robustness of using a temporal and lineage-tracking approach in deriving new insights into early mammalian development and organogenesis.
Extended Data Fig. 7. Lineage reconstruction of mouse embryogenesis.
(a) Reconstructed single-cell lineage tree from E7.75 embryo. Leaf cells are colored by germ layer colors and the proportions of cells in the tree are shown as a pie chart (inset). Nodes are colored by dark gray. Each branch represents an independent mutation event. Non-binary single-cell trees for all embryos and adult tissues can be found in NSC-seq GitHub page. (b) Table summarizing the lineage informative mutations (shared between ≥ 2 cells) detected between two studies (Chen et al.14 and this study) that performed similar whole mouse embryonic lineage tracking using constitutive Cas9. Here, we compared only the best reported embryo data between two studies. (c) After combining mtVars with hgRNA mutations, number of cells with lineage informative mutations increases for single-cell lineage tree reconstruction. Note that there are high variabilities in the proportion of cell that can be used for lineage tree reconstruction among samples due to multiple reasons, including the barcode detection limit, sequencing depth, number of cells captured per experiment, and time required to accumulate mutations. Bar plots, mean (n = 3 independent NSC-seq libraries); error bar, mean ± s.d. (d) Pearson correlation coefficient heat maps of variant proportions combining hgRNAs and mtVars for germ layers presented as pseudobulk. (e) Phylogenetic distance proportion was calculated (Supplemental method) from reconstructed lineage trees using reported approach70. Extraembryonic endoderm (EEndo) shows less distance from root compared to ectoderm or mesoderm across embryos, supporting nearby proximity to root (zygote). (f) Distribution of normalized phylogenetic distance (leaf to root) for annotated cell types. Wide distribution of the distance across cell types are found at E8.5 and E9.5 compared to E7.75, supporting minimal lineage divergence at E7.75 stage, similar to minimal tissue-specific proliferation reported before (Fig. 2d). (g) Estimated epiblast progenitor number calculated across embryos (n = 4) using reported approach71. Average number of epiblast progenitor field size is around 28, similar to previous report14. High variability may reflect embryo specific constrain in pluripotent cells number that contributes to somatic lineages72. Box plot shows the median, box edges represent the first and third quartiles, and the whiskers extend to a minimum and a maximum of 1.5 × IQR beyond the box. (h) Proportion of estimated progenitor population between ectoderm and mesoderm. It has been reported that the number of ectoderm progenitors is more than the number of mesoderm progenitors at the epiblast of the prestreak stage mouse embryo73. Panel b created using BioRender (https://BioRender.com).
Unconventional lineage diversification
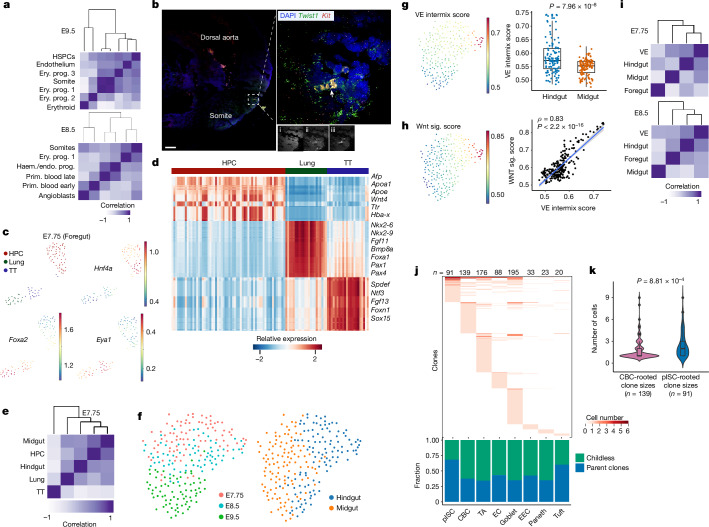
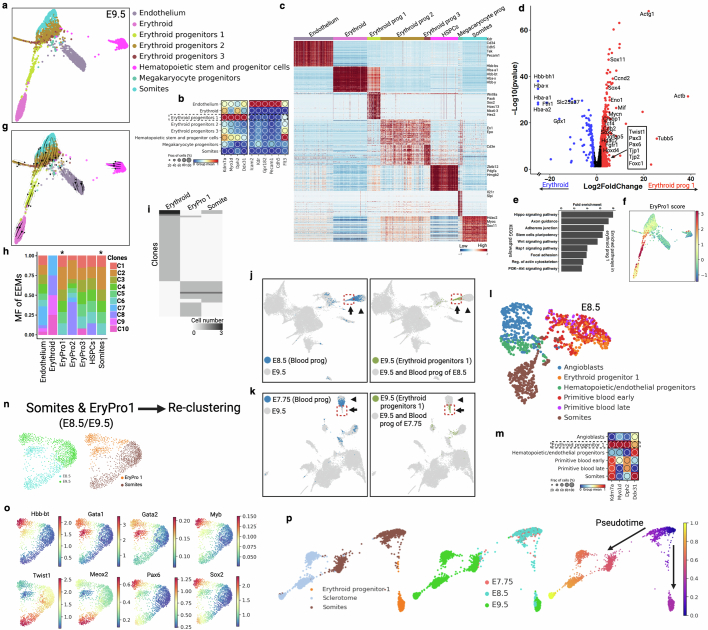
We highlight three examples of unconventional lineage diversification that we identified during embryonic development. Lineage analysis at both E8.5 and E9.5 indicated that erythroid progenitor 1 (EryPro1) shares common ancestry with somite (Fig. 3a). We then reanalysed somite, endothelium and haematopoietic cell types, all potential progenitors to EryPro1, and found that EryPro1 did not express yolk sac (Icam2, Krd and Gpr182), endothelial (Pecam1) or embryonic multipotent progenitor markers (Flt3) (Extended Data Fig. 8a–c). By contrast, EryPro1 expressed somite-specific markers (Twist1 and Sox11) and showed upregulation of Wnt signalling, which comprised an EryPro1-specific gene signature (Extended Data Fig. 8d–f and Supplementary Table 3). In addition, RNA velocity, mosaic fraction of EEMs and clonal analyses all supported a developmental relationship from somite to EryPro1 (Extended Data Fig. 8g–i). Indeed, multiplex HCR RNA–fluorescence in situ hybridization (FISH) of somite and erythroid markers showed a cluster of Kit+ erythroid cells in the somite region of the E9.5 embryo (Fig. 3b), supporting a somite-derived erythroid progenitor population. The EryPro1 population is present at E8.5 but not at E7.75, whereas somite cells were observable at E7.75 (Extended Data Fig. 8j–m). Gene expression analysis showed that some somite cells from E8.5 coexpressed haematopoietic transcription factors (Gata1 and Gata2) and low levels of the haemoglobin gene (Hbb-bt), suggesting a cell state transition from somite to EryPro1 (Extended Data Fig. 8n,o). Finally, pseudotime analysis showed a distinct developmental trajectory from somite to EryPro1, in addition to the expected trajectory from somite to sclerotome (Extended Data Fig. 8p). Thus, our data show a previously unidentified somite-derived haematopoietic population during late gastrulation of mammalian development, with similarities to that of zebrafish37.
Fig. 3. Embryonic lineage diversification and gut development.
a, Pearson correlation coefficient heat maps of variant proportions, presented as pseudobulk within haematopoietic and somite cell types. b, Multiplex HCR RNA–FISH staining of somite (Twist1) and haematopoietic (Kit) markers in a E9.5 embryo. A cluster of haematopoietic cells (white arrowhead) in the somite area is shown in the inset (right). DAPI (i), Twist1 (ii) and Kit (iii) (Extended Data Fig. 8). Results were validated in more than three independent experiments. Scale bar, 100 μm. c, Foregut cells (E7.75) coloured by annotated tissue types. d, Heat map of differentially expressed genes among three foregut tissue types at E7.75. e, Pearson correlation coefficient heat map of distinct tissue types (Extended Data Fig. 9). f, Midgut and hindgut cells coloured by embryonic time points and regions. g, Visceral endoderm (VE) intermix score overlay onto f. Quantification of VE intermix score in hindgut compared with midgut cells (n = 3 embryos per group). Box plots show the median and first and third quartiles, with whiskers extending to 1.5× interquartile region beyond the box. Unpaired two-tailed t-test. h, Wnt signalling score overlaid onto f. Pearson correlation analysis between Wnt signalling score and VE intermix score. Correlations and P values (by F-test) and 95% confidence intervals (shaded area) are indicated. i, Pearson correlation coefficient heat maps of gut regions with VE from E7.75 and E8.5 embryos. j, Distribution of clones across cell types in adult mouse small intestinal epithelium (Extended Data Fig. 11). The plot (below) shows the fractions of parent and childless clones comprising each cell type (Extended Data Figs. 10j and 11). k, Violin plots of CBC- and pISC-rooted clone sizes. Box plots within violins show the median value and box edges represent the first and third quartiles; unpaired two-tailed t-test. EC, enterocytes; EEC, enteroendocrine cells; TA, transit-amplifying cells; TT, thyroid/thymus.
Extended Data Fig. 8. Somite-derived hematopoiesis.
(a) Force-directed layout of hematopoietic cell types and somite from E9.5 embryos. See Extended Data Fig. 4c for annotation. (b) Dot plots show overexpressed genes in EryPro1 along with yolk sac (Icam2, Kdr, and Gpr182), or endothelial (Pecam1, and Cdh5) genes. EryPro1 doesn’t express a recently reported embryonic multipotent progenitor (eMMP) marker Flt374. (c) Heat map shows differentially expressed genes among the cell types. Cell type-specific selective list of genes are marked on the right. HSPCs, hematopoietic stem and progenitor cells. (d) A volcano plot represents differentially expressed genes (DEGs) between Erythroid and EryPro1(LCF > 2, p value < 0.05). P values derived from Wilcoxon rank-sum test, not corrected for multiple testing. Red dots are upregulated in EryPro1, blue dots are upregulated in Erythroid, and black dots are statistically not significant. (e) Enriched pathways in EryPro1 group. (f) Cells are marked by EryPro1 score. The list of genes for the signature score is shown in Supplemental table 3. (g) RNA velocity overlay shows direction from somites to EryPro1, supporting cell state transition. (h) MF of EEMs shows similar contribution (asterisk) to both somite and EryPro1, supporting similar early embryonic origin (Extended Data Fig. 5l). (i) Heat map represents shared clones (barcode mutations) across three cell types. (j) UMAP co-embedding of blood progenitor cells (blue) from E8.5 (Extended Data Fig. 4a) with E9.5 cells (gray). Arrow shows EryPro1 cluster and arrowhead shows Erythroid cluster. EryPro1 cells from E9.5 are marked by red dotted line (right). EryPro1 population is present in E8.5 embryo. (k) Similar as panel j with blood progenitor cells from E7.75. There is insignificant overlapping population in EryPro1 cluster (arrow), implicating that EryPro1 is not present yet at E7.75 stage. (l) Force-directed layout of blood progenitor cell types with somites at E8.5. EryPro1 assigned from overlapping cluster (arrow) in j. (m) A list of gene upregulates in EryPro1 is shown as dot plot. (n) Force-directed layout of EryPro1 and somites and two time points using Harmony29 and cells are colored by time points and cell types. (o) Expression of somites- and erythroid-specific genes are shown here. Somite to EryPro1 transitioning cells show transient expression of both hematopoietic (Gata1) and somite (Twist1) markers. Post-imputed (MAGIC) gene expression values are shown here75. (p) Force-directed layout of three cell types and three time points. Cells are colored by Palantir76 pseudo-time trajectory (right). See Fig. 3a,b.
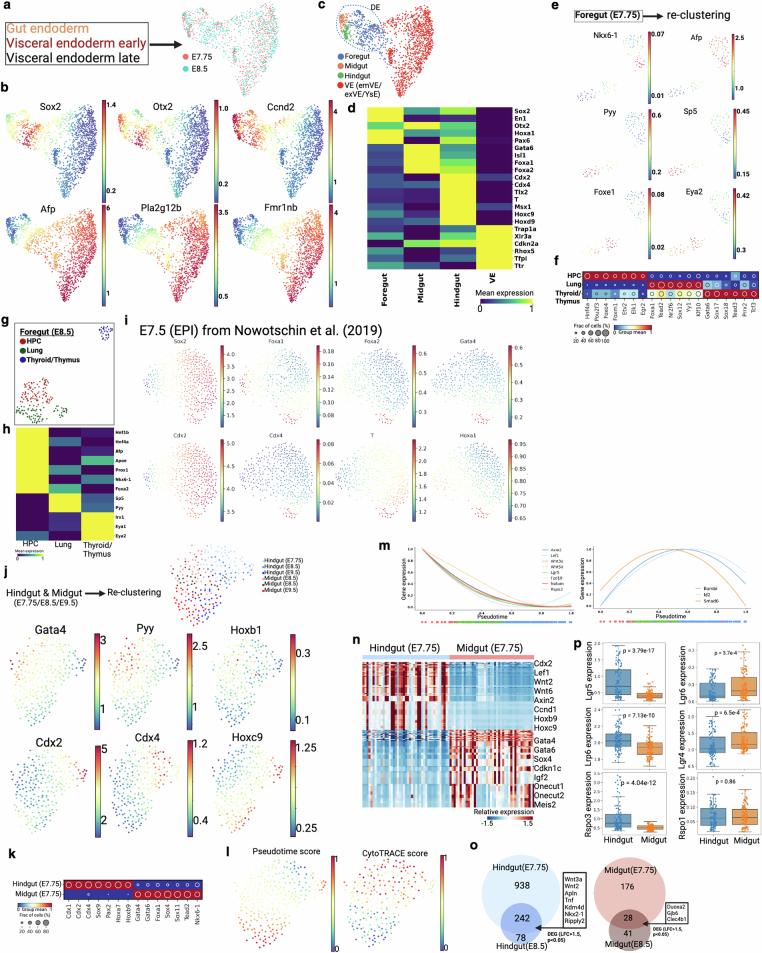
We next sought to understand gut endoderm development in the context of regionalization and the timing of progenitor specification. Endoderm (definitive and visceral) cell populations from E7.75 and E8.5 embryos were plotted together to show region-specific markers as early as E7.75, implying regionalization (spatial patterning) at that early time point (Extended Data Fig. 9a–d). We then focused our analysis on region-specific progenitors of the gut at E7.75. Analysis of the foregut population from E7.75 showed three distinct clusters: hepatopancreatic (HPC) progenitors (Hnf4a+), lung progenitors (Foxa2+) and thyroid/thymus (TT) progenitors (Eya1+) (Fig. 3c). Gene expression, regulon activity and lineage analysis showed that the HPC population is relatively distinct from lung and thyroid/thymus progenitors (Fig. 3d,e and Extended Data Fig. 9e,f). Similar progenitor populations from the foregut were found at E8.5 (Extended Data Fig. 9g,h) but not at E7.5 (Extended Data Fig. 9i), implying precise timing of progenitor specification at E7.75. Analysis of the remaining definitive endoderm populations similarly showed distinct gene expression patterns between midgut (Gata4, Pyy and Hoxb1) and hindgut (Cdx2, Cdx4 and Hoxc9) progenitors as early as E7.75 (Fig. 3f and Extended Data Fig. 9j). Regulon analysis also suggested distinct region-specific activities for midgut (Gata4, Foxa1 and Sox11) and hindgut (Cdx2, Sox9 and Pax2) progenitors at this time point (Extended Data Fig. 9k). Pseudotime and CytoTRACE analyses resulted in an expected developmental trajectory from E7.75 to E9.5 (Extended Data Fig. 9l). We found notable region-specific differences in Wnt and bone morphogenetic protein (BMP) signalling over developmental pseudotime (Extended Data Fig. 9m). Significantly higher Wnt signalling activity was observed in hindgut compared with midgut progenitors at E7.75 (Extended Data Fig. 9n,o). Consistent with the literature, the Wnt target gene Lgr5, a canonical intestinal stem cell marker, was highly expressed in hindgut40 whereas Lgr4 and Lgr6 were expressed in midgut (Extended Data Fig. 9p). Our results showed early differential usage of developmental signalling pathways between progenitors of different regions, supporting an early progenitor specification model during endoderm development41.
Extended Data Fig. 9. Gut endoderm development and progenitor specification.
(a) Force-directed layout of three endoderm clusters from Extended Data Fig. 4a. Cells are colored by two embryonic time points. (b) Gene expression of definitive endoderm (Sox2, Otx2, and Ccnd2) and visceral endoderm (Afp, Pla2g12b, and Fmr1nb) specific markers. (c-d) Based on region specific marker gene expression, DE (dotted line) is divided into three clusters, supporting regionalization of gut endoderm. Here, VE is the combination of embryonic visceral endoderm (emVE), extra-embryonic visceral endoderm (exVE), and yolk sac endoderm (YsE). Heat map of selective gut specific marker genes (y axis) as mean expression for each tissue type (x axis) are shown here in d. (e) Force-directed layout of foregut cells from E7.75 embryo. Three clusters are associated with three progenitor population. HPC, hepatopancreatic cells. Gene expression of HPC (Nkx6-1, Afp), lung (Pyy, Sp5), and thyroid/thymus (Foxe1, and Eye2) clusters are shown here. See Fig. 3c for more genes. (f) Regulon activity is shown across the three tissue types. (g-h) Force-directed layout of foregut cells from E8.5 embryo. Heat map of selective marker genes (y axis) as mean expression for each tissue type (x axis). (i) Force-directed layout of epiblast cells at E7.5. This scRNA-seq data and epiblast annotations are taken from a previous study29. Cells are colored by gut progenitor specific markers. (j) Force-directed layout of hindgut and midgut cells from three embryonic time points. Cells are colored by three time points and two corresponding tissue types. Midgut (Gata4, Pyy, and Hoxb1) and hindgut (Cdx2, Cdx4, and Hoxc9) specific markers are shown in the bottom. (k) Regulon activity of hindgut and midgut cells at E7.75. (l) Palantir pseudo-time76 and CytoTRACE score77 distribution in midgut and hindgut across three time points. (m) Normalized Wnt and Bmp signaling gene expression dynamics. X-axis trajectory over pseudo-time shown in l. Dot points below the plots are the pseudo-time coordinates of cells from each time point colored according to time point as in Fig. 3f. (n) Heat map shows differential gene expression between hindgut and midgut at E7.75. Cell type-specific selective list of genes are marked on the right. (o) Venn diagram of genes that were upregulated in both E7.75 and E8.5 time point of hindgut and midgut area. (p) Box plots representing normalized expression of Wnt signaling genes between hindgut and midgut for all three time points. Intestinal stem cell marker Lgr5 is overexpressed in hindgut, whereas Lgr4 and Lgr6 are overexpressed in midgut. Box plots show the median, box edges represent the first and third quartiles, and the whiskers extend to a minimum and a maximum of 1.5 × IQR beyond the box. P values are derived from unpaired two-tailed t-test.
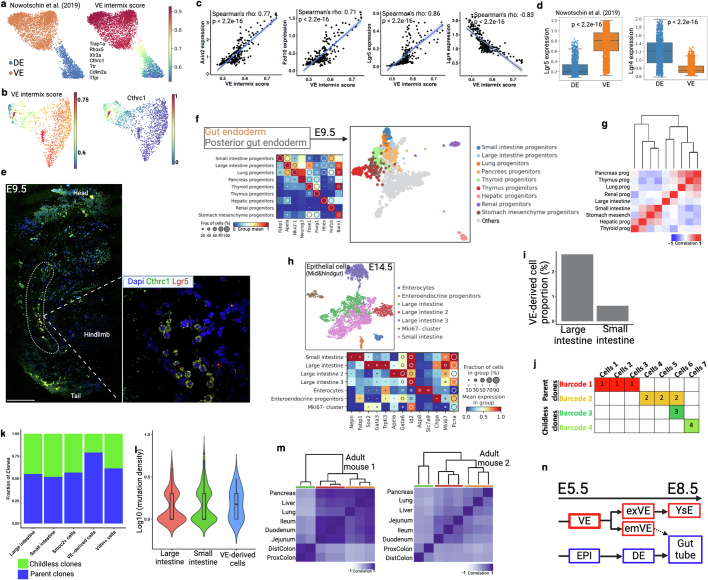
We also examined the lineage relationship between visceral and definitive endoderm during embryonic development. We derived a visceral endoderm score using reported visceral endoderm infiltration-specific marker genes and showed that this score could accurately mark sorted visceral endoderm-derived cells (Extended Data Fig. 10a). Application of this score to our data identified cells demonstrating high visceral/definitive endoderm intermixing in the developing hindgut (Fig. 3g and Extended Data Fig. 10b). We found that the visceral endoderm intermixing score correlated with a Wnt signalling score and Wnt-response genes (Lgr5, Axin2 and Fzd10) (Fig. 3h and Extended Data Fig. 10c), which is supported by higher Lgr5 expression in sorted visceral than in definitive endoderm-derived cells (Extended Data Fig. 10d). Multiplex HCR RNA–FISH showed the presence of cells coexpressing Lgr5 and the visceral endoderm marker gene Cthrc1 in the posterior gut region (dotted line, Extended Data Fig. 10e). Lineage analysis using mutational barcodes supports a lineage relationship between hindgut and visceral endoderm, probably resulting from visceral endoderm-derived cells mixing into the hindgut during gastrulation (Fig. 3i). This relationship persists at E9.5, as supported by differential lineages between midgut and hindgut (Extended Data Fig. 10f,g). To determine the role of visceral endoderm-derived cells post gastrulation, we analysed midgut and hindgut tissues at the E14.5 time point and found that the hindgut epithelium has a higher visceral endoderm intermix score than that of the midgut (Extended Data Fig. 10h,i), consistent with the results above. We then assessed the ability of these cells to contribute to epithelial development by performing a ‘parent–childless’ clonal analysis using an established approach15 (Extended Data Fig. 10j). Visceral endoderm-derived cells have a high parent clone fraction, implying that they have a higher potential to give rise to progeny (Extended Data Fig. 10k). Mutation density analysis also demonstrated that visceral endoderm-derived cells accumulated more divisions at E14.5 compared with other definitive endoderm-derived cells, highlighting their post-gastrulation activities (Extended Data Fig. 10l). Finally, we performed mutational barcode analysis of adult tissues derived from foregut, midgut and hindgut and found that hindgut-derived tissues maintain a separate lineage branch from midgut- and foregut-derived tissues, even into adulthood (Extended Data Fig. 10m). Thus, our data support previous reports of visceral endoderm-derived cells intermixing with definitive endoderm (Extended Data Fig. 10n) predominantly in the hindgut25, and their potential contribution to gut epithelial development14,25,29,30.
Extended Data Fig. 10. Lineage convergence during gut endoderm development.
(a) Force-directed layout of FACS enriched scRNA-seq data with cell type annotation at E8.75 embryos from a previous study29. Cells are marked by VE intermix signature that was developed from seven reported VE-specific marker genes (right). (b) Endoderm cells from E7.75 and E8.5 are marked by VE intermix score (see Extended Data Fig. 9c for annotation). High intermix score in hindgut area supports predominant VE intermix in hindgut25,30. VE marker gene Cthrc1, reported in a previous study25, preferentially marks VE intermix cells in hindgut (right). (c) Scatter plots representing Wnt signaling gene expression (y-axis) and VE-intermix score (x-axis). Blue line represents fitted linear regression line. Spearman correlation coefficient (ρ) and p value (by F-test) are indicated. Shaded area indicates 95% confidence intervals of the regression line. (d) Discordance in Lgr4 and Lgr5 expression pattern in DE- and VE-derived cells. Here we use data from a previous study29. Box plots show the median, box edges represent the first and third quartiles, and the whiskers extend to a minimum and a maximum of 1.5 × IQR beyond the box. P values are derived from unpaired two-tailed t-test. (e) Multiplex HCR-FISH co-staining of VE marker gene (Cthrc1) and Wnt target genes (Lgr5) at E9.5 embryo section. Inset is a posterior gut region adjacent to hindlimb. Results validated in more than three independent experiments. Scale bar, 300 μm. (f) Force-directed layout and re-clustering of two gut endoderm clusters from E9.5 embryos. (g) Lineage analysis of gut-derived progenitors. The large intestine (hindgut) and the small intestine (midgut) are in different branch of the dendrogram. (h) NSC-seq experiment on an E14.5 embryo. UMAP plot of epithelial cells broadly identifies as large intestinal and small intestinal using gene expression. (i) Relative proportion of VE-derived cells in large intestine and small intestine clusters are shown here. (j) Schematic of barcode-based clonal contribution analysis. If a barcode is present in more than one cell, it’s called as a parent clone (e.g., Barcode 1 and 2). Whereas, if a barcode is present in only one cell, it’s called as a childless clone (e.g., Barcode 3 and 4). Concept drawn from Bowling et al.15. The ratio of parent and childless clones is the indicator of relative contribution among the cell types. (k) VE-derived cells show high parent clone ratio, supporting high contribution to epithelial development. Villin+ cells and Smoc2+ cells are used as control. (l) VE-derived cells show relatively high mutation density corresponding to high cellular turnover. Box plots inside the violin show the median value (thick line), box edges represent the first and third quartiles. (m) Developmental lineage analysis of adult mouse gut-derived tissues from two biological replicates using bulk DNA barcodes. Hindgut (green), midgut (red), and foregut (yellow)-derived tissues in dendrogram colors. Hindgut is displayed as a distinct cluster compared to foregut and midgut. (n) Schematic of lineage relationship between definitive endoderm (DE) and visceral endoderm (VE). Dotted arrow represents intermix of VE and DE that eventually form gut tube. Schematic in n is adapted from ref. 29, Springer Nature Limited, and created using BioRender (https://BioRender.com).
Persisting progenitors of the gut
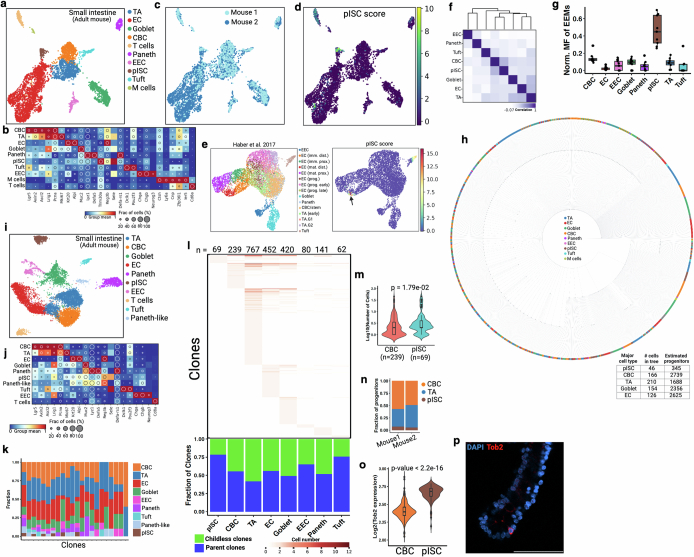
It is generally accepted that crypt-based columnar cells (CBCs) marked by Lgr5 serve as the homeostatic stem cell population driving continual renewal in the adult intestinal epithelium, and can be a cell of origin of tumours42. However, the embryonic origin of adult stem/progenitor cells remains elusive. Using NSC–seq, we identified a unique cell population related to enterocytes that persisted into the adult from their embryonic developmental origins; we have termed this population persister intestinal stem cells (pISCs) (Extended Data Fig. 11a–c). A gene signature derived from this cell population was also able to identify the same cells in another publicly available dataset (Extended Data Fig. 11d,e). Mutational lineage analysis demonstrates a developmental relationship between CBCs and pISCs, indicating that they potentially derive from each other (Extended Data Fig. 11f). However, pISCs exhibit a higher mosaic fraction, implying that they are derived from much earlier cell generations compared with CBCs, which develop relatively late during fetal intestinal development43 (Extended Data Fig. 11g). A smaller number of progenitors that give rise to these cells, as inferred from single-cell lineage tree topology (Extended Data Fig. 11h), supports their earlier specification stemming from the fewer progenitors available at earlier development. Clonal contribution analysis using hgRNA mutations demonstrates that the pISC population possesses a larger clone size, thus contributing more progenies to the intestinal epithelium than CBCs (Fig. 3j,k). This finding was consistently observed (Extended Data Fig. 11i–n), supporting the premise that the pISC population acts as a stem/progenitor-like population during intestinal development. Tob2 was identified as a selective marker of pISC cells, and Tob2+ cells were located at the bottom of adult small intestinal crypts by immunofluorescence analysis (Extended Data Fig. 11o,p). We propose that pISCs can act as stem/progenitor-like cells to populate the gut during embryogenesis, in contrast to the limited contribution of the CBC population at that time43. A study characterizing this population is in preparation.
Extended Data Fig. 11. Clonal dynamics of adult intestinal epithelium.
(a) UMAP representation of adult mouse small intestinal epithelial cell types. Note that crypt-enrichment was done for normal intestinal samples to increase cell type diversity. EEC, enteroendocrine cells; CBC, crypt-based columnar cells; pISC, persister intestinal stem cells; EC; enterocytes; TA, transit-amplifying cells. (b) Dot plot showing expression of marker genes for annotated cell types. Dot size represents the fraction of cells expressing the gene, and dot color represents normalized mean expression level. (c) Cells are colored by mouse number. We excluded mouse 2 from barcode analysis due to limited number of hgRNA detection in NSC-seq experiment. (d) A list of genes (including Tob2) is used to produce the pISC signature, which could mark a unique epithelial population in UMAP. See Supplemental table 3 for the gene list. (e) pISC score marks enterocyte-related cells (black arrow) in a published study78. (f) Pseudo-bulk lineage analysis of mouse small intestinal epithelium. (g) MF of EEM (n = 9) from mouse 1 across annotated cell type. Box plots show the median, box edges represent the first and third quartiles, and the whiskers extend to a minimum and a maximum of 1.5 × IQR beyond the box. (h) Single-cell lineage tree of adult intestinal epithelium from mouse 1. Inset table shows the number of estimated progenitors identified from tree topology for major intestinal cell types. (i) UMAP representation of an independent mouse small intestinal epithelium. (j) Dot plot shows expression of marker genes for annotated cell types. (k) Distribution of cell types across top 22 clones. (l) Distribution of hgRNA barcode mutations (clones) across cell types. Number at the top represents the total number of detected clones per cell type. Heat map color represents the number of cells found comprising a clone within a given cell type. A plot (below) showing the fraction of parent and childless clone comprising each cell type. (m) Violin plots represent CBC-rooted and pISC-rooted clone size. Box plots inside the violin show the median value (thick line), box edges represent the first and third quartiles. P value from unpaired two-tailed t-test. See Fig. 3j,k for more details. (n) The proportion of estimated progenitor populations among three cell types in two independent mice. Here, mouse 1 is from a and mouse 2 is from i. (o) Tob2, one of the pISC signature genes, expression in CBC and pISC population. Box plots inside the violin show the median value (thick line), box edges represent the first and third quartiles. P value from unpaired two-tailed t-test. (p) Whole-mount antibody staining of pISC marker gene Tob2 in mouse small intestinal crypt. Results validated in more than three independent experiments. Scale bar, 50 μm.
Clonal analysis of colorectal precancers
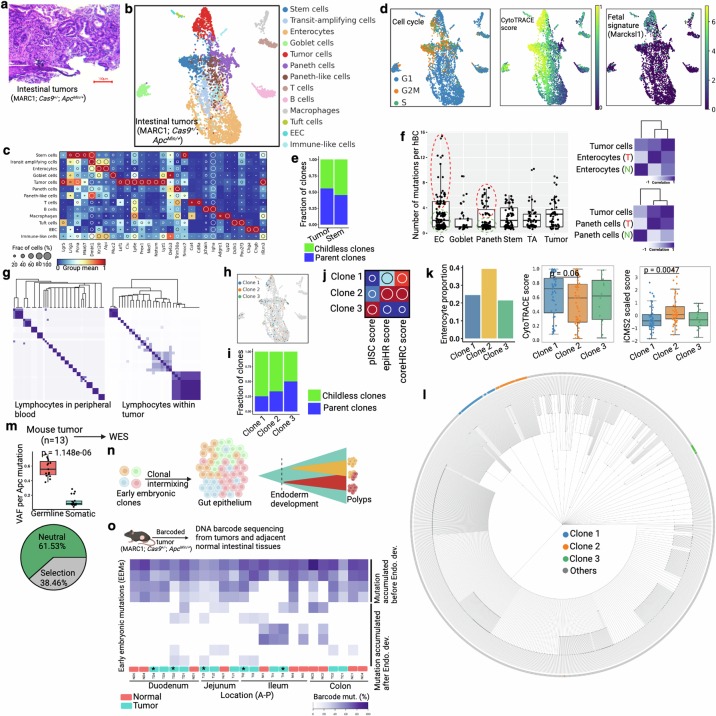
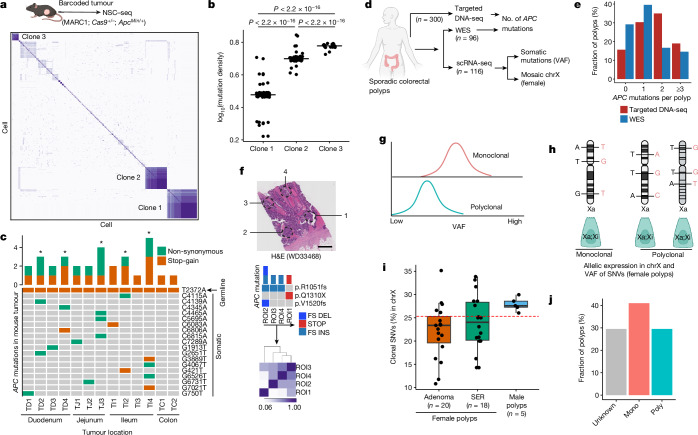
Tumours are often thought to form through aberrant developmental gene programs44. An unresolved issue in colon cancer is whether tumours arise from a single stem cell or from multiple progenitor cells to result in complex tissue systems. Thus, we used NSC–seq, in approaches akin to what we used to study developmental origins, to investigate the origins of tumorigenesis in the gut. The prevailing model, with support from human colorectal cancer data, is the monoclonal model, in which a tumour is initiated from a single stem cell45. However, selection and clonal sweeps that occur in advanced cancers tend to erase clonal histories occurring earlier in tumorigenesis46. Furthermore, lineage-tracing studies in the mouse have shown that some tumours can be initiated from multiple ancestors, resulting in tumours with multiple lineage labels47. We thus applied single-cell barcode tracking to delineate clonality during intestinal tumour initiation in ApcMin/+ mice, in which tumorigenesis occurs as a result of random mutations inactivating the second allele of Apc. We found that these tumours were composed of both normal and tumour-specific cells, similar to human adenomas in a previous study48 (Extended Data Fig. 12a–c and Supplementary Methods). Evaluation of tumour-specific cells using NSC–seq demonstrated increased proliferation signature, stemness, fetal gene expression (Marcksl1) and clonal contribution compared with normal CBCs (Extended Data Fig. 12d,e), consistent with the transformed features of these cells. Examination of phenotypically normal cells within the tumour showed normal-like progenies of tumour-specific cells, which can be distinguished from their normal counterparts by their higher barcode mutation densities and shared barcode mutation profiles with tumour cells (Extended Data Fig. 12f). These progenies consisted of enterocytes and Paneth cells, consistent with Wnt-restricted aberrant differentiation of intestinal tumour cells49. To delineate clonality, we first used shared barcode mutations in lymphocytes, demonstrating that tumour-infiltrating lymphocytes had expanded clonally compared with peripheral blood lymphocytes, which were mostly polyclonal (Extended Data Fig. 12g). A similar analysis showed three founder clones within tumour-specific cells (Fig. 4a). The three clones were distinct in many characteristics, including mutation density, clonal contribution, biased differentiation and gene expression signatures (Fig. 4b and Extended Data Fig. 12h–k). More importantly, single-cell phylogenetic analysis showed independent tumour founder clones arising from distinct normal epithelial ancestors (Extended Data Fig. 12l). Next, we performed whole-exome sequencing (WES) of 13 mouse intestinal tumours to assess the number of Apc mutations. Loss-of-function mutations in both APC alleles that result in Wnt pathway activation are considered the initiating event in the majority of sporadic human colorectal tumours50. Thus, the number of unique Apc mutations can be used to assess clonality during intestinal tumour initiation51. In a diploid genome, a monoclonally initiated tumour should present at most two unique Apc mutations that lead to loss of function of both alleles, given that there is no selective advantage for additional mutations. We found that five of the 13 mouse intestinal tumours had three or more unique mutations in the Apc gene, implying multiple founder clones (Fig. 4c). Moreover, around 40% of mouse tumours showed evolutionary selection pressure comparable to human adenomas (see below and Extended Data Fig. 12m). The normal cell of origin of tumour cells can also be examined by early embryonic clonal intermixing using barcode mutations in both tumour and adjacent normal tissues from the same mouse52. Early embryonic clonal intermixing was seen in four out of five mouse polyclonally initiated tumours (Extended Data Fig. 12n,o and Supplementary Table 4), indicating that barcode mutations used to determine polyclonality were also found in adjacent normal cells. A concurrent study demonstrates similar intrapatient embryonic clone sharing among multiple familial polyps within the same patient, demonstrating the possibility of polyclonal intestinal tumour formation in humans53, which supports our observations in mice.
Extended Data Fig. 12. Tracking clonal composition of murine intestinal adenomas.
(a) Hematoxylin and eosin (H&E) staining of ApcMin/+ -driven mouse intestinal tumor. This mouse model generates low grade tumors that are equivalent to human adenoma or precancer. (b-c) UMAP embedding of barcoded intestinal tumor cells from NSC-seq experiment. Tumor cell cluster is assigned based on expression of tumor-associated marker genes as shown in the dot plot in panel c. (d) Cell cycle status, CytoTRACE score, and fetal gene (Marcksl1) expression79 across annotated cell types. (e) Clonal contribution analysis for CBCs and Tumor cells. (f) Box plots represent number of mutations per homing barcodes (hBC) across major annotated cell types. Based on mutation density, EC and Paneth cells are divided into two groups: red (T) and green (N) doted circles. Box plots show the median, box edges represent the first and third quartiles, and the whiskers extend to a minimum and a maximum of 1.5 × IQR beyond the box. Lineage analysis of EC and Paneth cells subsets with Tumor cells supports tumor cell-derived Paneth and enterocyte population49. (g) Heat map represents pairwise barcode mutations correlation for lymphocytes. Peripheral blood lymphocytes are from Extended Data Fig. 3g and tumor infiltrating lymphocytes are from panel b. (h) Three clones are projected onto the UMAP. See Fig. 4a for clone assignment. (i) Differential parent clone fraction is shown for the three representative clones. (j) Dot plots represent differential distribution of pISC score, epiHR score, and coreHRC score across three clones80. (k) Differential distribution of enterocyte proportion, CytoTRACE score, and iCMS2 score across clones. Box plots (middle and right panels) show the median, box edges represent the first and third quartiles, and the whiskers extend to a minimum and a maximum of 1.5 × IQR beyond the box. P value from unpaired two-tailed t-test. (l) Single-cell lineage tree is reconstructed using cells from panel b. Clones are labeled by same color as in h. See Supplemental methods for lineage tree reconstruction. (m) WES of mouse tumors. Average germline VAF (~0.5) across the tumors supports diploid genome of these tumors. Box plots show the median, box edges represent the first and third quartiles, and the whiskers extend to a minimum and a maximum of 1.5 × IQR beyond the box. P value from unpaired two-tailed t-test. WES based tumor evolution model also supports selective evolutionary pressure in mouse tumors (bottom). See Fig. 4c for Apc mutation. (n) Schematic of early embryonic clonal intermix-based clonal initiation assessment. Some tumors could show mosaic early embryonic mutations, supporting possible polyclonal initiation (more than one early embryonic clones). (o) Heat map shows mosaic distribution of early embryonic mutations across regionally distinct tumors and adjacent normal tissues from the same mouse using DNA barcode sequencing. Color represents the proportion of mutant barcode. First four mutations are widely present across tissues, representing their initiation before endoderm development. Four of the five polyclonally initiated tumors (asterisk and assigned by the number of Apc mutation) show intermix of multiple early embryonic clonal that are also found in adjacent normal epithelium. This data suggests early intermixing of clones during mouse gut epithelial development and consistent with polyclonal origins of tumors attributed in human colorectal polyps53. See Supplement table 4 for location of tumors and adjacent normal tissues across intestinal epithelium. Panel n and o created using BioRender (https://BioRender.com).
Fig. 4. Clonal origin of colorectal precancer.
a, Pearson correlation coefficient heat maps of variants from mouse intestinal tumour (ApcMin/+)-derived single cells. Distinctly correlated regions are marked by three clones within the same tumour (Extended Data Fig. 12). b, Estimated mutation density for the three assigned clones in a. Black lines represent the median for each clone, unpaired two-tailed t-test. c, OncoPrint plot representing the number of Apc mutations across mouse tumours using WES. d, Overview of experimental design for profiling of clonal origin across multiple human datasets. e, Bar plots summarizing the number of APC mutations per polyp using targeted DNA sequencing and WES (Extended Data Fig. 13). f, Top, multiregion (punch biopsy) WES of a human CRC sample representing distinct APC mutations; bottom, Pearson correlation coefficient heat map of somatic mutations within regions of interest (ROI)13. Scale bar, 2 mm. g, Expected median VAF distribution under different clonal architectures. h, Mosaic X chromosome (chrX) inactivation patterns in female polyps can delineate the clonal origin of cells using expression-based, X-linked somatic clonal SNVs. Male polyps are considered monoclonal due to the single male X chromosome (Extended Data Fig. 14d–f and Supplementary Methods. i, Box plots representing distribution of X-linked clonal SNVs (%) between male and female polyps. Box plots show the median, box edges represent the first and third quartiles and whiskers extend to a minimum and maximum of 1.5× interquartile range beyond the box. Red dashed line is a cut-off to assign clonality in female polyps (Extended Data Fig. 14g,h). j, Summary of median VAF-based polyp profiling. a,d,g,h, Schematics created using BioRender (https://BioRender.com). H&E, haematoxylin and eosin; asterisk, polyclonal tumour; FS DEL, frameshift deletion; FS INS, frameshift insertion; STOP, stop codon.
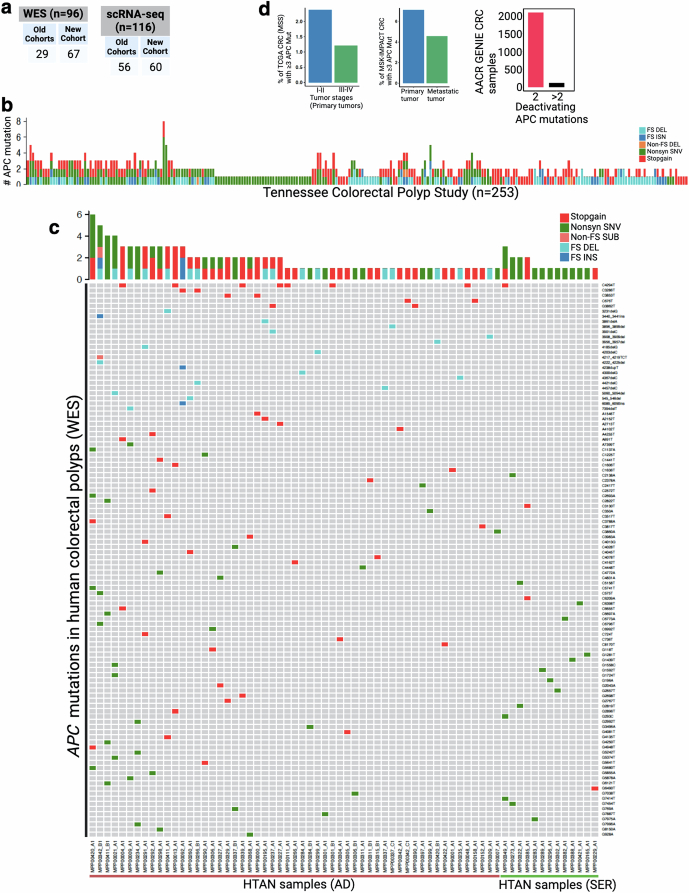
Whereas embryonic clone mixing can be leveraged only in hereditary diseases such as familial adenomatous polyposis, we sought to find evidence of polyclonal initiation in the two most common subtypes of human sporadic colonic precancer. We expect polyclonal initiation to occur in only a minor subset of polyps, thus requiring a large sample size analysis for our study. We therefore collected new scRNA-seq datasets, resulting in a total of 116 polyp datasets (adenomas (AD), 70; serrated polyps (SER), 42; unknown (UNK), 4) from three different cohorts of patients at Vanderbilt University Medical Center (VUMC)48 (Fig. 4d and Extended Data Fig. 13a). Out of these, 96 polyps (AD, 63; SER, 33) had matching WES data. These data were generated from distinct regions of the colon from a distribution of 96 patients of diverse racial backgrounds and ages (Supplementary Table 4). In addition, we analysed targeted DNA sequencing from 300 polyps from the Tennessee Colorectal Polyp Study to assess APC mutations48. Using Tennessee Colorectal Polyp Study data, we found that roughly 20% of polyps showed three or more unique APC mutations, implying more than one founder clone in those polyps (Fig. 4e and Extended Data Fig. 13b). Similar to these results, WES data from our VUMC polyp dataset showed that potential polyclonal initiation occurred in approximately 15% of polyps (Fig. 4e, Extended Data Fig. 13c and Supplementary Table 4). Although our study is mainly focused on precancers, we also performed APC mutation analysis using published multiregional WES in a cohort of 23 colorectal carcinoma (CRC) samples from VUMC13, which showed only one specimen exhibiting potential polyclonal initiation (Fig. 4f), consistent with other multiregional sequencing data that demonstrated a decrease in polyclonality in advanced cancer54. This is consistent with the occurrence of clonal sweeps during tumour progression—as seen in external cohort datasets—that erases the clonal history of tumour initiation55 (Extended Data Fig. 13d).
Extended Data Fig. 13. APC mutation assessment of human colorectal polyps.
(a) Distribution of human polyps across cohorts. New cohort polyp samples are generated for this study. Old cohorts (DIS and VAL) are reported before48 and re-analyzed collectively. See Supplemental table 4 for extended sample description. (b) Here, the number of APC gene mutations per polyp is shown using targeted DNA sequencing approach. Polyps without any APC mutations are not shown here. Note that TCPS cohort is predominantly conventional adenomas, as shown in48 See Fig. 4e and Supplemental table 4. FS DEL, frameshift deletion; INS, insertion. (c) OncoPrint plot represents the number of APC mutations across human polyps using WES. Here we only show polyps with at least one deactivating APC mutation. (d) Quantification of the number of APC mutation in three public CRC datasets81.
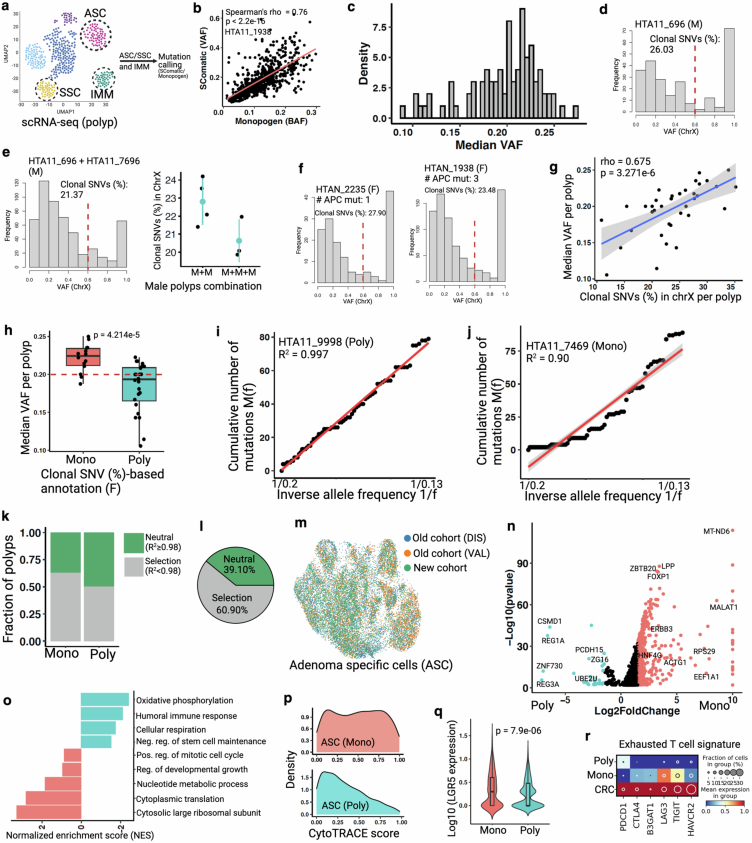
To provide additional clonality evidence, we called somatic single-nucleotide variations (SNVs) from single-cell transcriptomics data of colorectal polyps using two independent pipelines (Extended Data Fig. 14a,b). Clonal composition was then assessed using the variant allele frequency (VAF) distribution of somatic SNVs (Supplementary Methods). If a polyp is derived from a single founder clone, the VAF distribution of its somatic SNVs would be higher than that of a polyp initiated by multiple clones due to a higher fraction of shared SNVs across a single founder-derived population56,57 (Fig. 4g). We calculated the median VAF from polyps (n = 86) and found wide variation across them, implying the existence of both monoclonal and polyclonal polyps (Extended Data Fig. 14c). To establish a polyclonality cut-off based on VAF distribution, we leveraged the concept of X-linked inactivation in female polyps (n = 46). During early embryonic development in female individuals, one X chromosome in somatic cells becomes randomly silenced to balance X-linked gene dosage. This pattern persists in daughter cells, creating a mosaic of inactivated X chromosomes in adult female tissues. Therefore, somatic SNVs within X-linked transcripts can be used as developmental markers to track the clonal origin of cells in female individuals58 (Fig. 4h and Supplementary Methods). In male individuals with a single X chromosome, mosaic expression of X-linked genes is absent and thus male polyps can stand in as ‘monoclonally initiated’ when considering only X-linked SNVs (Extended Data Fig. 14d). We thus used simulations, mixing male polyps to establish baseline distributions of X-linked SNVs, to distinguish between monoclonally and polyclonally initiated polyps. As anticipated, the proportion of X-linked clonal SNVs decreased in relation to the degree of polyclonality (as simulated by the number of mixed male polyps) (Extended Data Fig. 14e). Examination of female polyps on the same scale showed a substantial number potentially to be initiated polyclonally (Fig. 4i); many of these were also classified as polyclonally initiated from APC mutation assessment (Extended Data Fig. 14f). A wide distribution of clonal X-linked SNVs in female polyps also indicated the potential for different numbers of founder clones (Fig. 4i). To extend the analysis to all single-cell SNVs in addition to X-linked SNVs, we examined VAF distributions in female polyps previously assigned as either monoclonally or polyclonally initiated based on X-linked SNVs. Assigned monoclonal polyps exhibited higher median VAF compared with polyclonally initiated polyps, and we were able to establish a median VAF distribution cut-off of 0.20 to identify polyclonal initiation (Extended Data Fig. 14g,h and Supplementary Table 4). Applying VAF distribution analysis to all polyps, we found approximately 29% to be polyclonally initiated (Fig. 4j and Supplementary Table 4), comparable to APC mutation-based assessments (Fig. 4e). Thus, analysis of multiple data types supports the premise that a substantial subset of human colorectal precancers arise from multiple non-cancer ancestors.
Extended Data Fig. 14. Multi-omic analysis of human colorectal polyps.
(a) Schematic representation of mutation calling from polyp-derived single cells. Here, we use transcriptionally assigned abnormal cells (ASC/SSC) to call somatic mutations (SNVs) as pseudo-bulk, with polyp infiltrating immune cells’ (IMM) SNVs as reference to remove germline variants from polyps. (b) Two independent approaches show similar somatic mutation detection from scRNA-seq dataset82,83. Spearman correlation coefficient (ρ) and p value (by F-test) are indicated. See Supplemental method for more details. (c) Density plot represents wide distribution of median VAF in polyps using SComatic82. (d) VAF distribution of X-linked SNVs in a male (M) polyp. Red line indicates cut-off (0.6) for clonal and subclonal SNVs. (e) Simulation experiment, intermixing cells from two or three independent male polyps, shows reduced clonal SNVs (%) depending on the number of polyps intermixed. Note that different polyps have different number of ASC/SSC cell types. Data (dot plots in the right) are mean ± s.d. (f) Frequency plots showing proportion of clonal SNVs (%) in two female (F) polyps with known number of APC mutations. (g) Scatter plot shows significant correlation between median VAF and X-liked clonal SNVs (%)84 in female polyps. Spearman correlation coefficient (ρ) and p value (by F-test) are indicated. Shaded area indicates 95% confidence intervals of the regression line. (h) Box plots show median VAF per monoclonally and polyclonally initiated female polyps (assigned in Fig. 4j). Red line shows medina VAF cut-off (<0.2) to assign clonality to all polyps, including male. Box plots show the median, box edges represent the first and third quartiles, and the whiskers extend to a minimum and a maximum of 1.5 × IQR beyond the box. P value from unpaired two-tailed t-test. (i-j) Linear regression model for allele frequency distribution of sub-clonal mutations46 that can differentiate between neutral (R2 ≥0.98) and selective (R2 < 0.98) evolutionary processes in tumor. Here we use SNVs from WES data. These two polyps are assigned as monoclonal and polyclonally initiated using the number of APC mutations in WES data. Pearson’s coefficient of determinant (R2) is indicated. (k) Monoclonal polyps show higher proportion of selective evolution compared to polyclonally initiated polyps. (l) Overall, ~60% of the polyps show selective clonal evolution. (m) ASC cells from three cohorts. See Chen et al. for cell type assignment48. (n) Volcano plot shows differential gene expression between monoclonal and polyclonally initiated ASC cells. A selective list of genes is labeled here. X-axis is truncated for monoclonal ASC. Only top and bottom median VAF polyps (10–12 polyps per group) derived cells are compared here (See Supplemental table 4). P values derived from Wilcoxon rank-sum test, not corrected for multiple testing. (o) Pathway analysis using DEG shows distinct molecular programs between monoclonal and polyclonally initiated polyps85. (p) High CytoTRACE score in monoclonal ASC cells compared to polyclonal ASC cells supports higher stem cell expansion phenotype in monoclonal polyps contributing to proliferative advantage and subsequent clonal selection. (q) Expression of canonical stem cell marker LGR5 (log10) between two groups. Box plots inside the violin show the median value (thick line), box edges represent the first and third quartiles. P value from unpaired two-tailed t-test. (r) Dot plot representing exhausted T cell signature in monoclonal, polyclonal polyps, as well as CRCs infiltrating immune cells48. Schematic in a created using BioRender (https://BioRender.com).
For additional orthogonal confirmation, we applied WES data to a linear model that distinguishes between neutral and selective evolution46 (Extended Data Fig. 14i,j). We found that a higher proportion of the assigned monoclonal polyps showed a signature of clonal selection (R2 < 0.98) compared with the assigned polyclonally initiated polyps (Extended Data Fig. 14k). Using this analysis, about 60% of polyps overall showed clonal selection (Extended Data Fig. 14l), suggesting a subset of polyclonally initiated tumours to be transitioning towards clonal selection, consistent with previous reports of selective pressures exerted during malignant progression46,55. Moreover, adenoma-specific cells of assigned monoclonal polyps showed higher expression of genes associated with cell cycle, nucleic acid synthesis and protein translation signatures than polyclonal polyps, which can be attributed to a highly proliferative, stem cell-expansion phenotype that may drive selection59 (Extended Data Fig. 14m–q). In addition, we found a signature of T cell exhaustion in the tumour microenvironment that is lowest in polyclonal polyps, intermediate in monoclonal polyps and highest in cancer, consistent with a transitional process of the tumour microenvironment (Extended Data Fig. 14r). These data suggest that selection can occur at the premalignant stage, with increased selective pressures potentially resulting in decreased polyclonality, which may prove to be a hallmark of the transition from precancer to cancer. Taken together, our results generated from human and mouse precancers provide insights into the evolutionary dynamics at the earliest stage of tumorigenesis in the mammalian colon.
Discussion
Identification of the origins of cells is an important endeavour in both developmental biology and cancer studies. This challenge becomes particularly pronounced when the progenitor cell is embedded within a specific subset of a given cell type. As an example, tumours can arise from a subset of normal cells in a seemingly random fashion or under the influence of factors that push them towards this fate. Using single-cell genomic information from 116 human colorectal polyps, we present orthogonal evidence from different analyses to demonstrate the substantial number of instances in which colorectal polyps emerge from multiple distinct clonal origins. Note that the frequency of polyclonal polyps reported in this study is probably an underestimation due to a variety of factors affecting the detection of polyclonality, including sequencing depth, and that a subset of polyps may be driven by mutations independent of APC (such as those seen in serrated polyps). In addition, monoclonal conversion in polyps may also have erased polyclonal history during tumour initiation, lowering detection rates. However, results from this study and the concurrent study by Schenck et al.53 demonstrate that polyclonal initiation is not only possible, but also perhaps common, for human colorectal polyps in both familial and sporadic settings. It is likely that the normal cells of origin arise from multiple monoclonal crypts, although it is possible that they may have arisen from the same crypt due to incomplete crypt purification52. This finding in the gut is in line with recent reports on polyclonal human breast cancer initiation57. The decrease in polyclonality observed in advanced cancer, coupled with clonal selection that can be observed in some, but not all, polyps, raises an intriguing possibility that the subset of polyps undergoing a selection process may be primed to progress to cancer. Hence, future research may elucidate whether clonality can serve as a predictive biomarker for precancers that will advance to malignancy, in contrast to polyps that maintain polyclonality. Nevertheless, approaches to functional study of the origins of predetermined cell fates in model systems are lacking. Here, we additionally leveraged clonal progeny generated by synthetic barcode mutations in a single-cell platform to enable retracing of cell lineage origins backwards in time.
We first applied this lineage-tracking platform to study mammalian development over different time scales from zygote to adult. Our analysis of gut endoderm development showed that regionalization of endoderm and progenitor specification initiated earlier than previously appreciated, and suggested that these two processes may occur simultaneously41. In addition, our gut lineage analysis showed convergence of cells from extra-embryonic origin to an embryonic endoderm state, supporting previous observations14,25,29,30, and extending the contribution of extra-embryonic cells to gut epithelial development. Moreover, temporal analysis of embryonic development showed a shift in tissue-specific cell expansion after E7.75. Hence, our study provides clues about developmental timing of lineage diversification that can prompt studies into extrinsic and/or intrinsic signalling that govern cellular turnover and organ size during development33,34. Lastly, clonal analysis and temporal recording applied to the ApcMin/+ mouse model functionally validated the possibility of polyclonal tumour initiation, to the extent that barcoded mutations can be traced back to multiple normal epithelial cell ancestors. Integrative analysis of the HTAN colorectal precancer atlas and mouse barcoding data allowed us to delineate factors that affect the earliest stages of tumour development, including clonal composition and molecular signatures influencing the clonal fitness landscape54,55,59. A model consistent with our results implies that selective pressures during tumour progression modulate transition from polyclonal composition in the early precancer stage towards a monoclonal composition55,60. However, polyclonal compositions do exist at the cancer stage, albeit rarely, and may even confer new biological functions to the tumour. Charting these complex, multistep evolutionary processes characterizing precancer-to-cancer transitions in human specimens may illuminate strategies for early intervention in the future.
Methods
A detailed description of the materials and methods used is available in the Supplementary Information.
Reporting summary
Further information on research design is available in the Nature Portfolio Reporting Summary linked to this article.
Online content
Any methods, additional references, Nature Portfolio reporting summaries, source data, extended data, supplementary information, acknowledgements, peer review information; details of author contributions and competing interests; and statements of data and code availability are available at 10.1038/s41586-024-07954-4.
Supplementary information
This merged file has multiple items listed in its Table of Contents. This includes Methods, embryonic cell type annotation, summary of software tools, Supplementary references and the captions of Supplementary tables.
Supplementary Table 1 shows primer sequences used in this study.
Supplementary Table 2 shows mutation density for each embryonic cell type.
Supplementary Table 3 shows the list of genes used for calculation of gene signature.
Supplementary Table 4 shows precancer analysis for human and mouse samples.
Source data
Source Data Extended Data Figs. 1–12 and 14
Acknowledgements
This publication is part of the HTAN consortium paper package. We thank the study participants and funding support by HTAN (nos. U2CCA233291 to R.J.C., K.S.L. and M.J.S.), TBEL (U54CA274367 to R.J.C., K.S.L. and M.J.S., R35CA197570 and P50CA236733 to R.J.C., R01DK103831 to K.S.L., K07CA122451 to M.J.S. and R01HG012357 to R.K.) and the Stanley Cohen Innovation Fund (to K.S.L). H.Z. is supported by SRG/2020/001333. We thank members of the Lau and Coffey laboratories (in particular, M. E. Bechard and S. E. Glass) for technical and editorial assistance. Cores used in this study included Survey and Biospecimen Shared Resource, TPSR (no. P30DK058404), VANTAGE (no. P30CA068485) and REDCap (no. UL1TR000445). 1cellbio and RAN biotechnologies helped in the synthesis of custom hydrogel beads. We also thank A. Hasty and A. Jones (VANTAGE) for their assistance. Vanderbilt University has submitted a US patent application for NSC–seq, with M.I., R.J.C. and K.S.L. listed as inventors. We apologize in advance to those we have failed to acknowledge due to space constraints. R.J.C. acknowledges the generous support of the Nicholas Tierney GI Cancer Memorial Fund.
Extended data figures and tables
Author contributions
Conceptualization was the responsibility of M.I. and K.S.L. Data curation was carried out by M.I., Y.Y., A.J.S., Y.X., P.M., M.A.R.-S., M.J.S., A.R. and K.S.L. Formal analysis was the responsibility of M.I., Y.Y., V.M.S., K.P.M., N.T., Z.C., M.A.R.-S., J.D., Q.L. and K.S.L. M.I., D.J.W., I.D.S., I.J.M., L.T.T., G.M.C., M.A.M., J.C.R., H.Z., K.C., R.J.C. and K.S.L. undertook investigation. Methodology was the responsibility of M.I. and K.S.L. Project administration was carried out by M.I., A.J.S., M.J.S., R.J.C. and K.S.L. Resources were the responsibility of M.I., Q.L., M.J.S., R.J.C. and K.S.L. Software was the responsibility of M.I., Y.Y., K.P.M. and K.S.L. M.I., G.M.C., M.A.G., I.G.M., K.C., H.Z., J.C.R., R.J.C., M.J.S. and K.S.L. undertook supervision. Validation was carried out by M.I., Y.Y. and K.S.L. Visualization was undertaken by M.I., Y.Y. and K.S.L. M.I., R.J.C. and K.S.L. wrote the original draft. Reviewing and editing of writing was performed by M.I., Y.Y., A.J.S., V.M.S., K.P.M., Y.X., N.T., Z.C., P.M., M.A.R.-S., I.D.S., J.D., K.C., M.A.M., J.C.R., I.G.M., D.J.W., Q.L., H.Z., R.K., G.M.C., M.J.S., R.J.C. and K.S.L.
Peer review
Peer review information
Nature thanks James DeGregori, Richard Halberg and the other, anonymous, reviewer(s) for their contribution to the peer review of this work.
Data availability
Human data have been deposited to the HTAN Data Coordinating Center Data Portal at the National Cancer Institute: https://data.humantumoratlas.org/ (under the HTAN Vanderbilt Atlas, HTAN dbGaP (no. phs002371)). Mouse data have been deposited at GEO: GSE235119. Source Data are provided with this paper.
Code availability
The computational methods, procedures and analyses summarized above are implemented in custom R and Python, and bash scripts are available via the Lau Lab: https://github.com/Ken-Lau-Lab/NSC-seq.
Competing interests
M.J.S. received funding from Janssen. J.C.R. is on the scientific advisory board of Sitryx Therapeutics. K.S.L. is an hourly consultant for Etiome, Inc. G.M.C. is a founder of Colossal Biosciences Inc., Dallas, TX. L.T.T. is currently an employee of Genentech. The other authors declare no competing interests.
Footnotes
Publisher’s note Springer Nature remains neutral with regard to jurisdictional claims in published maps and institutional affiliations.
Contributor Information
Robert J. Coffey, Email: robert.coffey@vumc.org
Ken S. Lau, Email: ken.s.lau@vanderbilt.edu
Extended data
is available for this paper at 10.1038/s41586-024-07954-4.
Supplementary information
The online version contains supplementary material available at 10.1038/s41586-024-07954-4.
References
- 1.Tanay, A. & Regev, A. Scaling single-cell genomics from phenomenology to mechanism. Nature541, 331–338 (2017). [DOI] [PMC free article] [PubMed] [Google Scholar]
- 2.Burrill, D. R. & Silver, P. A. Making cellular memories. Cell140, 13–18 (2010). [DOI] [PMC free article] [PubMed] [Google Scholar]
- 3.Church, G. M., Gao, Y. & Kosuri, S. Next-generation digital information storage in DNA. Science337, 1628 (2012). [DOI] [PubMed] [Google Scholar]
- 4.Sheth, R. U. & Wang, H. H. DNA-based memory devices for recording cellular events. Nat. Rev. Genet.19, 718–732 (2018). [DOI] [PMC free article] [PubMed] [Google Scholar]
- 5.Park, J. et al. Recording of elapsed time and temporal information about biological events using Cas9. Cell184, 1047–1063 (2021). [DOI] [PubMed] [Google Scholar]
- 6.Kaufman, M. H. Atlas of Mouse Development (Academic, 1992).
- 7.Sulston, J. E. & Horvitz, H. R. Post-embryonic cell lineages of the nematode, Caenorhabditis elegans. Dev. Biol.56, 110–156 (1977). [DOI] [PubMed] [Google Scholar]
- 8.Kaiser, S. et al. Transcriptional recapitulation and subversion of embryonic colon development by mouse colon tumor models and human colon cancer. Genome Biol.8, R131 (2007). [DOI] [PMC free article] [PubMed] [Google Scholar]
- 9.Bellacosa, A. Developmental disease and cancer: biological and clinical overlaps. Am. J. Med. Genet. A161a, 2788–2796 (2013). [DOI] [PMC free article] [PubMed] [Google Scholar]
- 10.Visvader, J. E. Cells of origin in cancer. Nature469, 314–322 (2011). [DOI] [PubMed] [Google Scholar]
- 11.Sprouffske, K., Pepper, J. W. & Maley, C. C. Accurate reconstruction of the temporal order of mutations in neoplastic progression. Cancer Prev. Res. (Phila.)4, 1135–1144 (2011). [DOI] [PMC free article] [PubMed] [Google Scholar]
- 12.Gerstung, M. et al. The evolutionary history of 2,658 cancers. Nature578, 122–128 (2020). [DOI] [PMC free article] [PubMed] [Google Scholar]
- 13.Heiser, C. N. et al. Molecular cartography uncovers evolutionary and microenvironmental dynamics in sporadic colorectal tumors. Cell186, 5620–5637 (2023). [DOI] [PMC free article] [PubMed] [Google Scholar]
- 14.Chan, M. M. et al. Molecular recording of mammalian embryogenesis. Nature570, 77–82 (2019). [DOI] [PMC free article] [PubMed] [Google Scholar]
- 15.Bowling, S. et al. An engineered CRISPR-Cas9 mouse line for simultaneous readout of lineage histories and gene expression profiles in single cells. Cell181, 1410–1422 (2020). [DOI] [PMC free article] [PubMed] [Google Scholar]
- 16.Wagner, D. E. & Klein, A. M. Lineage tracing meets single-cell omics: opportunities and challenges. Nat. Rev. Genet.21, 410–427 (2020). [DOI] [PMC free article] [PubMed] [Google Scholar]
- 17.Shin, H. Y. et al. CRISPR/Cas9 targeting events cause complex deletions and insertions at 17 sites in the mouse genome. Nat. Commun.8, 15464 (2017). [DOI] [PMC free article] [PubMed] [Google Scholar]
- 18.Quinn, J. J. et al. Single-cell lineages reveal the rates, routes, and drivers of metastasis in cancer xenografts. Science371, eabc1944 (2021). [DOI] [PMC free article] [PubMed] [Google Scholar]
- 19.Yang, D. et al. Lineage tracing reveals the phylodynamics, plasticity, and paths of tumor evolution. Cell185, 1905–1923 (2022). [DOI] [PMC free article] [PubMed] [Google Scholar]
- 20.Perli, S. D., Cui, C. H. & Lu, T. K. Continuous genetic recording with self-targeting CRISPR-Cas in human cells. Science353, aag0511 (2016). [DOI] [PubMed] [Google Scholar]
- 21.Kalhor, R. et al. Developmental barcoding of whole mouse via homing CRISPR. Science361, eaat9804 (2018). [DOI] [PMC free article] [PubMed] [Google Scholar]
- 22.Replogle, J. M. et al. Combinatorial single-cell CRISPR screens by direct guide RNA capture and targeted sequencing. Nat. Biotechnol.38, 954–961 (2020). [DOI] [PMC free article] [PubMed] [Google Scholar]
- 23.Dixit, A. et al. Perturb-seq: dissecting molecular circuits with scalable single-cell RNA profiling of pooled genetic screens. Cell167, 1853–1866 (2016). [DOI] [PMC free article] [PubMed] [Google Scholar]
- 24.Banerjee, A. et al. Succinate produced by intestinal microbes promotes specification of tuft cells to suppress ileal inflammation. Gastroenterology159, 2101–2115 (2020). [DOI] [PMC free article] [PubMed] [Google Scholar]
- 25.Pijuan-Sala, B. et al. A single-cell molecular map of mouse gastrulation and early organogenesis. Nature566, 490–495 (2019). [DOI] [PMC free article] [PubMed] [Google Scholar]
- 26.Saitou, M. & Yamaji, M. Primordial germ cells in mice. Cold Spring Harb. Perspect. Biol.4, a008375 (2012). [DOI] [PMC free article] [PubMed] [Google Scholar]
- 27.Kobayashi, T. & Surani, M. A. On the origin of the human germline. Development145, e202201706 (2018). [DOI] [PubMed] [Google Scholar]
- 28.Tzouanacou, E. et al. Redefining the progression of lineage segregations during mammalian embryogenesis by clonal analysis. Dev. Cell17, 365–376 (2009). [DOI] [PubMed] [Google Scholar]
- 29.Nowotschin, S. et al. The emergent landscape of the mouse gut endoderm at single-cell resolution. Nature569, 361–367 (2019). [DOI] [PMC free article] [PubMed] [Google Scholar]
- 30.Kwon, G. S., Viotti, M. & Hadjantonakis, A. K. The endoderm of the mouse embryo arises by dynamic widespread intercalation of embryonic and extraembryonic lineages. Dev. Cell15, 509–520 (2008). [DOI] [PMC free article] [PubMed] [Google Scholar]
- 31.Zernicka-Goetz, M., Morris, S. A. & Bruce, A. W. Making a firm decision: multifaceted regulation of cell fate in the early mouse embryo. Nat. Rev. Genet.10, 467–477 (2009). [DOI] [PubMed] [Google Scholar]
- 32.Ju, Y. S. et al. Somatic mutations reveal asymmetric cellular dynamics in the early human embryo. Nature543, 714–718 (2017). [DOI] [PMC free article] [PubMed] [Google Scholar]
- 33.Bryant, P. J. & Simpson, P. Intrinsic and extrinsic control of growth in developing organs. Q. Rev. Biol.59, 387–415 (1984). [DOI] [PubMed] [Google Scholar]
- 34.Stanger, B. Z. Organ size determination and the limits of regulation. Cell Cycle7, 318–324 (2008). [DOI] [PubMed] [Google Scholar]
- 35.van Neerven, S. M. & Vermeulen, L. Cell competition in development, homeostasis and cancer. Nat. Rev. Mol. Cell Biol.24, 221–236 (2023). [DOI] [PubMed] [Google Scholar]
- 36.Yzaguirre, A. D. & Speck, N. A. Insights into blood cell formation from hemogenic endothelium in lesser-known anatomic sites. Dev. Dyn.245, 1011–1028 (2016). [DOI] [PMC free article] [PubMed] [Google Scholar]
- 37.Qiu, J. et al. Embryonic hematopoiesis in vertebrate somites gives rise to definitive hematopoietic stem cells. J. Mol. Cell Biol.8, 288–301 (2016). [DOI] [PMC free article] [PubMed] [Google Scholar]
- 38.Nowakowski, R. S. et al. Population dynamics during cell proliferation and neuronogenesis in the developing murine neocortex. Results Probl. Cell Differ.39, 1–25 (2002). [DOI] [PubMed] [Google Scholar]
- 39.Zafar, H., Lin, C. & Bar-Joseph, Z. Single-cell lineage tracing by integrating CRISPR-Cas9 mutations with transcriptomic data. Nat. Commun.11, 3055 (2020). [DOI] [PMC free article] [PubMed] [Google Scholar]
- 40.Tsai, Y. H. et al. LGR4 and LGR5 function redundantly during human endoderm differentiation. Cell. Mol. Gastroenterol. Hepatol.2, 648–662 (2016). [DOI] [PMC free article] [PubMed] [Google Scholar]
- 41.Franklin, V. et al. Regionalisation of the endoderm progenitors and morphogenesis of the gut portals of the mouse embryo. Mech. Dev.125, 587–600 (2008). [DOI] [PubMed] [Google Scholar]
- 42.Barker, N. et al. Crypt stem cells as the cells-of-origin of intestinal cancer. Nature457, 608–611 (2009). [DOI] [PubMed] [Google Scholar]
- 43.Guiu, J. et al. Tracing the origin of adult intestinal stem cells. Nature570, 107–111 (2019). [DOI] [PMC free article] [PubMed] [Google Scholar]
- 44.Egeblad, M., Nakasone, E. S. & Werb, Z. Tumors as organs: complex tissues that interface with the entire organism. Dev. Cell18, 884–901 (2010). [DOI] [PMC free article] [PubMed] [Google Scholar]
- 45.Fearon, E. R., Hamilton, S. R. & Vogelstein, B. Clonal analysis of human colorectal tumors. Science238, 193–197 (1987). [DOI] [PubMed] [Google Scholar]
- 46.Williams, M. J. et al. Identification of neutral tumor evolution across cancer types. Nat. Genet.48, 238–244 (2016). [DOI] [PMC free article] [PubMed] [Google Scholar]
- 47.Thorsen, A. S. et al. Heterogeneity in clone dynamics within and adjacent to intestinal tumours identified by Dre-mediated lineage tracing. Dis. Model. Mech.14, dmm046706 (2021). [DOI] [PMC free article] [PubMed] [Google Scholar]
- 48.Chen, B. et al. Differential pre-malignant programs and microenvironment chart distinct paths to malignancy in human colorectal polyps. Cell184, 6262–6280 (2021). [DOI] [PMC free article] [PubMed] [Google Scholar]
- 49.Schepers, A. G. et al. Lineage tracing reveals Lgr5+ stem cell activity in mouse intestinal adenomas. Science337, 730–735 (2012). [DOI] [PubMed] [Google Scholar]
- 50.Fearon, E. R. & Vogelstein, B. A genetic model for colorectal tumorigenesis. Cell61, 759–767 (1990). [DOI] [PubMed] [Google Scholar]
- 51.Thirlwell, C. et al. Clonality assessment and clonal ordering of individual neoplastic crypts shows polyclonality of colorectal adenomas. Gastroenterology138, 1441–1454 (2010). [DOI] [PubMed] [Google Scholar]
- 52.Thliveris, A. T. et al. Clonal structure of carcinogen-induced intestinal tumors in mice. Cancer Prev. Res. (Phila.)4, 916–923 (2011). [DOI] [PMC free article] [PubMed] [Google Scholar]
- 53.Schenck, R. O. et al. The polyclonal path to malignant transformation in familial adenomatous polyposis. Cancer Res.83, 3497–3497 (2023). [Google Scholar]
- 54.Cross, W. et al. The evolutionary landscape of colorectal tumorigenesis. Nat. Ecol. Evol.2, 1661–1672 (2018). [DOI] [PMC free article] [PubMed] [Google Scholar]
- 55.Greaves, M. & Maley, C. C. Clonal evolution in cancer. Nature481, 306–313 (2012). [DOI] [PMC free article] [PubMed] [Google Scholar]
- 56.Coorens, T. H. H. et al. Inherent mosaicism and extensive mutation of human placentas. Nature592, 80–85 (2021). [DOI] [PMC free article] [PubMed] [Google Scholar]
- 57.Nishimura, T. et al. Evolutionary histories of breast cancer and related clones. Nature620, 607–614 (2023). [DOI] [PMC free article] [PubMed] [Google Scholar]
- 58.Hsu, S. H. et al. Multiclonal origin of polyps in Gardner syndrome. Science221, 951–953 (1983). [DOI] [PubMed] [Google Scholar]
- 59.Becker, W. R. et al. Single-cell analyses define a continuum of cell state and composition changes in the malignant transformation of polyps to colorectal cancer. Nat. Genet.54, 985–995 (2022). [DOI] [PMC free article] [PubMed] [Google Scholar]
- 60.Michor, F., Iwasa, Y. & Nowak, M. A. Dynamics of cancer progression. Nat. Rev. Cancer4, 197–205 (2004). [DOI] [PubMed] [Google Scholar]
- 61.Klein, A. M. et al. Droplet barcoding for single-cell transcriptomics applied to embryonic stem cells. Cell161, 1187–1201 (2015). [DOI] [PMC free article] [PubMed] [Google Scholar]
- 62.Kalhor, R., Mali, P. & Church, G. M. Rapidly evolving homing CRISPR barcodes. Nat. Methods14, 195–200 (2017). [DOI] [PMC free article] [PubMed] [Google Scholar]
- 63.Westphalen, C. B. et al. Long-lived intestinal tuft cells serve as colon cancer-initiating cells. J. Clin. Invest.124, 1283–1295 (2014). [DOI] [PMC free article] [PubMed] [Google Scholar]
- 64.Ludwig, L. S. et al. Lineage tracing in humans enabled by mitochondrial mutations and single-cell genomics. Cell176, 1325–1339 (2019). [DOI] [PMC free article] [PubMed] [Google Scholar]
- 65.Nam, A. S. et al. Somatic mutations and cell identity linked by genotyping of transcriptomes. Nature571, 355–360 (2019). [DOI] [PMC free article] [PubMed] [Google Scholar]
- 66.Vickovic, S. et al. High-definition spatial transcriptomics for in situ tissue profiling. Nat. Methods16, 987–990 (2019). [DOI] [PMC free article] [PubMed] [Google Scholar]
- 67.Wei, R. et al. Spatial charting of single-cell transcriptomes in tissues. Nat. Biotechnol.40, 1190–1199 (2022). [DOI] [PMC free article] [PubMed] [Google Scholar]
- 68.Wolock, S. L., Lopez, R. & Klein, A. M. Scrublet: computational identification of cell doublets in single-cell transcriptomic data. Cell Syst.8, 281–291 (2019). [DOI] [PMC free article] [PubMed] [Google Scholar]
- 69.Behjati, S. et al. Genome sequencing of normal cells reveals developmental lineages and mutational processes. Nature513, 422–425 (2014). [DOI] [PMC free article] [PubMed] [Google Scholar]
- 70.Jombart, T., Balloux, F. & Dray, S. adephylo: New tools for investigating the phylogenetic signal in biological traits. Bioinformatics26, 1907–1909 (2010). [DOI] [PubMed] [Google Scholar]
- 71.Deng, S. et al. A statistical method for quantifying progenitor cells reveals incipient cell fate commitments. Nat. Methods21, 597–608 (2024). [DOI] [PubMed] [Google Scholar]
- 72.Wang, Z. & Jaenisch, R. At most three ES cells contribute to the somatic lineages of chimeric mice and of mice produced by ES-tetraploid complementation. Dev. Biol.275, 192–201 (2004). [DOI] [PubMed] [Google Scholar]
- 73.Lawson, K. A., Meneses, J. J. & Pedersen, R. A. Clonal analysis of epiblast fate during germ layer formation in the mouse embryo. Development113, 891–911 (1991). [DOI] [PubMed] [Google Scholar]
- 74.Patel, S. H. et al. Lifelong multilineage contribution by embryonic-born blood progenitors. Nature606, 747–753 (2022). [DOI] [PubMed] [Google Scholar]
- 75.van Dijk, D. et al. Recovering gene interactions from single-cell data using data diffusion. Cell174, 716–729 (2018). [DOI] [PMC free article] [PubMed] [Google Scholar]
- 76.Setty, M. et al. Characterization of cell fate probabilities in single-cell data with Palantir. Nat. Biotechnol.37, 451–460 (2019). [DOI] [PMC free article] [PubMed] [Google Scholar]
- 77.Gulati, G. S. et al. Single-cell transcriptional diversity is a hallmark of developmental potential. Science367, 405–411 (2020). [DOI] [PMC free article] [PubMed] [Google Scholar]
- 78.Haber, A. L. et al. A single-cell survey of the small intestinal epithelium. Nature551, 333–339 (2017). [DOI] [PMC free article] [PubMed] [Google Scholar]
- 79.Fazilaty, H. et al. Tracing colonic embryonic transcriptional profiles and their reactivation upon intestinal damage. Cell Rep.36, 109484 (2021). [DOI] [PubMed] [Google Scholar]
- 80.Cañellas-Socias, A. et al. Metastatic recurrence in colorectal cancer arises from residual EMP1(+) cells. Nature611, 603–613 (2022). [DOI] [PubMed] [Google Scholar]
- 81.Liu, Y. et al. Comparative molecular analysis of gastrointestinal adenocarcinomas. Cancer Cell33, 721–735 (2018). [DOI] [PMC free article] [PubMed] [Google Scholar]
- 82.Muyas, F. et al. De novo detection of somatic mutations in high-throughput single-cell profiling data sets. Nat. Biotechnol. 42, 758–767 (2024). [DOI] [PMC free article] [PubMed]
- 83.Dou, J. et al. Single-nucleotide variant calling in single-cell sequencing data with Monopogen. Nat. Biotechnol. 42, 803–812 (2023). [DOI] [PMC free article] [PubMed]
- 84.Tukiainen, T. et al. Landscape of X chromosome inactivation across human tissues. Nature550, 244–248 (2017). [DOI] [PMC free article] [PubMed] [Google Scholar]
- 85.Wu, T. et al. clusterProfiler 4.0: a universal enrichment tool for interpreting omics data. Innovation (Camb.)2, 100141 (2021). [DOI] [PMC free article] [PubMed] [Google Scholar]
Associated Data
This section collects any data citations, data availability statements, or supplementary materials included in this article.
Supplementary Materials
This merged file has multiple items listed in its Table of Contents. This includes Methods, embryonic cell type annotation, summary of software tools, Supplementary references and the captions of Supplementary tables.
Supplementary Table 1 shows primer sequences used in this study.
Supplementary Table 2 shows mutation density for each embryonic cell type.
Supplementary Table 3 shows the list of genes used for calculation of gene signature.
Supplementary Table 4 shows precancer analysis for human and mouse samples.
Source Data Extended Data Figs. 1–12 and 14
Data Availability Statement
Human data have been deposited to the HTAN Data Coordinating Center Data Portal at the National Cancer Institute: https://data.humantumoratlas.org/ (under the HTAN Vanderbilt Atlas, HTAN dbGaP (no. phs002371)). Mouse data have been deposited at GEO: GSE235119. Source Data are provided with this paper.
The computational methods, procedures and analyses summarized above are implemented in custom R and Python, and bash scripts are available via the Lau Lab: https://github.com/Ken-Lau-Lab/NSC-seq.


