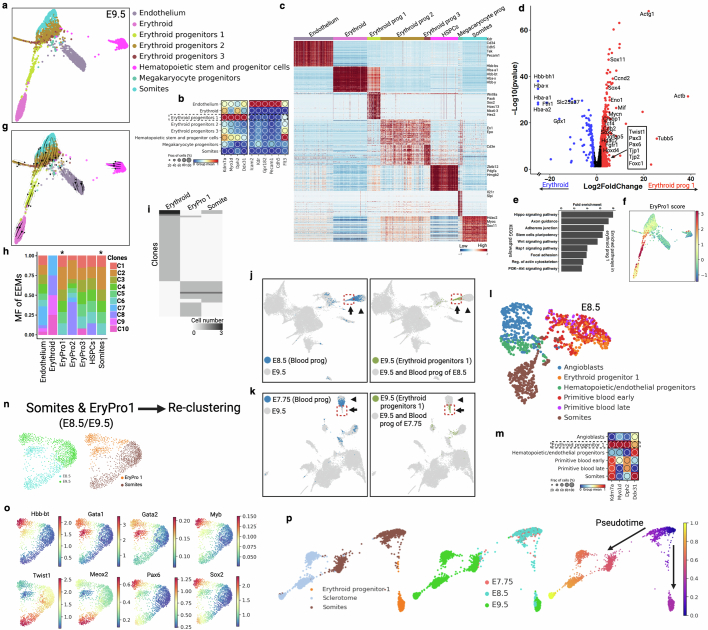
Extended Data Fig. 8. Somite-derived hematopoiesis.
(a) Force-directed layout of hematopoietic cell types and somite from E9.5 embryos. See Extended Data Fig. 4c for annotation. (b) Dot plots show overexpressed genes in EryPro1 along with yolk sac (Icam2, Kdr, and Gpr182), or endothelial (Pecam1, and Cdh5) genes. EryPro1 doesn’t express a recently reported embryonic multipotent progenitor (eMMP) marker Flt374. (c) Heat map shows differentially expressed genes among the cell types. Cell type-specific selective list of genes are marked on the right. HSPCs, hematopoietic stem and progenitor cells. (d) A volcano plot represents differentially expressed genes (DEGs) between Erythroid and EryPro1(LCF > 2, p value < 0.05). P values derived from Wilcoxon rank-sum test, not corrected for multiple testing. Red dots are upregulated in EryPro1, blue dots are upregulated in Erythroid, and black dots are statistically not significant. (e) Enriched pathways in EryPro1 group. (f) Cells are marked by EryPro1 score. The list of genes for the signature score is shown in Supplemental table 3. (g) RNA velocity overlay shows direction from somites to EryPro1, supporting cell state transition. (h) MF of EEMs shows similar contribution (asterisk) to both somite and EryPro1, supporting similar early embryonic origin (Extended Data Fig. 5l). (i) Heat map represents shared clones (barcode mutations) across three cell types. (j) UMAP co-embedding of blood progenitor cells (blue) from E8.5 (Extended Data Fig. 4a) with E9.5 cells (gray). Arrow shows EryPro1 cluster and arrowhead shows Erythroid cluster. EryPro1 cells from E9.5 are marked by red dotted line (right). EryPro1 population is present in E8.5 embryo. (k) Similar as panel j with blood progenitor cells from E7.75. There is insignificant overlapping population in EryPro1 cluster (arrow), implicating that EryPro1 is not present yet at E7.75 stage. (l) Force-directed layout of blood progenitor cell types with somites at E8.5. EryPro1 assigned from overlapping cluster (arrow) in j. (m) A list of gene upregulates in EryPro1 is shown as dot plot. (n) Force-directed layout of EryPro1 and somites and two time points using Harmony29 and cells are colored by time points and cell types. (o) Expression of somites- and erythroid-specific genes are shown here. Somite to EryPro1 transitioning cells show transient expression of both hematopoietic (Gata1) and somite (Twist1) markers. Post-imputed (MAGIC) gene expression values are shown here75. (p) Force-directed layout of three cell types and three time points. Cells are colored by Palantir76 pseudo-time trajectory (right). See Fig. 3a,b.

