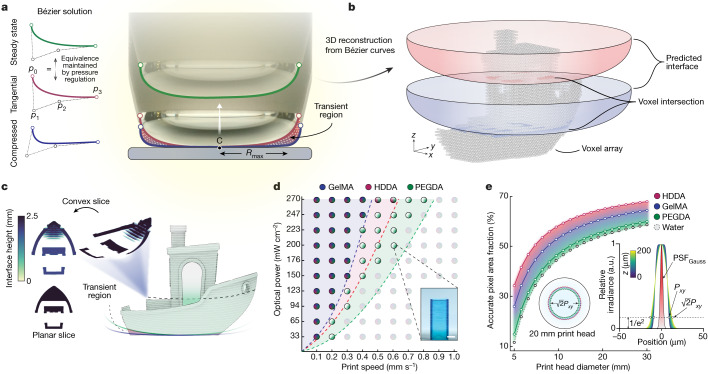
Fig. 2. Characterization of the DIP system.
a, Images of the air–liquid interface profile formed at the base of the print head under the compressed, tangential and steady-state modes. Bézier curves were used to predict the shape of the interface during printing for each of the interface modes. b, The convex-slicing scheme was determined by first revolving the Bézier half-profile about the central axis and computing the voxel-wise intersection. c, Convex optimized projections extend in three dimensions and follow the boundary curvature for each interface mode. d, Print parameter space (n = 3) showing the optical power and print speed pairs for GelMA (blue), HDDA (red) and PEGDA (green). Inset, example of the rectangular test structure used to assess the parameter space. Scale bar, 2 mm. e, Accurate pixel area fraction for increasing print-head size for HDDA (red), GelMA (blue), PEGDA (green) and water (grey dashed). Left inset, variability of the area fraction for the 20 mm print head, dependent on material formulation. Right inset, simulated deviation of the pixel size based on Gaussian beam theory for a range of z values, compared to the Gaussian point spread function of the optical system, PSFGauss. a.u., arbitrary units.

