Abstract
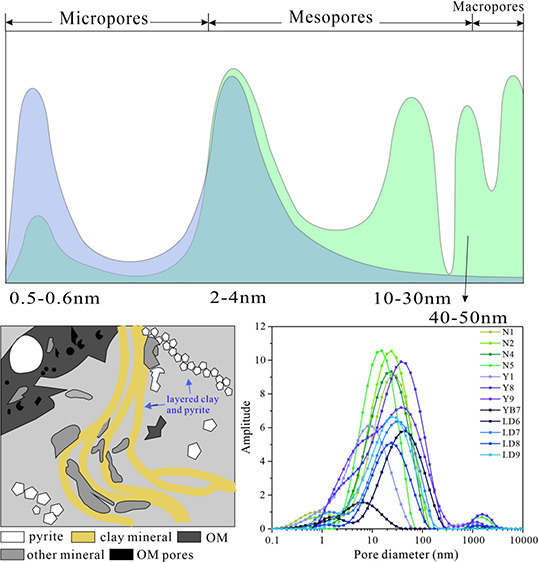
Pore structure can affect the reservoir property, petrophysics, and fluid migration/adsorption, which is critical for shale evaluation and development. In this paper, the pore structure, fractal characteristics, and their influencing factors on low-resistivity shale (LRS) from the Longmaxi Formation in the Southern Sichuan Basin were analyzed by combining geochemistry experiments, physical property analysis, X-ray diffraction, scanning electron microscopy (SEM), N2/CO2 gas adsorption experiments, and nuclear magnetic resonance (NMR). The results indicate that in LRS, the layered clay mineral/pyrite distribution and more developed pores with a larger size and better connectivity can build a complex and superior conductive network. In gas adsorption tests, the pore volume (PV) is primarily contributed by mesopores in sizes of 2–4, 10–30, and 40–50 nm; the specific surface area (SSA) is mainly controlled by mesopores of 2–4 nm and micropores of 0.5–0.7 nm. The pore structures characterized by NMR, gas adsorption experiments, and SEM are consistent. In addition, gas adsorption is more suitable than NMR for describing the fractal dimension, where the development of micropores enhances the heterogeneity and complexity of the pore surface and pore structure. The gas-producing LRS has larger D1 and D2 than water-producing LRS. Moreover, TOC contributes to the development of micropores to some degree. Quartz and illite are negatively correlated with the PV and SSA of mesopores and total pores, while pyrite, clay mineral, and illite/smectite (I/S) are converse with a positive relationship. There exists only one negative relationship between chlorite and D2, and chlorite is weakly positively correlated with the large pore volume and negatively correlated with the micropore SSA.
1. Introduction
The successful exploitation of shale gas resources in the United States has garnered global attention as a means to address the rising energy demands. China, in particular, has estimated shale gas reserves of approximately 26 × 10 12 m3, almost similar to those of the United States.1,2 Recent advancements in exploration and development, particularly in (ultra) deep formations, have revealed a peculiar low resistivity trend in the logging curves of several shale gas intervals in the Wufeng-Longmaxi Formation of the Southern Sichuan Basin. This abnormal phenomenon where high-quality shale gas reservoirs with a high organic matter content and ample gas abundance do not possess high resistivity will seriously affect the evaluation of water saturation and gas content. Investigating these low-resistivity shale formations, which demonstrate excellent gas production potential, has become a pressing research focus. Furthermore, shale gas primarily consists of adsorbed gas on clay or organic matter surfaces and free gas within pore spaces.3,4 Therefore, the pore structure, described via parameters such as pore types, pore size, pore volume, and surface area, is of great significance to be investigated in shale reservoirs, which dominate the gas storage and flow capacity.5
The pore diameter plays a crucial role in classifying shale pores. The classification system proposed by the International Union of Pure and Applied Chemistry (IUPAC) is commonly accepted, which divides shale pores into three types: micropores (<2 nm), mesopores (2–50 nm), and macropores (>50 nm).6 To investigate the pore structure features, various advanced techniques are employed, including scanning electron microscopy (SEM), transmission electron microscopy (TEM), focused ion beam or field emission-SEM (FIB or FE-SEM), nuclear magnetic resonance (NMR), and small-angle or ultrasmall-angle neutron scattering (SANS or USANS). Some common techniques via fluid intrusion are mercury injection capillary pressure (MICP) and low-temperature N2/CO2 adsorption isotherms (LTNA/LTCA).7−9 In general, multiple techniques are combined to characterize the shale pore systems due to their limitations.5,10 In the previous studies, Wang et al.11 found that the combination of LTNA and LTCA is the most suitable technique to describe the characteristics of shale pores. Additionally, Xue et al.12 and Zhang et al.13 explored the relationship between rock resistivity and pore structure characteristics in the Longmaxi Formation, Southern Sichuan Basin, observing that gas-producing LRS has a lower pore volume and specific surface area. They also proposed that the OM pores decrease significantly with the increased size of the micropores due to graphitization. Adão et al.14 believed that the pore structure, rather than maturity, is the primary factor affecting the low resistivity of this abnormal shale.
The pore structure of shale rocks displays a high degree of complexity at multiple scales, ranging from nano- to macropores, which significantly impact their petrophysical properties and hydrocarbon production potential.15 Fractal analysis, gained from SEM images, gas adsorption experiments, MICP, and NMR data, can quantitatively depict the complex and heterogeneous nature of pore structure.16−19 Generally, the fractal dimension (D) ranges between 2 and 3, with a higher value indicating greater irregularity and heterogeneity. Previous studies mainly focused on the pore system of normal organic-rich shale with high resistivity. However, there is a paucity of literature deeply related to the pore structure and fractal characteristics of LRS in Southern Sichuan. Hence, it is necessary to complement this part to support further exploration and evaluation of these abnormal shale gas reservoirs.
In this study, we collected shale samples of water-producing LRS and abnormal gas-producing LRS from the Longmaxi Formation of the Southern Sichuan Basin. The characteristics of the fractal dimension and pore structure, including pore types, pore size distribution, and pore structure parameters, were comprehensively studied via SEM, LTNA, LTCA, and NMR experiments. Additionally, based on geochemistry and mineralogical composition, the factors affecting the fractal dimension and pore structure were discussed.
2. Materials and Methods
2.1. Geological Setting and Samples
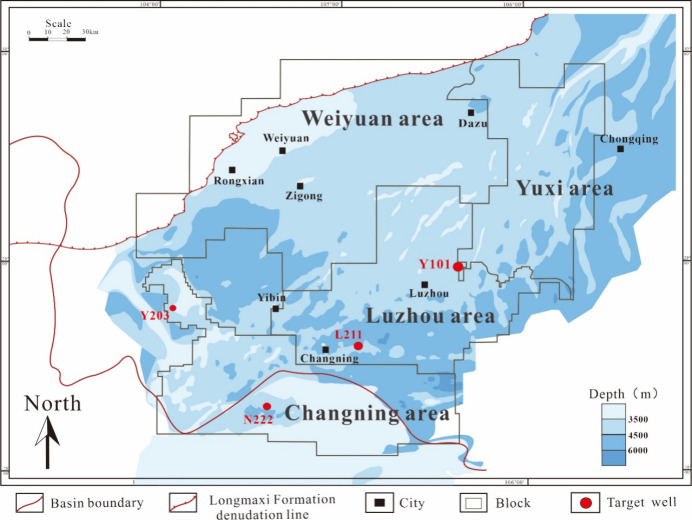
The Southern Sichuan region lies on the Southwest margin of the Upper Yangtze Platform, which is surrounded by the Daliang mountain, Huaying fault, north Qianbei depression, and Longnvsi paleouplift. The study area has undergone a series of faulting events, tectonic uplift, and structural transformation, resulting in a low and steep structural belt.20 This belt is stable with a large area and commonly develops deep to ultradeep shales. In addition, the Southern Sichuan Basin mainly develops deep-water shelf sediment and deposits black carbonaceous shales with abundant graptolite fossils and pyrite.21,22 In this study, 13 core samples exhibiting low resistivity were collected from the Longmaxi Formation. These include five samples (N1, N2, N3, N4, and N5) from well N222, three samples (Y1, Y8, and Y9) from well Y101, four samples (LD6, LD7, LD8, and LD9) from well L211, and one sample (YB7) from well Y203. Based on their electrical logging response and the corresponding gas production property, these wells are categorized into normal water-producing wells with low resistivity (N222) and abnormal gas-producing wells with low resistivity (Y203, Y101, and L211). Among them, the abnormal gas-producing wells comprehensively cover three situations of low (Y203), medium (Y101), and high (L211) gas production (Figure 1).
Figure 1.
Regional geological overview and target well location distribution in the Southern Sichuan Basin.
2.2. Experimental Methods
The LECO-230 carbon–sulfur analyzer was implemented to quantify the TOC content and Ro. To prepare the experiment, all samples were ground into a powder in a size of less than 100 mesh. Then, about 2 g of powder was treated with 10% hydrochloric acid and dried under 80 °C before analyzing.
X-ray diffraction was performed to quantify the mineralogy of specimens in accordance with the Chinese Oil and Gas Industry Standard (SY/T) 5163-2018. The testing environment was controlled under a temperature of 25 °C and a humidity of 30%. Specifically, rock chips were first crushed in an agate mortar and pulverized into a size of not more than 200 mesh. The powder was then packed into a measuring cell and analyzed by an X'Pert powder diffractometer with a Cu Kα radioactive source at a scanning angle of 25°. Finally, the semiquantitative abundance of mineral phases was determined by relevant diffractograms. The maximal intensity peaks were analyzed to identify the mineral composition.
The SEM method was employed to visually identify pore types and morphology. In this paper, a Helios 650 scanning electron microscope, with a resolution of 1 nm, was conducted for imaging. The samples were cut into 1 cm3 pieces and polished to obtain a pristine 2D surface free of impurities. Then, we coated the sample surfaces with gold and employed a conductive adhesive to fix the samples on the loading stage for examining. From the obtained electron microscopy images, the morphological characteristics were carefully observed.
Gas adsorption experiments were conducted using a Micromeritics ASAP2460 automatic specific surface area and pore size analyzer. To prepare the test samples, sufficient rock chips were crushed into a 60–80 mesh for screening and dried in a dry oven for 24 h to remove excess water from the pores. The sample powder was then degassed in a vacuum chamber at 110 °C to ensure optimal results without damaging the physicochemical structure. The powder was randomly divided for N2 and CO2 adsorption. Specifically, the N2 adsorption was performed at −196 °C (77.3K), and the Barrett–Joyner–Halenda (BJH) and Brunauer–Emmett–Teller (BET) methods were applied to calculate the pore volume and specific surface area, respectively. The CO2 adsorption followed similar procedures and principles, except for the experimental temperature of 0 °C (273.15 K) and a relative pressure range of 0.0001–0.032. The density functional theory (DFT) was more suitable to obtain the pore volume of micropores.
In this study, a MesoMR23-060H-1 NMR analyzer was also utilized to determine the pore structure system of target cores. First, the shale samples were dried in an oven at 105 °C until no further mass loss was observed, measuring the base signal. Then, the samples were vacuumed for 24 h and saturated with distilled water under a pressure of 30 MPa. The hydrogen signal of shale in the saturated state was measured, and its T2 spectrum was obtained after subtracting the base signal through inversion.
3. Fractal Theory
The significant variation in shale pore sizes, ranging from nanoscale pores to microfractures, has led to the widespread use of the multifractal theory for characterizing their pore structure. The fractal dimension (D) serves as an effective metric for quantifying the complexity and heterogeneity of pore systems.23,24 Generally, the fractal dimension is in the range of 2–3, and approaching 2 reflects the regularity of the pore structure and complete smoothness of the pore surface.11 In this paper, N2 adsorption and the NMR method were utilized to calculate the fractal dimension.
3.1. Fractal Dimensions from LTNA
There are many mathematical models to determine the fractal dimension of porous materials based on gas adsorption isotherms, such as the BET model, Langmuir model, Frenkel–Halsey–Hill (FHH) model, and thermodynamic method.25−29 Among them, the FHH model is proven to be the most effective and prevailing method, whose theoretical basis is the multimolecular-layer adsorption theory.31−34 The FHH formula is as follows:
| 1 |
where P0 is the saturation pressure, MPa; P represents the equilibrium pressure, MPa; V refers to the adsorbed N2 volume at the equilibrium pressure, cm3/g; C is the constant. When shale exhibits fractal characteristics, ln V and ln(ln(P0/P)) are linearly correlated and the fractal dimension can be derived from the slope via regression analysis. There are two different formulas to calculate the fractal dimension:
| 2 |
or
| 3 |
where eq 2 is applicable to the capillary condensation state formed at the beginning of the hysteresis loop and eq 3 takes effect under van der Waals force.30 It has been found that the fractal dimension calculated with D =3K + 3 is usually below 2, which contradicts the definition of D. Therefore, eq 2 is universally adopted to determine the fractal dimension based on N2 adsorption isotherms.
3.2. Fractal Dimensions from NMR
The T2 spectrum required from NMR experiments exhibits the pore structure characteristics and can be utilized to establish pseudocapillary pressure curves.31 Combining NMR fractal geometry theory and T2 spectrum curves, the formula containing the fractal dimension is expressed as
| 4 |
taking the logarithm of both sides, eq 4 is revised as
| 5 |
where T2 is the transverse relaxation time, ms; T2max is the maximum of transverse relaxation time, ms; V refers to the cumulative volume fraction to the total pore volume when the transverse relaxation time is less than T2, %; D is the NMR fractal dimension. When shale pores possess fractal properties and a self-similar structure, lg(V) and lg(T2) are correlated in a linear relationship and the fractal dimension can be obtained from the slope.
4. Results
4.1. Geochemistry and Mineralogical Composition
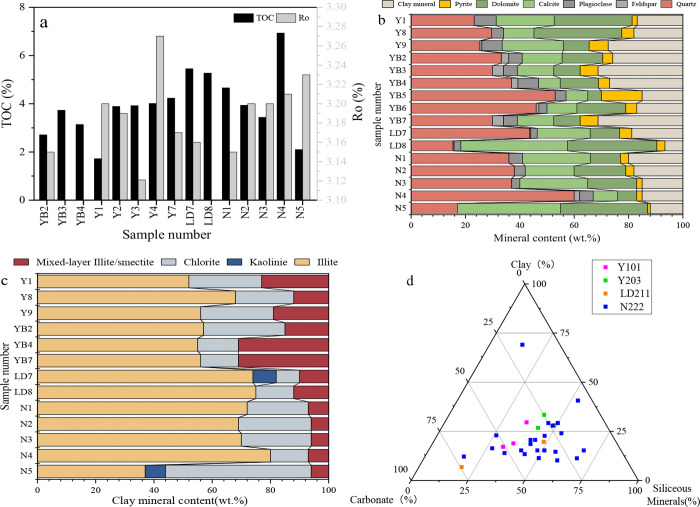
The geochemical parameters and mineral composition are displayed in Figure 2. The TOC contents of low-resistivity shales vary from 1.72 to 6.93 wt %, with an average of 4.1 wt %. The equivalent vitrinite reflectance (Ro) has a distribution of 3.12–3.27% with a mean of 3.2%, indicating that the target cores are overmature (Figure 2a). The mineral composition of the target shales, determined by XRD, is shown in Figure 2b. From the test results, quartz (averaging 35.3%) and carbonate mineral (averaging 34.56%) are the primary minerals followed by clay minerals ranging between 6.6 and 31.2% (average of 20.7%). Small amounts of pyrite (average of 4.2%) and feldspar (average of 5.2%) are also present. Additionally, the pyrite content in gas-producing LRS is twice as much as water-producing LRS.
Figure 2.
(a) TOC vs Ro. (b) Mineral composition, (c) clay minerals, and (d) lithofacies classification of LRS samples in the Longmaxi Formation of the Southern Sichuan Basin
The clay minerals in low-resistivity shales consist of chlorite, illite, and an illite/smectite mixed layer (Figure 2c). Specifically, illite is the most abundant clay mineral and is in the range 37–80% with a mean of 63% then followed by chlorite, which varies from 8 to 50% and averages 21%. The average of the illite/smectite mixed layer is 14%, ranging from 6 to 31%. Kaolinite only exists in several core plugs with an extremely low content. Incidentally, all shale samples contain no smectite, so it is inferred that strong sedimentation and high diagenetic evolution happen on Southern Sichuan shale to enable smectite to gradually transform into chlorite, illite, and an illite/smectite mixed layer.32
By plotting the mineral compositions on a ternary phase diagram, the lithofacies of LRS in the Longmaxi Formation of the Southern Sichuan basin mainly develop siliceous/calcareous mixed shale lithofacies (S/CM), carbonate-rich siliceous shale lithofacies (CS), and silica-rich calcareous shale lithofacies (SC) (Figure 2d).
4.2. Pore Types and Morphology
By conducting SEM and argon-ion polishing techniques, images of low-resistivity shale samples under different horizons were observed to determine the geometric distribution, shape, and size of pores. Based on SEM images and investigation of Loucks et al.,33 the classification of shale pores in the Longmaxi Formation of the Southern Sichuan Basin qualitatively consists of organic matter (OM) pores, intergranular (inter) pores, and intragranular (Intra) pores, while the microfractures are rare.
4.2.1. OM Pores
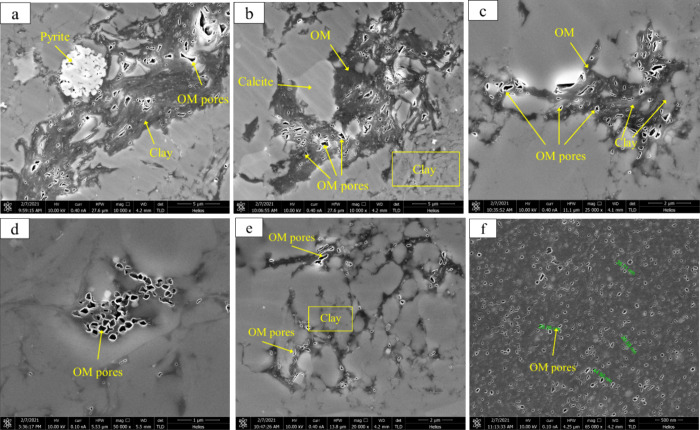
OM pores refer to pores developed in organic matter, which mainly form during the pyrolysis and hydrocarbon generation of kerogen. The pore diameters range from tens to hundreds of nanometers, with some even reaching micrometers. As shown in Figure 3, the organic matter in LRS is generally encapsulated or filled with clay minerals and pyrite to constitute complexes, distributed in strips and irregular blocks with distinct outlines. The OM pores exhibit complicated morphologies and occur within complexes or on the junction, shaped as narrow slits or ellipses. Almost all organic matter areas have been developed with such OM pores. To conclude, the OM pores in low-resistivity shales are characterized by uneven size distribution, obviously large pore size, excellent pore connectivity, and connection with some intergranular pores, tending to generate a sophisticated pore network in space.
Figure 3.
Scanning electron microscopy of OM in low-resistivity shale of the Longmaxi Formation in Southern Sichuan. (a) Complexes composed of OM, clay minerals, and pyrite; (b,c) OM distributed in strips and irregular blocks; (d–f) OM pores within complexes or on edges in the shape of narrow slits or ellipses.
4.2.2. Intergranular Pores
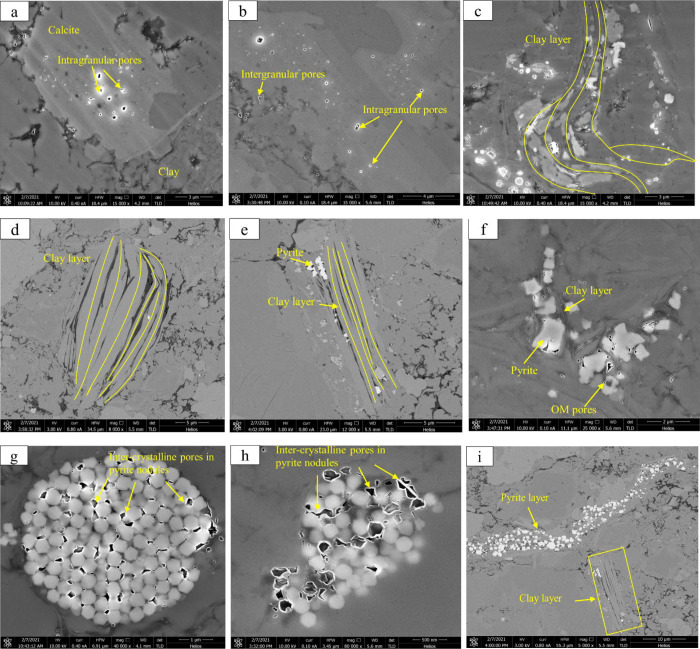
Intergranular pores occur between or at the boundaries of mineral particles, involving brittle mineral intergranular pores and clay mineral interlayer pores. Among them, the brittle mineral intergranular pores were present in an irregular polygonal form with relatively good connectivity, which is significant for shale gas seepage. The clay mineral interlayer pores are widely distributed in the shape of long strip, flat, or slit with a large specific surface area and good connectivity, providing storage space and seepage channels. It should be noted that in low-resistivity shale, the mineral grains exhibit distinct outlines and clay minerals are extensively distributed in layers with well-developed interlayer pores, occasionally contacting with pyrite (Figure 4b–e).
Figure 4.
Electron microscopic images of intergranular and intragranular pores of low-resistivity shale in the Longmaxi Formation of Southern Sichuan: (a) intragranular pores in calcite, (b) intergranular and intragranular pores, (c–e) clay layer, (f–h) intercrystalline pores in pyrite nodules, and (i) pyrite layer.
4.2.3. Intragranular Pores
Intragranular pores are found within particles and can be categorized into rigid particle dissolution pores and intercrystalline pores in framboidal pyrite nodules. Dissolution pores are generated by organic acids released during thermal evolution and acid fluids invaded during sedimentary diagenesis, which would dissolve unstable minerals such as quartz, feldspar, and calcite.34,35 Generally, these pores are circular or elliptical in shape with poor connectivity but tend to be distributed directionally in low-resistivity shale (Figure 4a,b). With respect to intercrystalline pores in pyrite nodules, they are mostly formed as a strawberry monomer or aggregate and appear in circles, grids, clusters, or irregular polygons. The intercrystalline pores of pyrite in low-resistivity shale are developed with a large size (Figure 4f–h). Meanwhile, it is apparent that the pyrites are inclined to be connected in layers and establish superb connecting networks, whether they are formed separately or in contact with the clay water network, effectively improving the conductivity of shale (Figure 4i).
4.3. The Characteristics of Gas Adsorption Isotherms
4.3.1. Low-Temperature N2 Adsorption Isotherms (LTNA)
The N2 adsorption/desorption isotherms of Longmaxi shales in the Southern Sichuan Basin are displayed in a reversed “S” shape on the whole. When the relative pressure p/p0 < 0.01, the isotherms are concave upward and partially resemble the type I curve, which corresponds to the single-layer adsorption process of nitrogen molecules on the pore surface and indicates the N2 filling micropores. Afterward, as the relative pressure increases, the adsorption curves of all samples tend to rise, reflecting the multilayer adsorption process. Ultimately, in the relatively high-pressure stage, the curves dramatically increase again but display no plateau when the relative pressure approaches 1.0, indicating an unsaturated adsorption capacity and infinite adsorption layer numbers (Figure 5).
Figure 5.
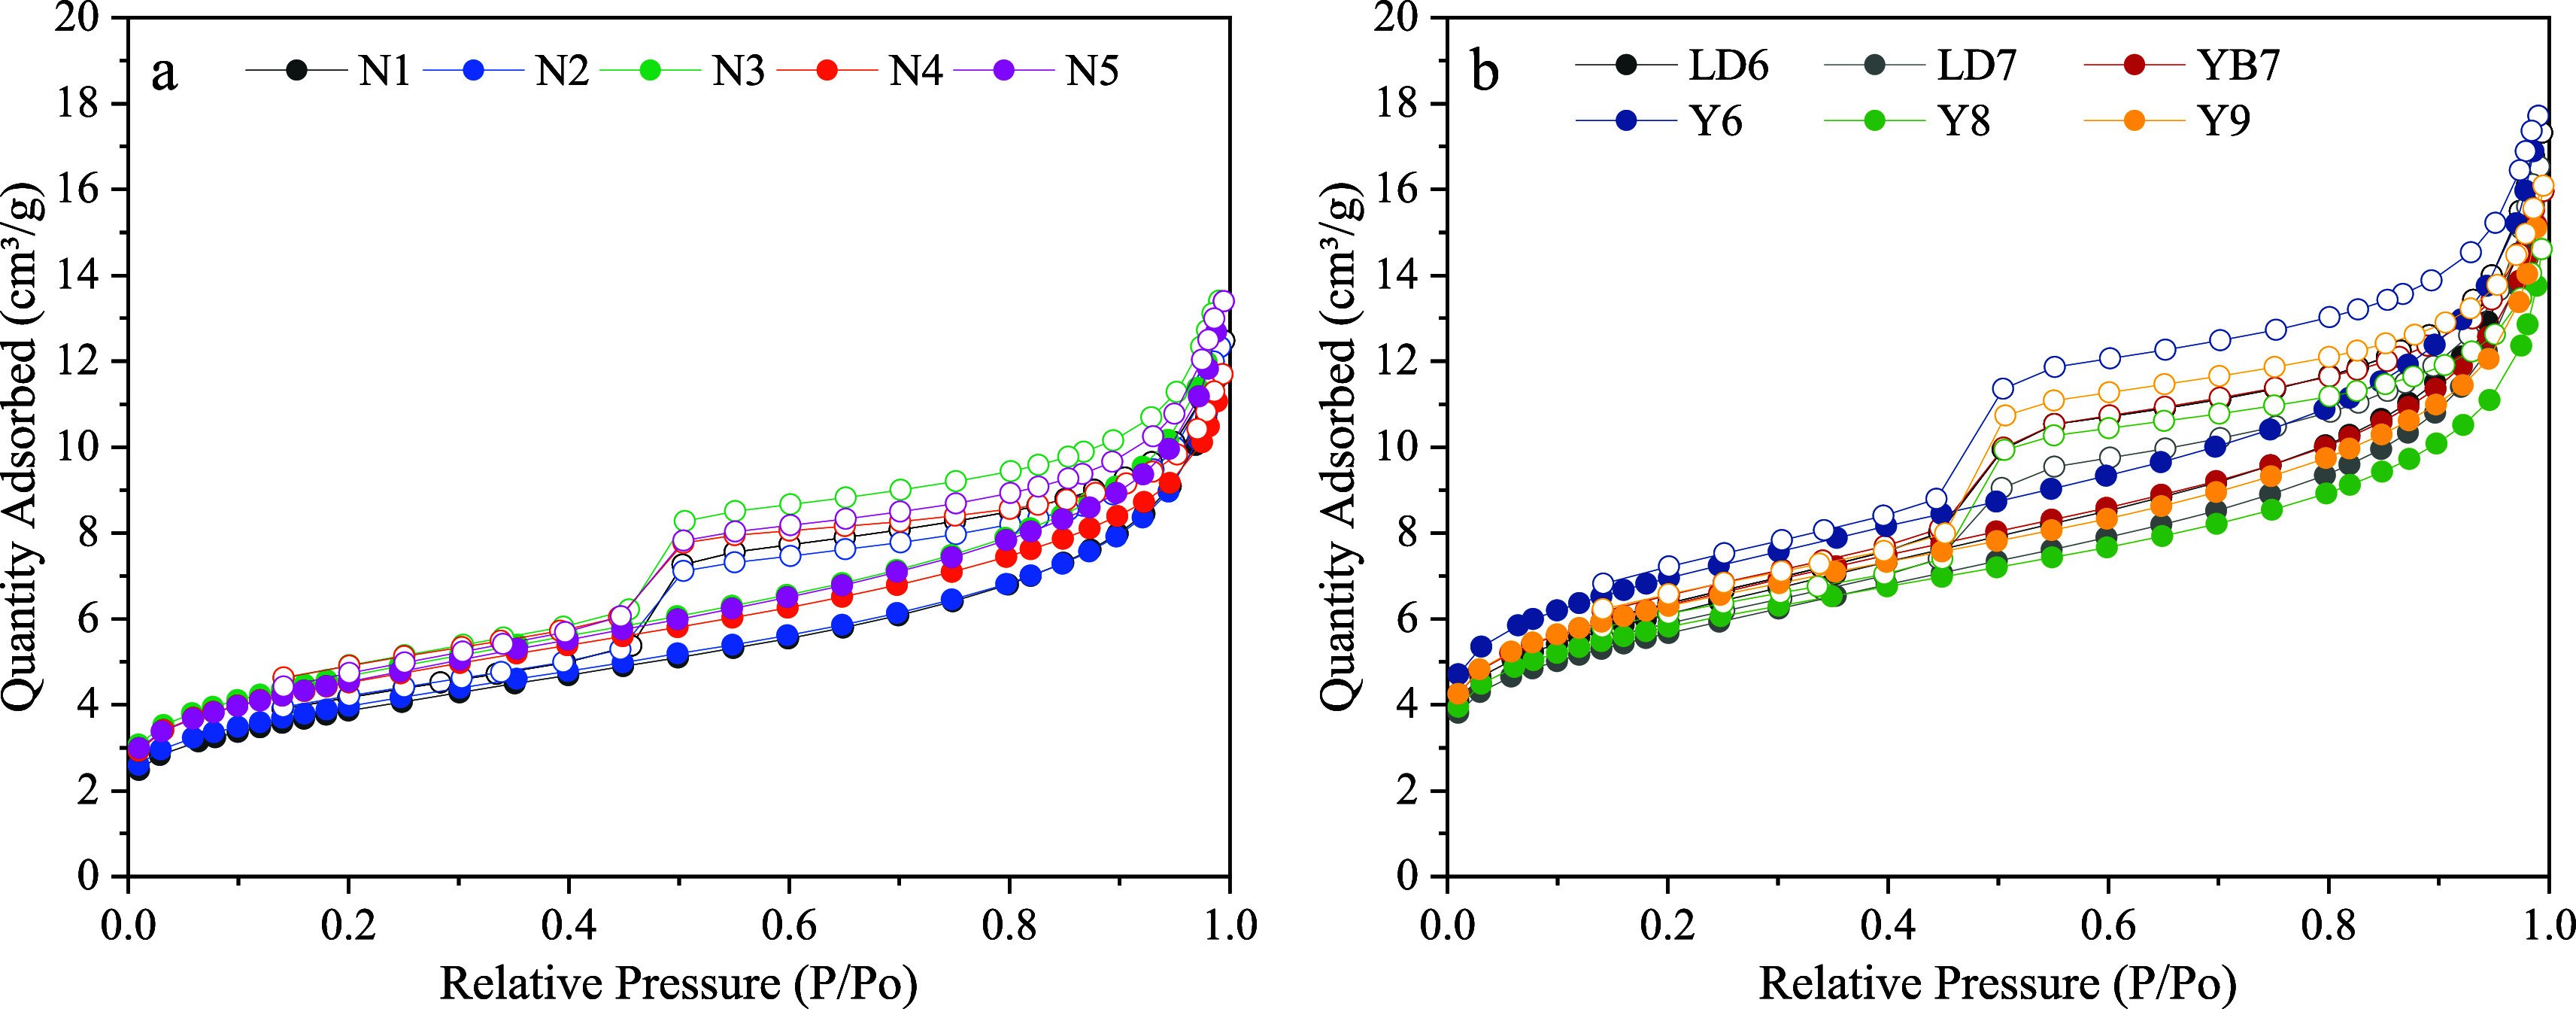
Adsorption/desorption curves of water-producing (a) and gas-producing (b) low-resistivity shale from the Longmaxi Formation in the Southern Sichuan Basin.
Based on the adsorption–desorption curves and hysteresis loops, the pore structure of Longmaxi shales in the Southern Sichuan Basin are analyzed. The physisorption isotherms in low-resistivity shales pertain to a mixed type, combining the characteristics of I(a), II, and IV(a). Specifically, at extremely low relative pressures (P/P0 < 0.01), the adsorption capacity is minimal and increases slightly, which coincides well with the characteristics of the I(a) type and reflects narrow micropores. Then, in the medium-pressure stage, the adsorption capacity rises rapidly with increasing p/p0, and there exists a distinct turning point. As the equilibrium pressure approaches the saturated vapor pressure, the saturated adsorption phenomenon did not appear, and the hysteresis loops are formed between adsorption and desorption curves due to capillary condensation, corresponding to the features of II and IV(a). Micropores in gas-producing LRS are wider than water-producing LRS. In addition, the hysteresis loops closely resemble type H4, indicating that the pores are primarily shaped as a parallel plate slit or a unilateral narrow slit with one end closed (Figure 5).
Table 1 lists the BET specific surface area (SSA), BJH total pore volume (TPV), and average pore diameter (APD) obtained from LTNA.36−38 In water-producing low-resistivity shales (N222), the APD varies from 6.18 to 7.26 nm and averages 6.82 nm; the BJH TPV is in the range of 0.0158–0.0189 cm3/g with a mean of 0.0177 cm3/g; the BET specific surface area (SSA) averages 15.06 m2/g with a range of 13.54–16.27 m2/g. In the gas-producing low-resistivity shales (L211, Y203, and Y101), the APD averages 6.71 nm, and the BJH TPV values have a distribution of 0.0187–0.0237 cm3/g (average of 0.0217 cm3/g), while the average BET SSA is 21.39 m2/g (ranging from 19.69 to 24.72 m2/g). Hence, the gas-producing LRS has a higher SSA and TPV than the water-producing LRS, which is conducive to gas storage.
Table 1. Pore Structure Parameter Pbtained from LNTA and LCTA Analysis.
| N2 adsorption |
CO2 adsorption |
|||||
|---|---|---|---|---|---|---|
| well | sample number | average pore diameter (nm) | BET surface area (m2/g) | BJH volume (cm3/g) | BET surface area (m2/g) | DFT volume (cm3/g) |
| N222 | N1 | 7.26 | 13.54 | 0.0178 | 8.16 | 0.0023 |
| N2 | 7.21 | 13.86 | 0.0174 | 8.20 | 0.0023 | |
| N3 | 6.76 | 16.27 | 0.0186 | 9.26 | 0.0027 | |
| N4 | 6.18 | 15.73 | 0.0158 | 10.82 | 0.0032 | |
| N5 | 6.67 | 15.9 | 0.0189 | 8.11 | 0.0022 | |
| L211 | LD6 | 6.81 | 21.21 | 0.0237 | 9.70 | 0.0025 |
| LD7 | 7.01 | 19.69 | 0.0227 | 9.42 | 0.0024 | |
| Y203 | YB7 | 6.26 | 21.88 | 0.0211 | 10.20 | 0.0028 |
| Y101 | Y6 | 6.54 | 23.93 | 0.0231 | 11.81 | 0.0032 |
| Y8 | 6.72 | 19.97 | 0.0187 | 11.64 | 0.0032 | |
| Y9 | 6.80 | 21.66 | 0.0207 | 10.00 | 0.0028 | |
The pore size distribution (PSD) curves, reflecting the varying law of APD, PV, and SSA with pore size, are displayed in Figure 6. Based on dV/d(log w) curves, the pore volume of low-resistivity shales is predominantly contributed by pores ranging from 2.2 to 3.3 nm, and the curves exhibit a unimodal pattern. By coincidence, the distribution curves of the SSA and APD are basically uniform with the same unimodal morphology. The major peak in low-resistivity shales occurs around 2.1–4 nm with a peak value of 2.1 nm.
Figure 6.
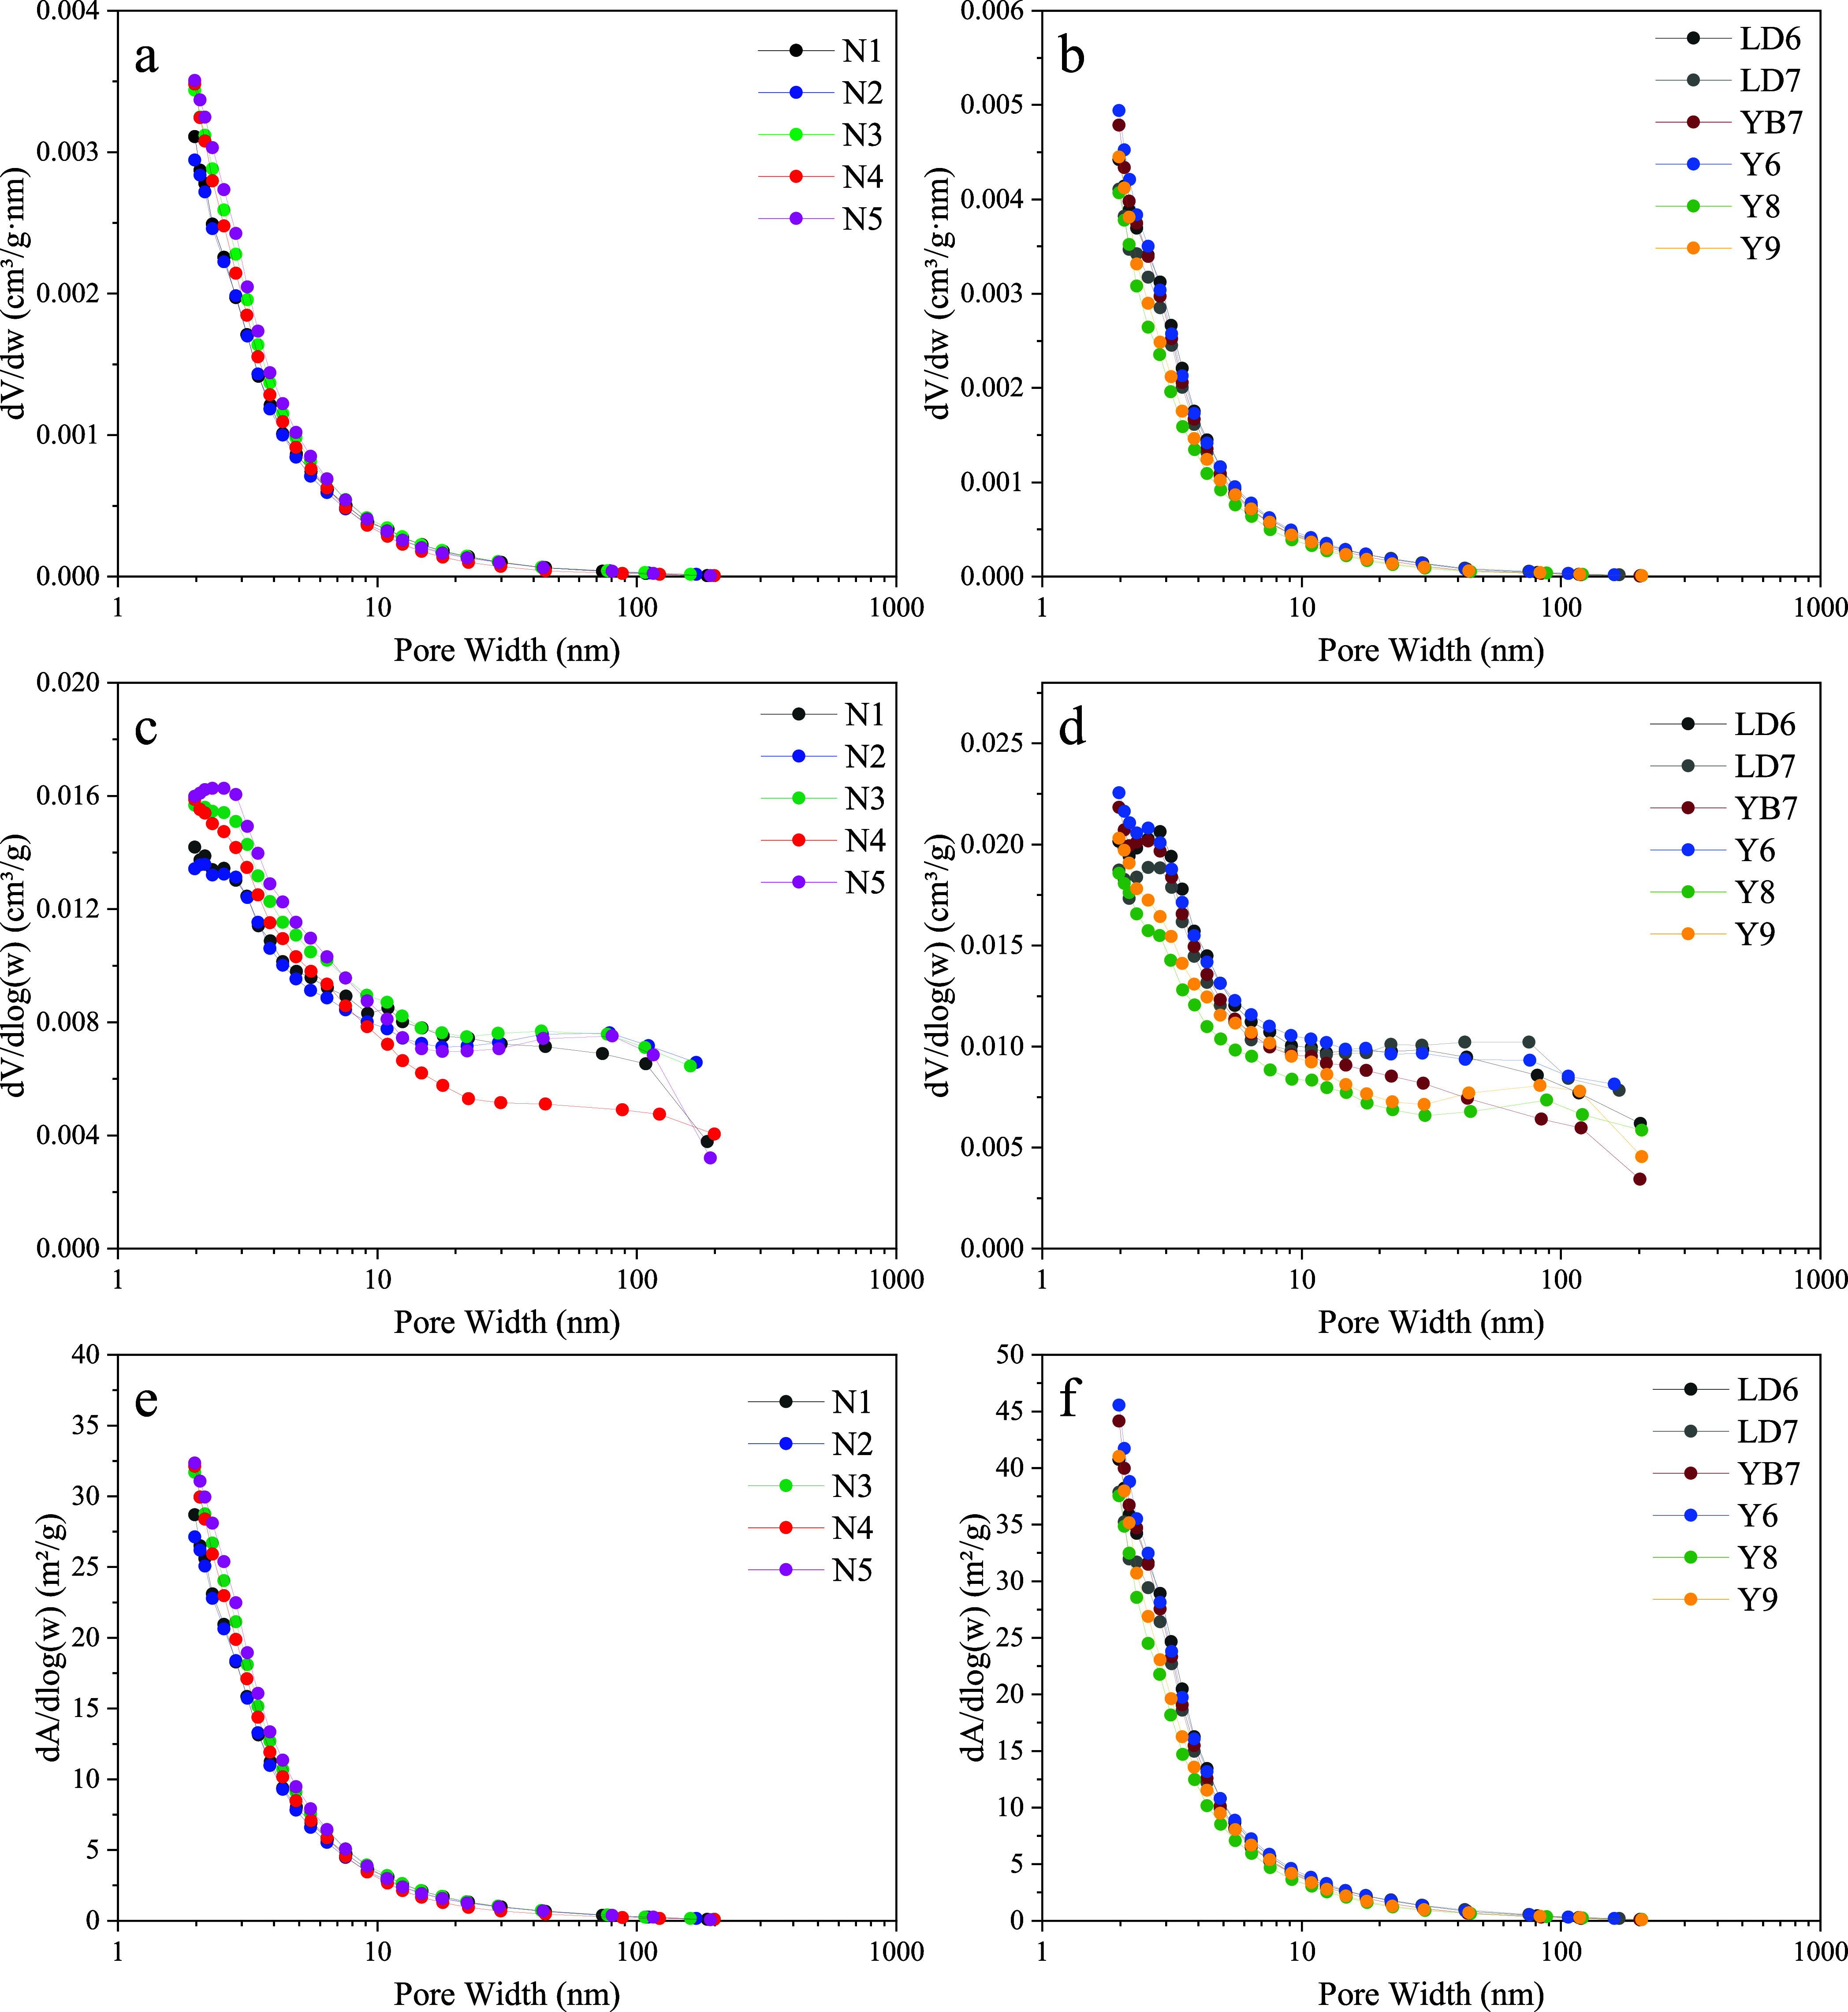
Pore size, PV, and SSA distribution of Longmaxi Formation shale in the Southern Sichuan Basin based on N2 experiments. (a,b) Pore diameter varying with pore width, (c,d) pore volume varying with pore width, and (e,f) specific surface area varying with pore width.
4.3.2. Low-Temperature CO2 Adsorption Isotherms (LTCA)
LTNA is a practical tool for characterizing the pore structure in shale, but it cannot cover the entire scope of micropores. Due to the small size and sufficient thermal energy of CO2 molecules, LTCA can effectively measure micropores in range of 0.35–2 nm, which is applicable to the micropore study. LTCA shares a similar principle with LTNA, but the experimental conditions and PSD calculation models are different, where density functional theory (DFT) is adopted to determine the TPV and SSA.
As shown in Figure 7, the CO2 adsorption curves are convex slightly during the low-pressure stage, corresponding to type I isotherms. Specifically, the isotherms of low-resistivity shale samples from the Longmaxi formation are displayed as the I(b) type, indicating a relative wider micropore size. When the P/P0 approaches 0.03, the maximum adsorption capacities of N222 and gas-producing samples are in the ranges of 1.51–2.06 and 1.91–4.82 cm3/ g, averaging 1.68 and 2.37 cm3/g, respectively. As shown in Table 1, the TPV of water-producing (N222) and gas-producing (Y101, YB203 and L211) low-resistivity shales averages 0.0025 and 0.0030 cm3/g, together with the SSA equivalent to 8.998 and 10.46 m2/g, respectively. These results are in accordance with those obtained from LTNA.
Figure 7.
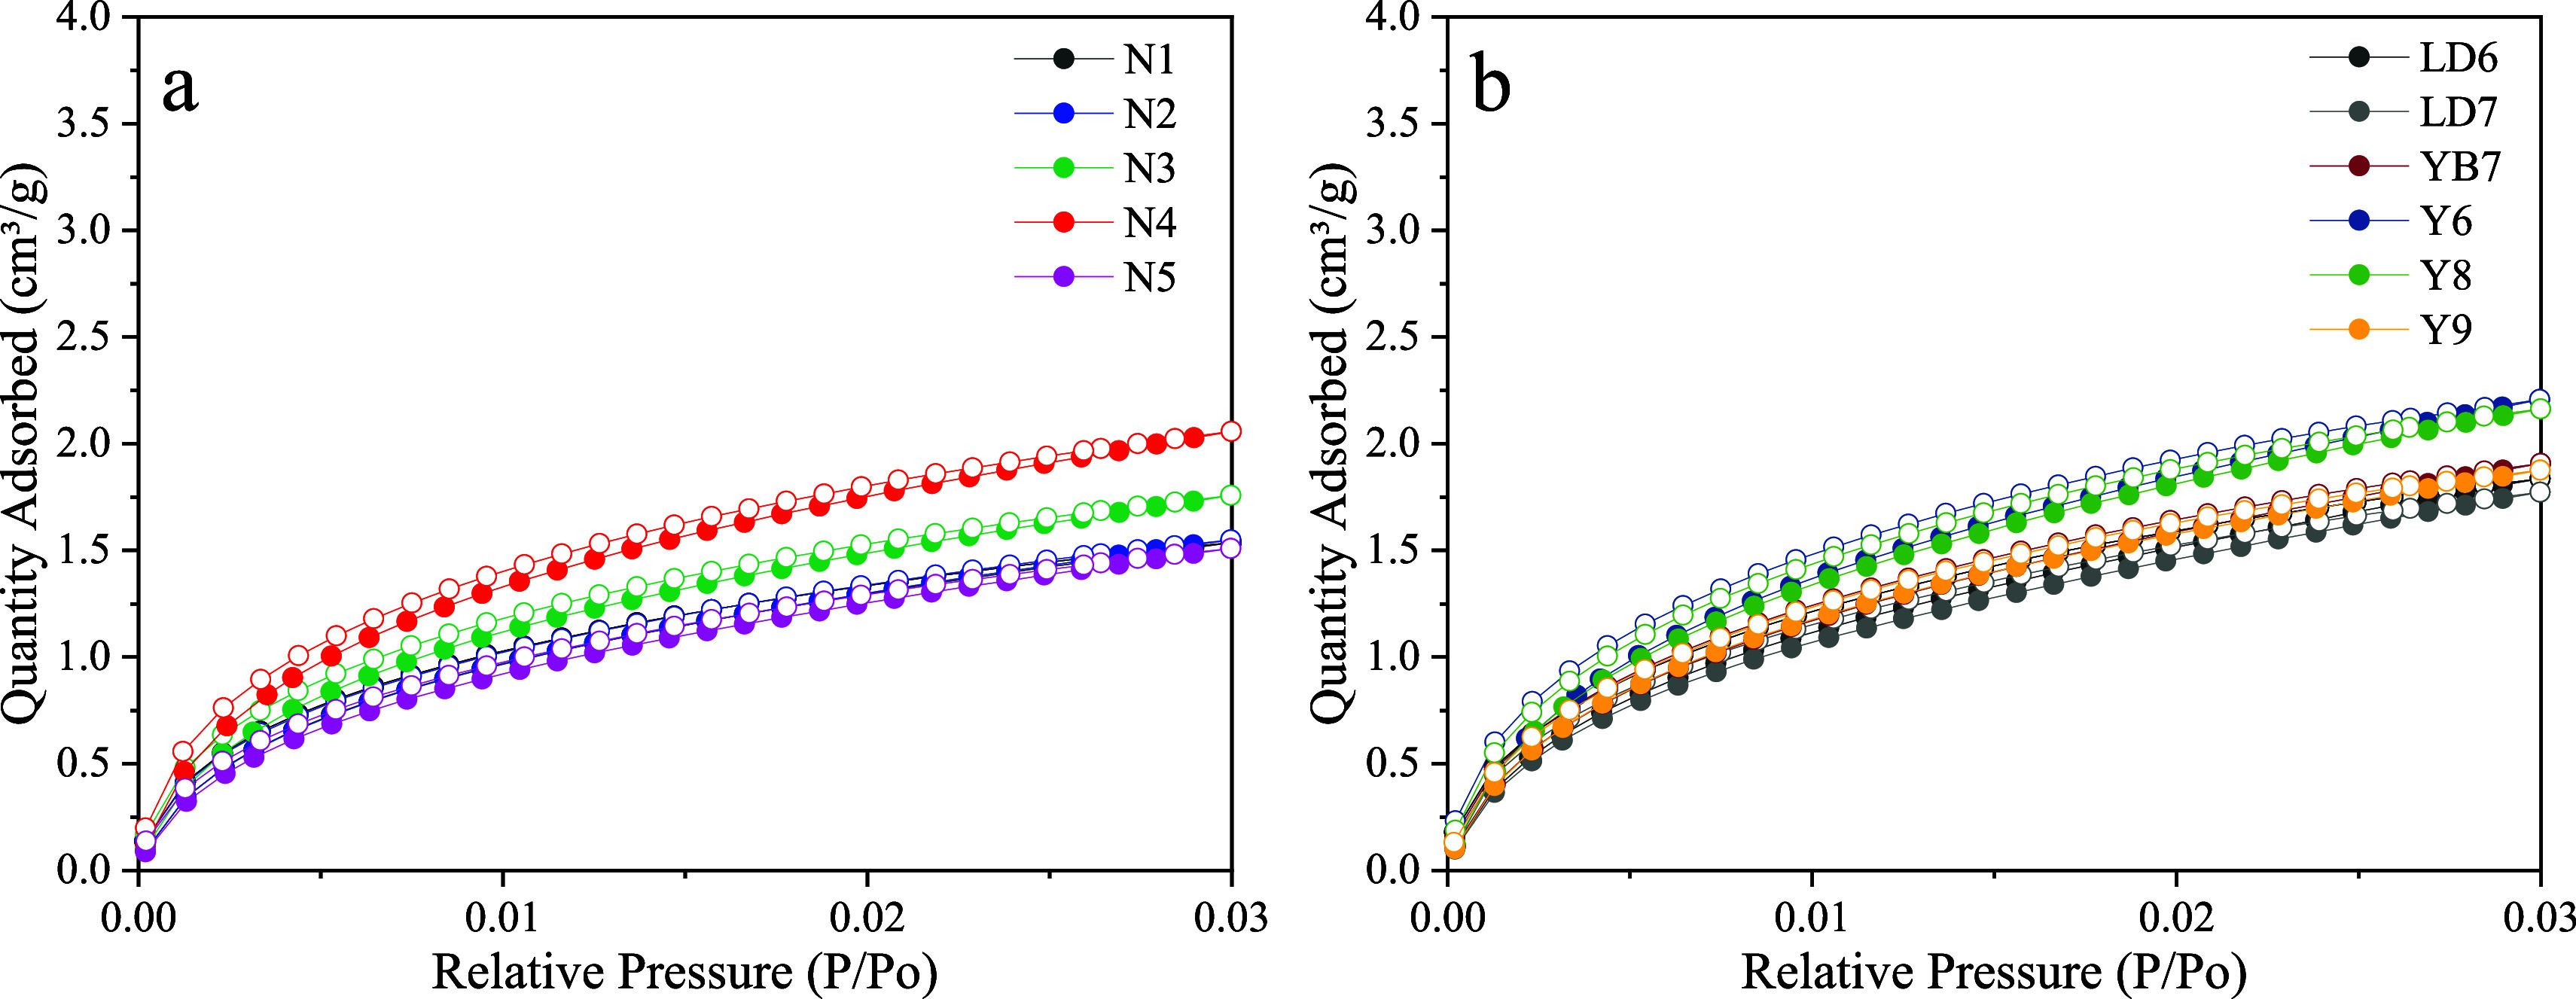
Isotherm of CO2 adsorption in water-producing (a) and gas-producing (b) low-resistivity shale from Longmaxi Formation in Southern Sichuan.
With regard to the PSD, the TPV and SSA in LRS of Longmaxi Formation in the Southern Sichuan Basin exhibit an identical bimodal trend, which are dominantly contributed by micropores in ranges of 0.47–0.66 and 0.78–0.9 nm (Figure 8).
Figure 8.
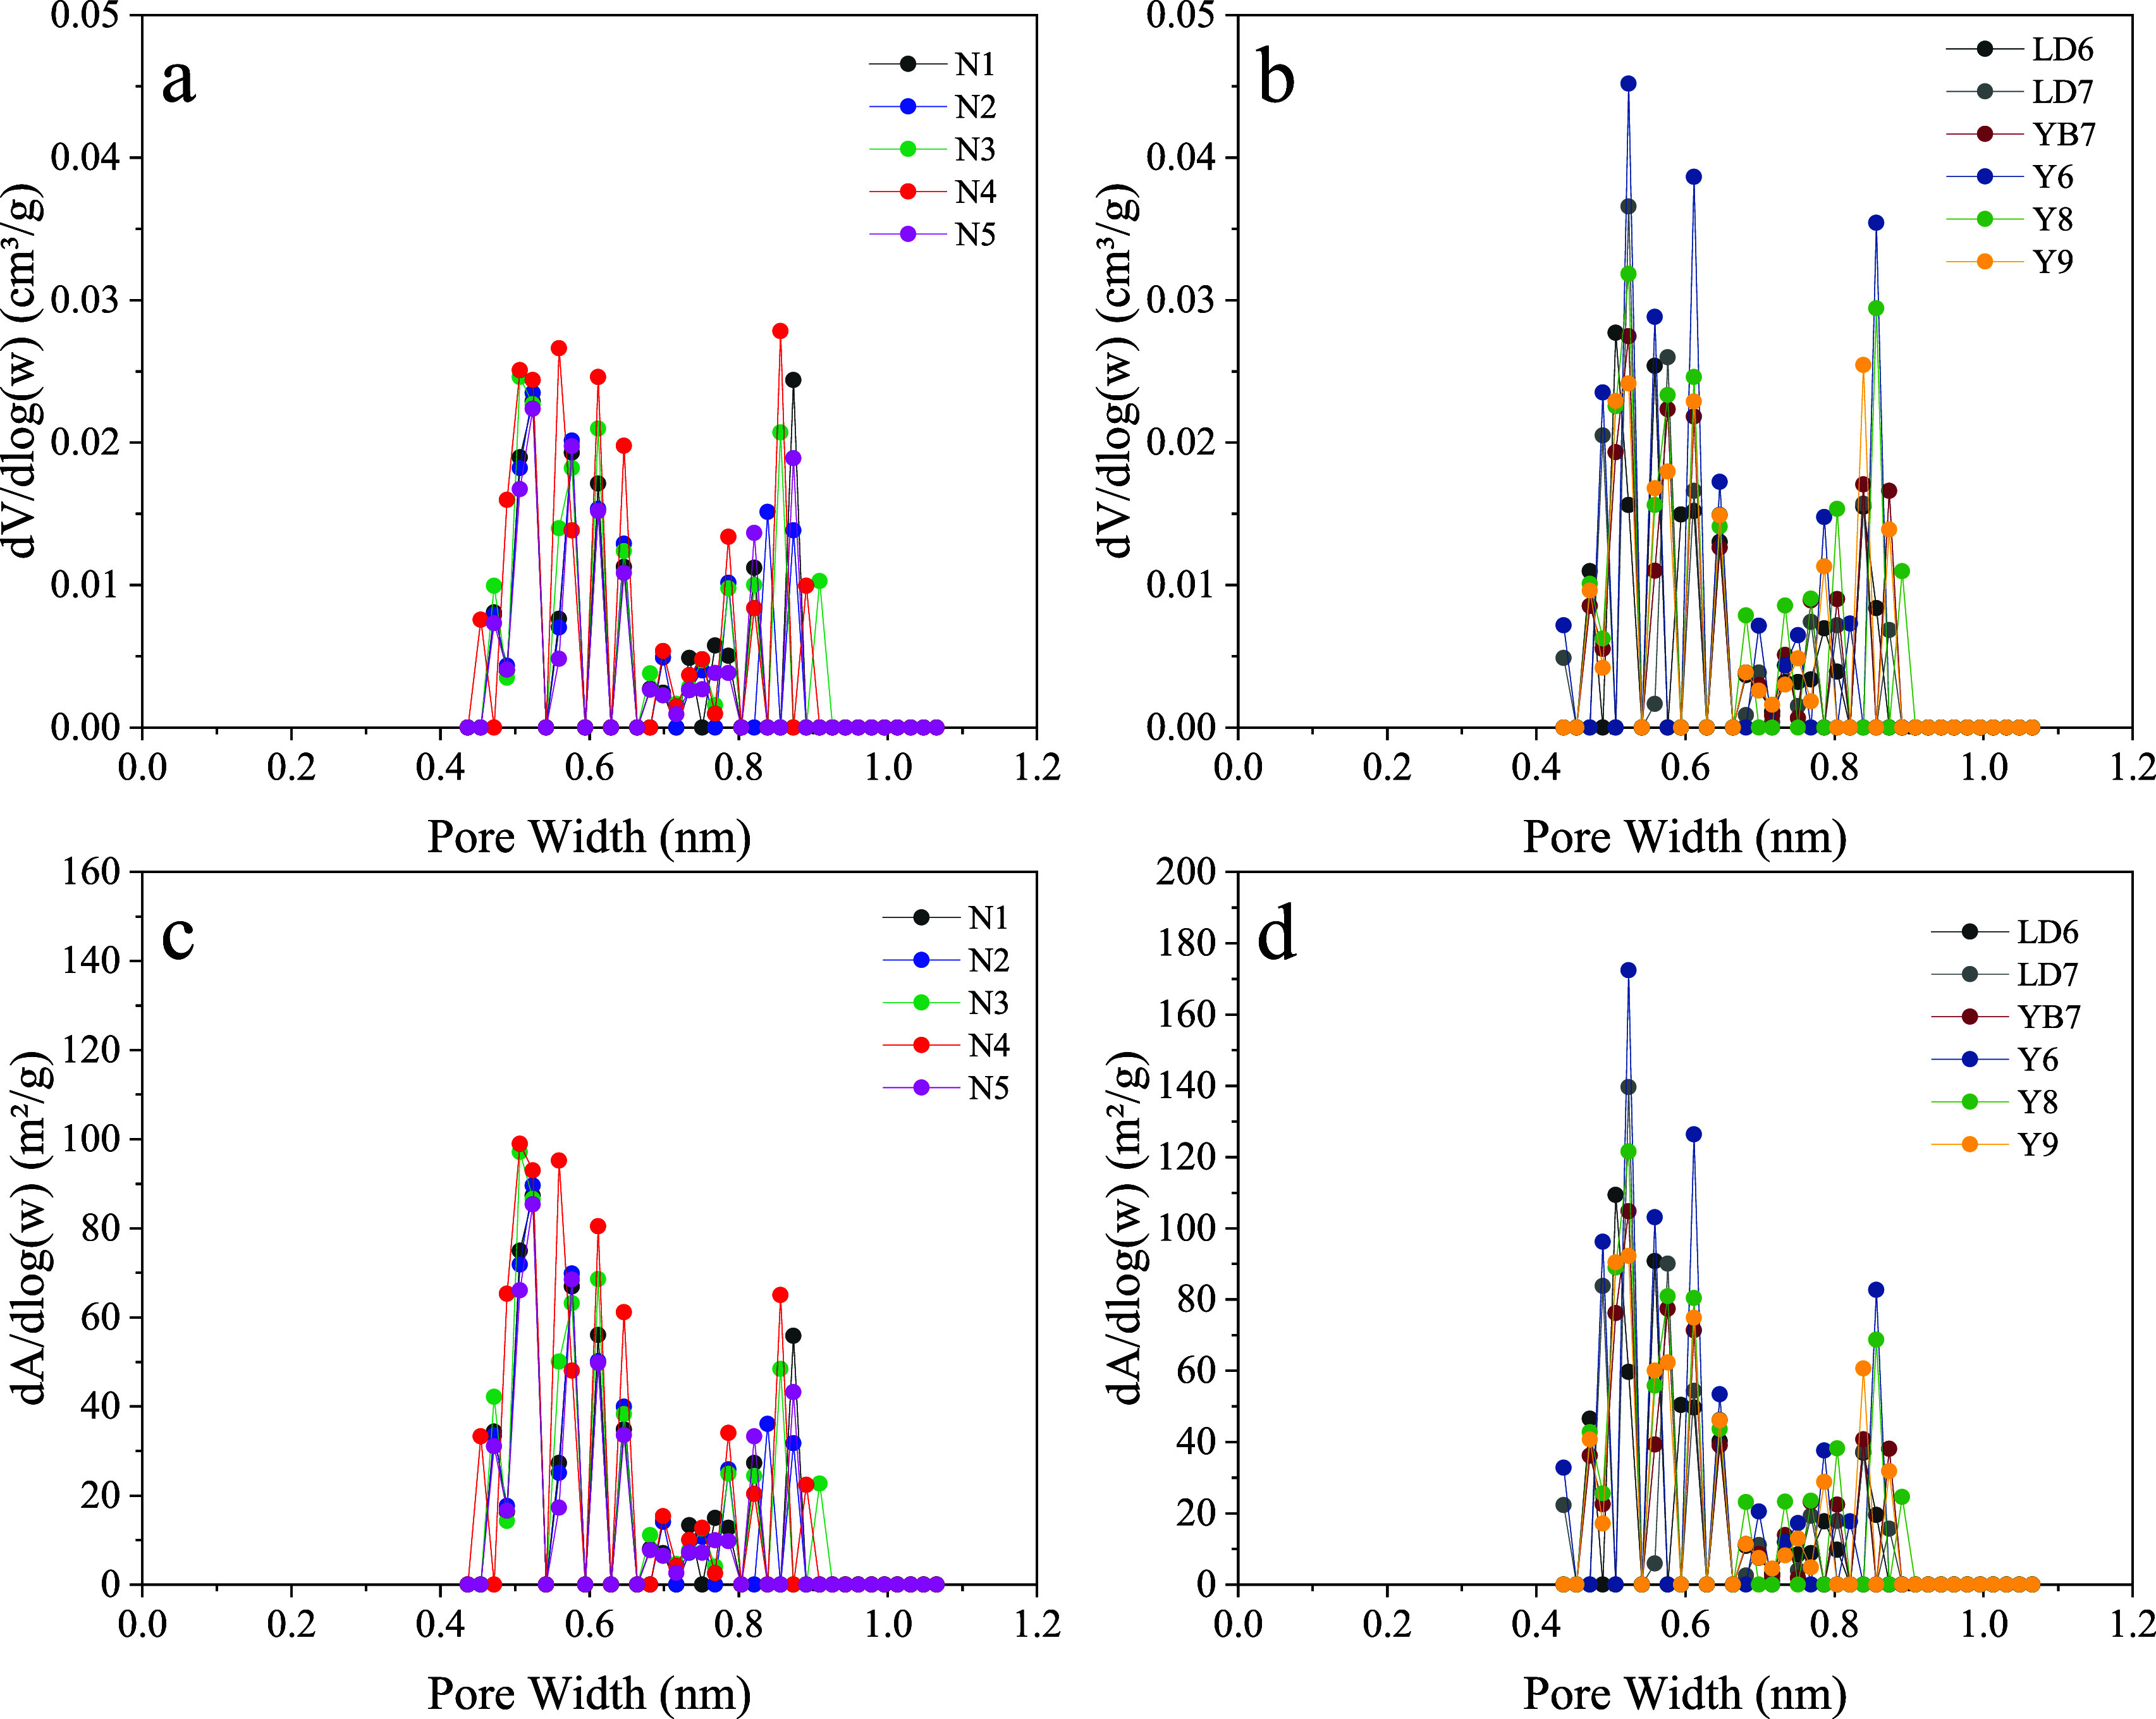
PV (a,b) and SSA (c,d) distribution of Longmaxi Formation LRS in the Southern Sichuan Basin based on CO2 experiments.
4.4. NMR T2 Spectrum Distributions
The characteristics of the shale pore structure can also be obtained by detecting the NMR signals of fully saturated core plugs. Previous studies have demonstrated that residual signals after drying cores are still existing, which are regarded as a base signal to reflect the semisolid substances containing hydrogen and partial bound water in shale.39,40 In other words, the NMR data of fully saturated samples comprise signals of the pore fluid and the rock matrix itself. Thus, it is essential to deduct the base signal to better reflect the spatial structure of the pores in shale.
As shown in Figure 9, the T2 spectra of selected low-resistivity shale cores were analyzed, expecting to discover their similarities and differences: (1) According to an analysis of curve shapes, the NMR T2 spectra of four shales from L211 can be divided into three types: unimodal, bimodal, and trimodal T2 spectra. Among them, LD6 and LD8 present a trimodal shape, and the dominant peak is distributed in 0.3–26.8 ms with peak values at 2.4–4.6 ms. The left two peaks are joined to indicate a connection between small and medium pores. The pore size of LD8 is slightly smaller than that of LD6. LD7 shows a continuous bimodal distribution, where the main peak on the right ranges from 0.4 to 26.8 ms. The unimodal T2 spectrum in core LD9 has an isolated peak with a short relaxation time between 0.1 and 21.5 ms. (2) Samples from well N222 show unimodal and bimodal spectra (separated and continuous). Continuous bimodal distribution (N1 and N2) has a large peak with relaxation time from 0.01 to 13.9 ms. N5 shows a separated bimodal type, and the dominant and secondary peak values are 1.55 and 155.05 ms, respectively. N4 exhibits a unimodal spectrum with a peak value at 2.4 ms. (3) T2 spectra of shale cores in well Y101 are displayed as a separated bimodal type, and the amplitude of the left peak is remarkably larger than the right peak. The left peak of Y8 and Y9 shows an inconspicuous continuous bimodal trend with peak values at 0.27 and 4.64 ms and 0.64 and 4.64 ms, respectively. The left peak of Y1 lies between 0.01 and 5.78 ms, peaking at 1.6 ms, while the right peak for Y1, Y8, and Y9 occurs at 100.3, 155.05, and 124.52 ms. (4) In Y203 samples, the T2 spectrum belongs to an obvious unimodal type, and the relaxation time is distributed in the range of 0.01–4 ms with peak values equal to 0.64 ms. It suggests that only small pores are developed instead of large pores and microfractures. To summarize, the NMR curves of LRS are shaped diversely with unimodal, bimodal, and trimodal patterns, indicating a complicated pore structure. The pores in low-resistivity shale are distributed in a wide range with relatively good connectivity, covering a full scale of micropores, mesopores, and macropores.
Figure 9.

NMR T2 spectrum for the target samples: (a) L211, (b) N222, and (c) Y101 and Y203.
5. Discussion
5.1. Micronanopore Characteristics
5.1.1. Whole-Aperture Distribution Based on the Gas Adsorption Method
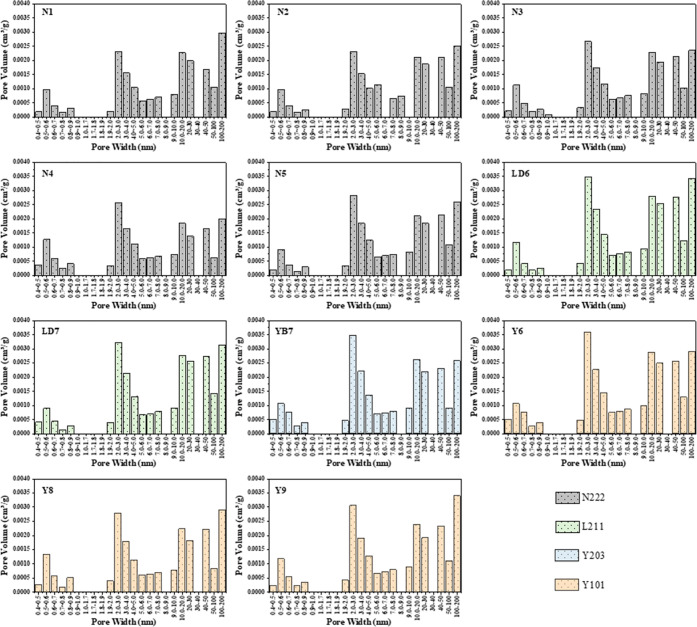
The full-scale pore size distribution can be quantitatively characterized by gas adsorption experiments, where micropores and mesopores are determined by CO2 and N2 adsorption, respectively. Then, the pore volume and specific surface area of micropores and mesopores are subtracted from the total PV and SSA by N2 adsorption experiments to acquire the macropore values.41 According to the pore volume distribution plot and its proportion histogram (Figures 10 and 11), the average total pore volumes of N222 and gas-producing shale with low resistivity are 0.01768 and 0.02168 cm3/g, respectively, where the gas-producing LRS has a larger pore volume primarily influenced by mesopores. Mesopores account for about 78% of the pore volume in shale samples and are mainly contributed by pores in sizes of 2–4, 10–30, and 40–50 nm. It is further noted that in low-resistivity shale, mesopores located in 2–4 nm are more contributable. Then, micropores are followed by 15% approximately, with a dominant pore size of 0.5–0.6 nm. In addition, macropores in the size of 100–200 nm also contribute to the pore volume of LRS.
Figure 10.
Whole-aperture pore volume distribution of water-producing LRS and gas-producing LRS in the Longmaxi Formation of the Southern Sichuan Basin.
Figure 11.
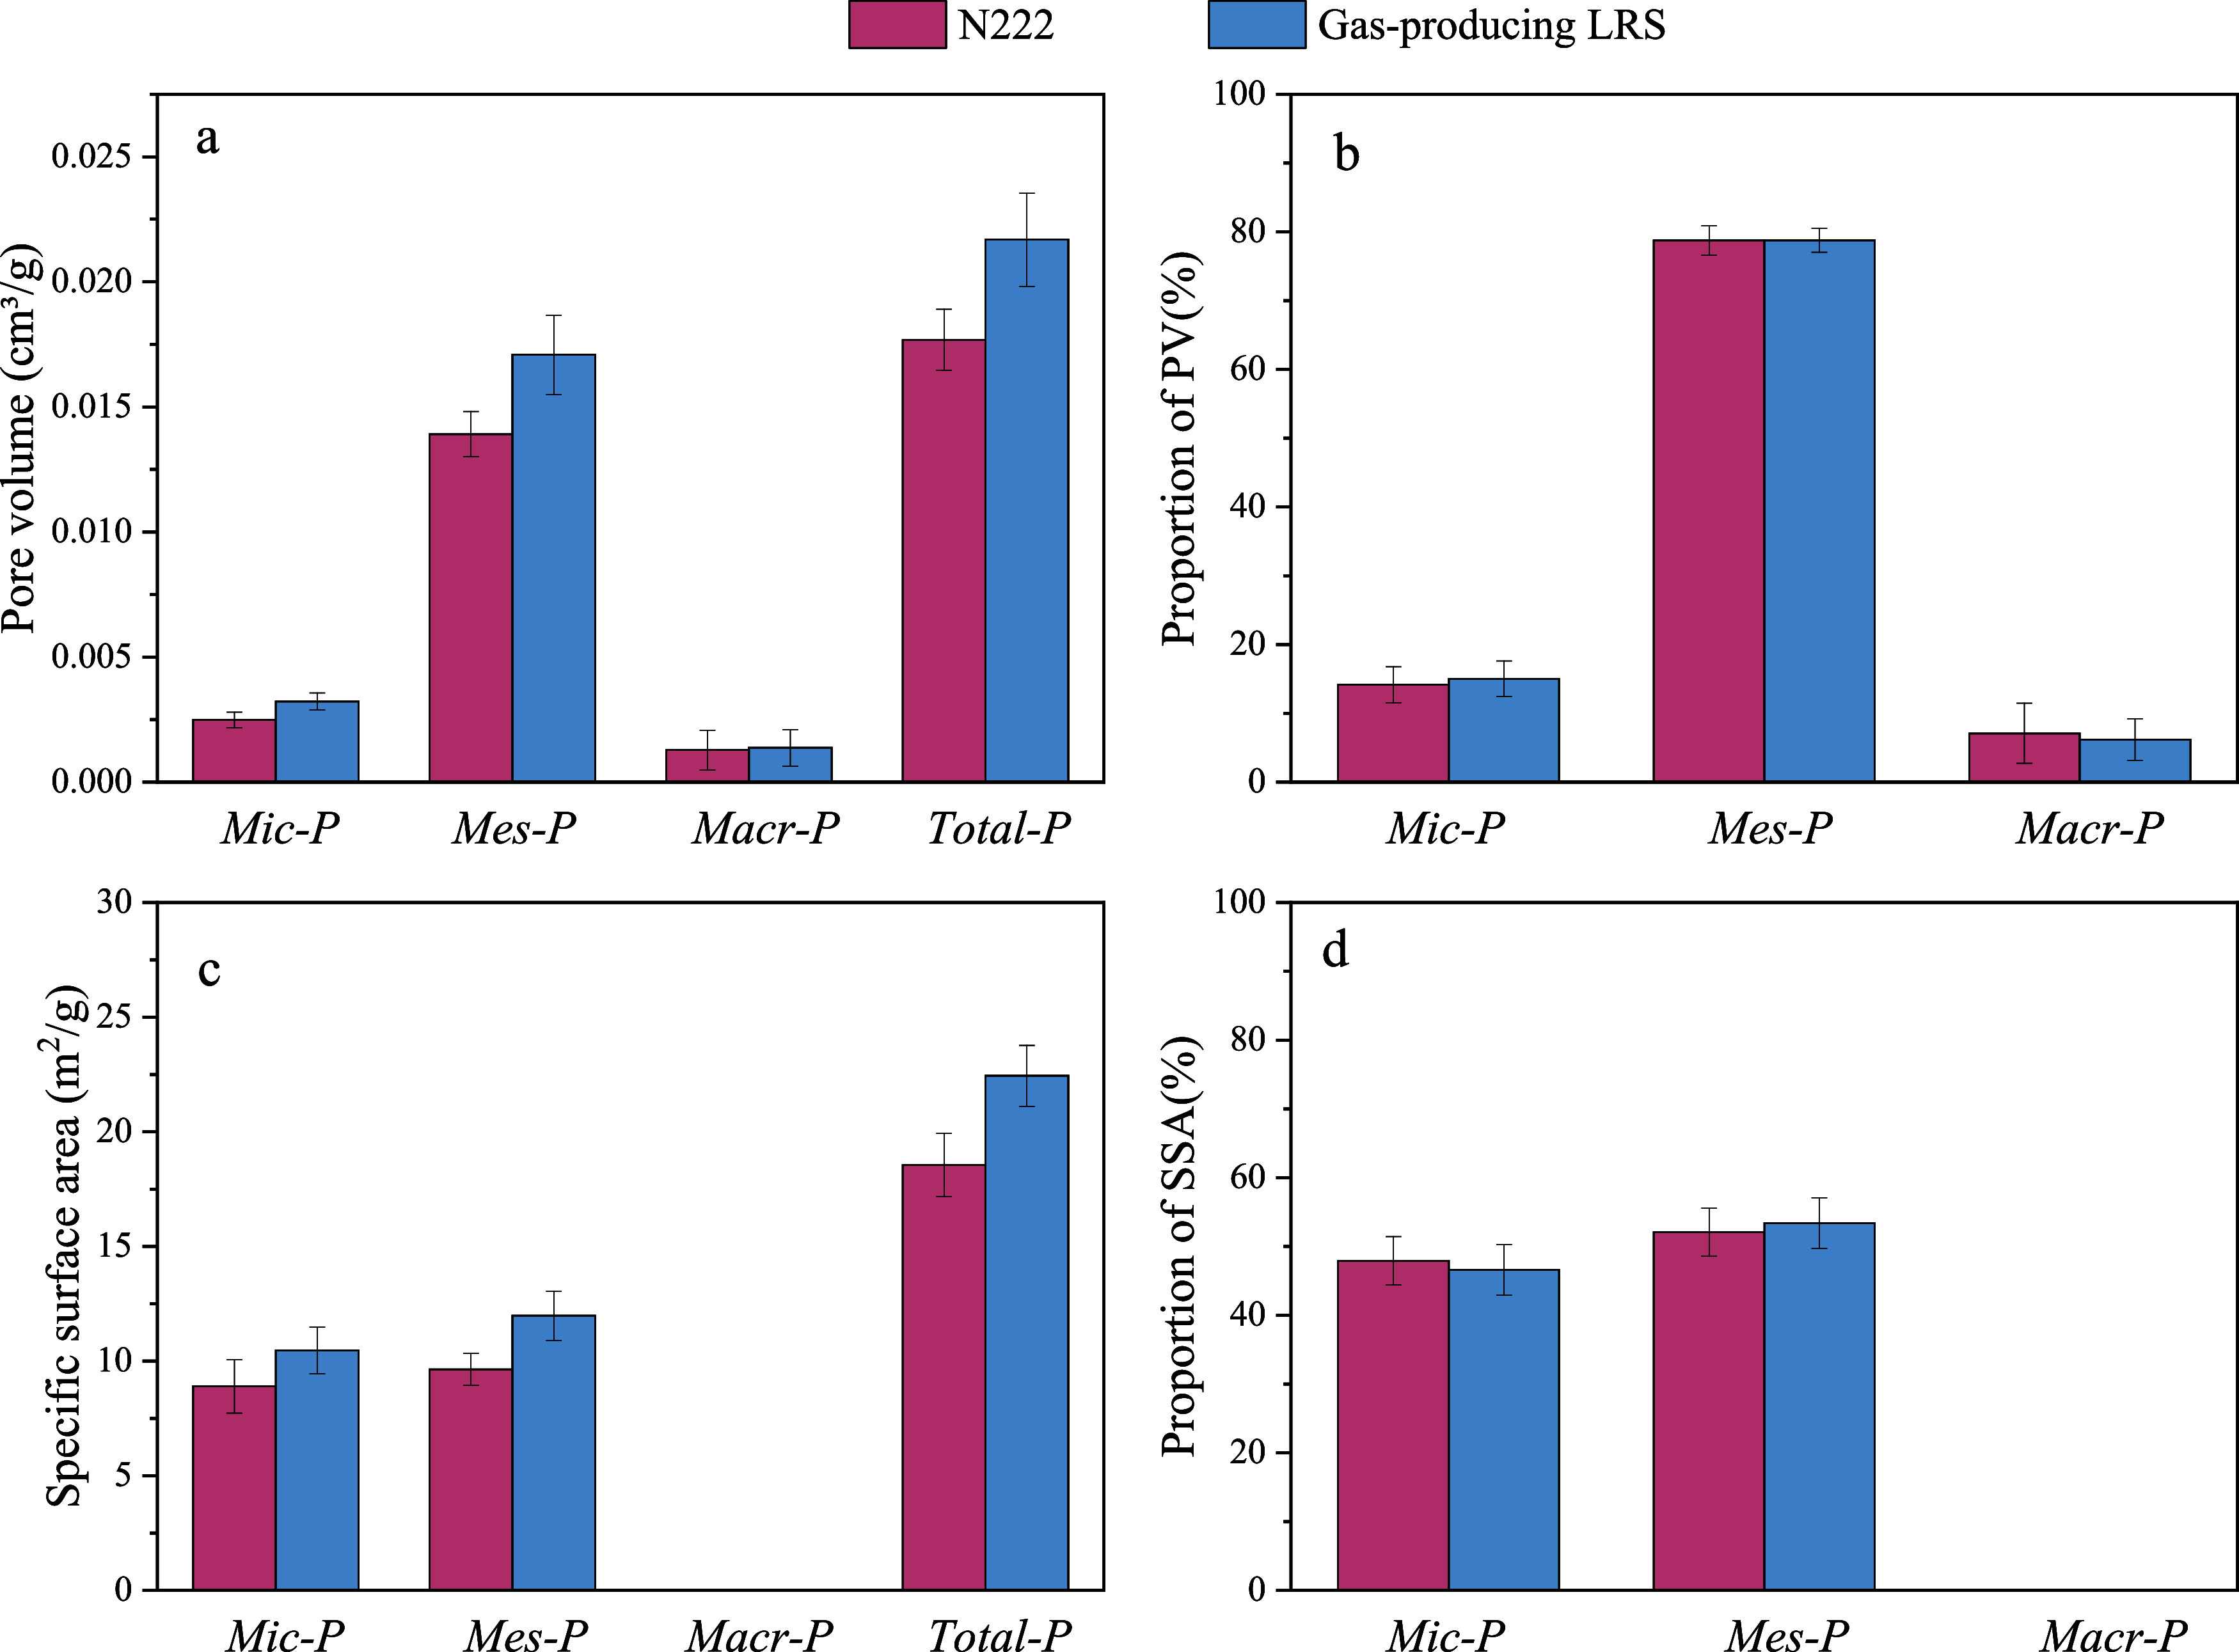
Data and proportion histogram of the PV and SSA of micropores (Mic-P), mesopores (Mes-P), and macropores (Mac-P) in the target samples. (a) PV data, (b) PV proportion, (c) SSA data, and (d) SSA proportion.
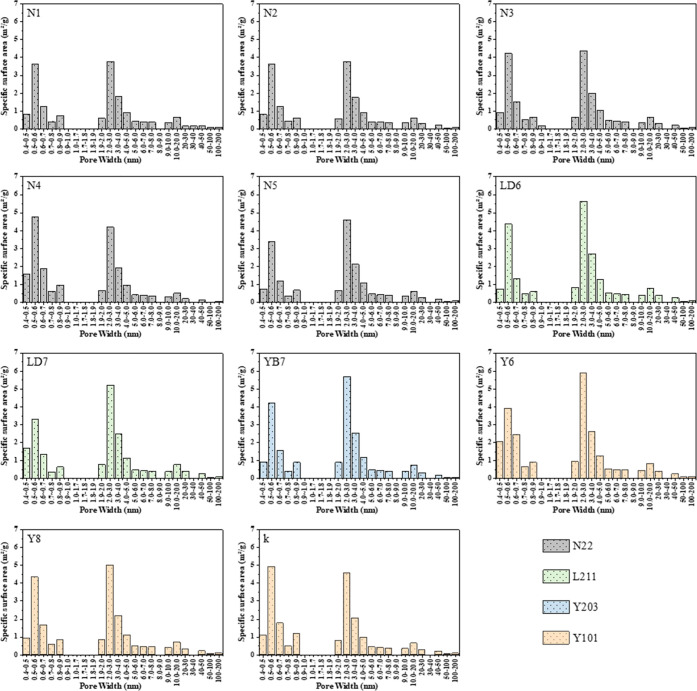
As shown in Figure 11c,d, the average SSA of N222 and gas-producing LRS are 18.55 and 22.68 m2/g, respectively, indicating that LRS has a larger SSA dominated by micropores and mesopores. The mesopores in low-resistivity shale are dominant in the SSA, accounting for 53% of the total, and micropores follow at 47%. Macropores have no contribution to the SSA in LRS. Additionally, the SSA of micropores and mesopores are mainly contributed by pores in sizes of 0.5–0.6 and 2–4 nm with similar proportions, suggesting that small pores are more significant to the SSA than TPV (Figure 12).
Figure 12.
Whole-aperture specific surface area distribution of water-producing LRS (N222) and gas-producing LRS in the Longmaxi Formation of the Southern Sichuan Basin.
5.1.2. Whole-Aperture Distribution Based on NMR
Pore structure analysis is fundamental to the research on microscopic characteristics of shale reservoirs, in which the full-scale pore size distribution can be portrayed by the NMR method alone.42 It is believed in shale cores that pore size is proportional to the transverse relaxation time.43 A long relaxation time refers to large pores, while a short relaxation time corresponds to small pores. The correlation between the pore size and relaxation signals is expressed as follows:
| 6 |
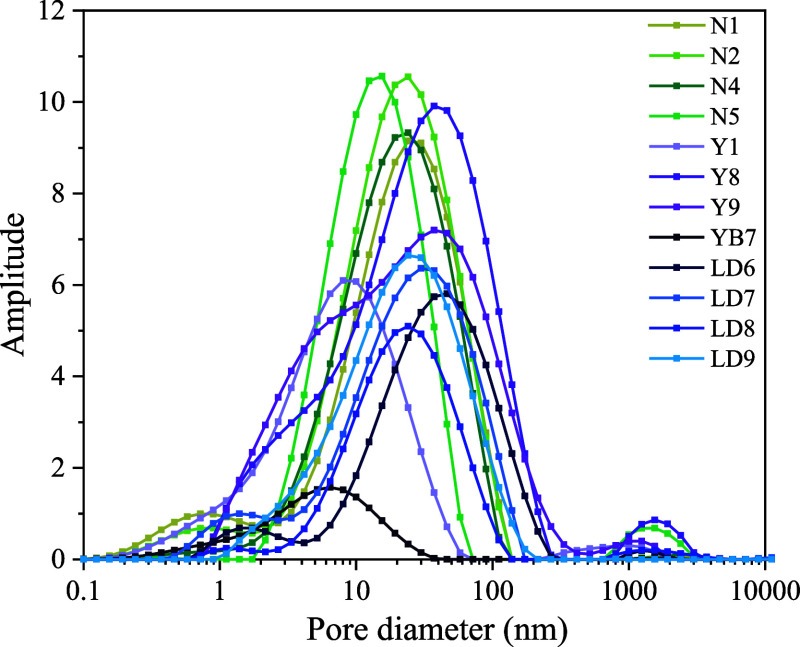
Among them, it is generally recommended by many scholars that the surface relaxation rate ρ and the shape factor Fs are assigned to be 50 nm/ms and 2, respectively.44−46 Combining this result and our previously published nitrogen adsorption data, the saturated T2 spectrum of Longmaxi shale in the Southern Sichuan region is transformed into the pore size distribution38,47,48 (Figure 15).
Figure 15.
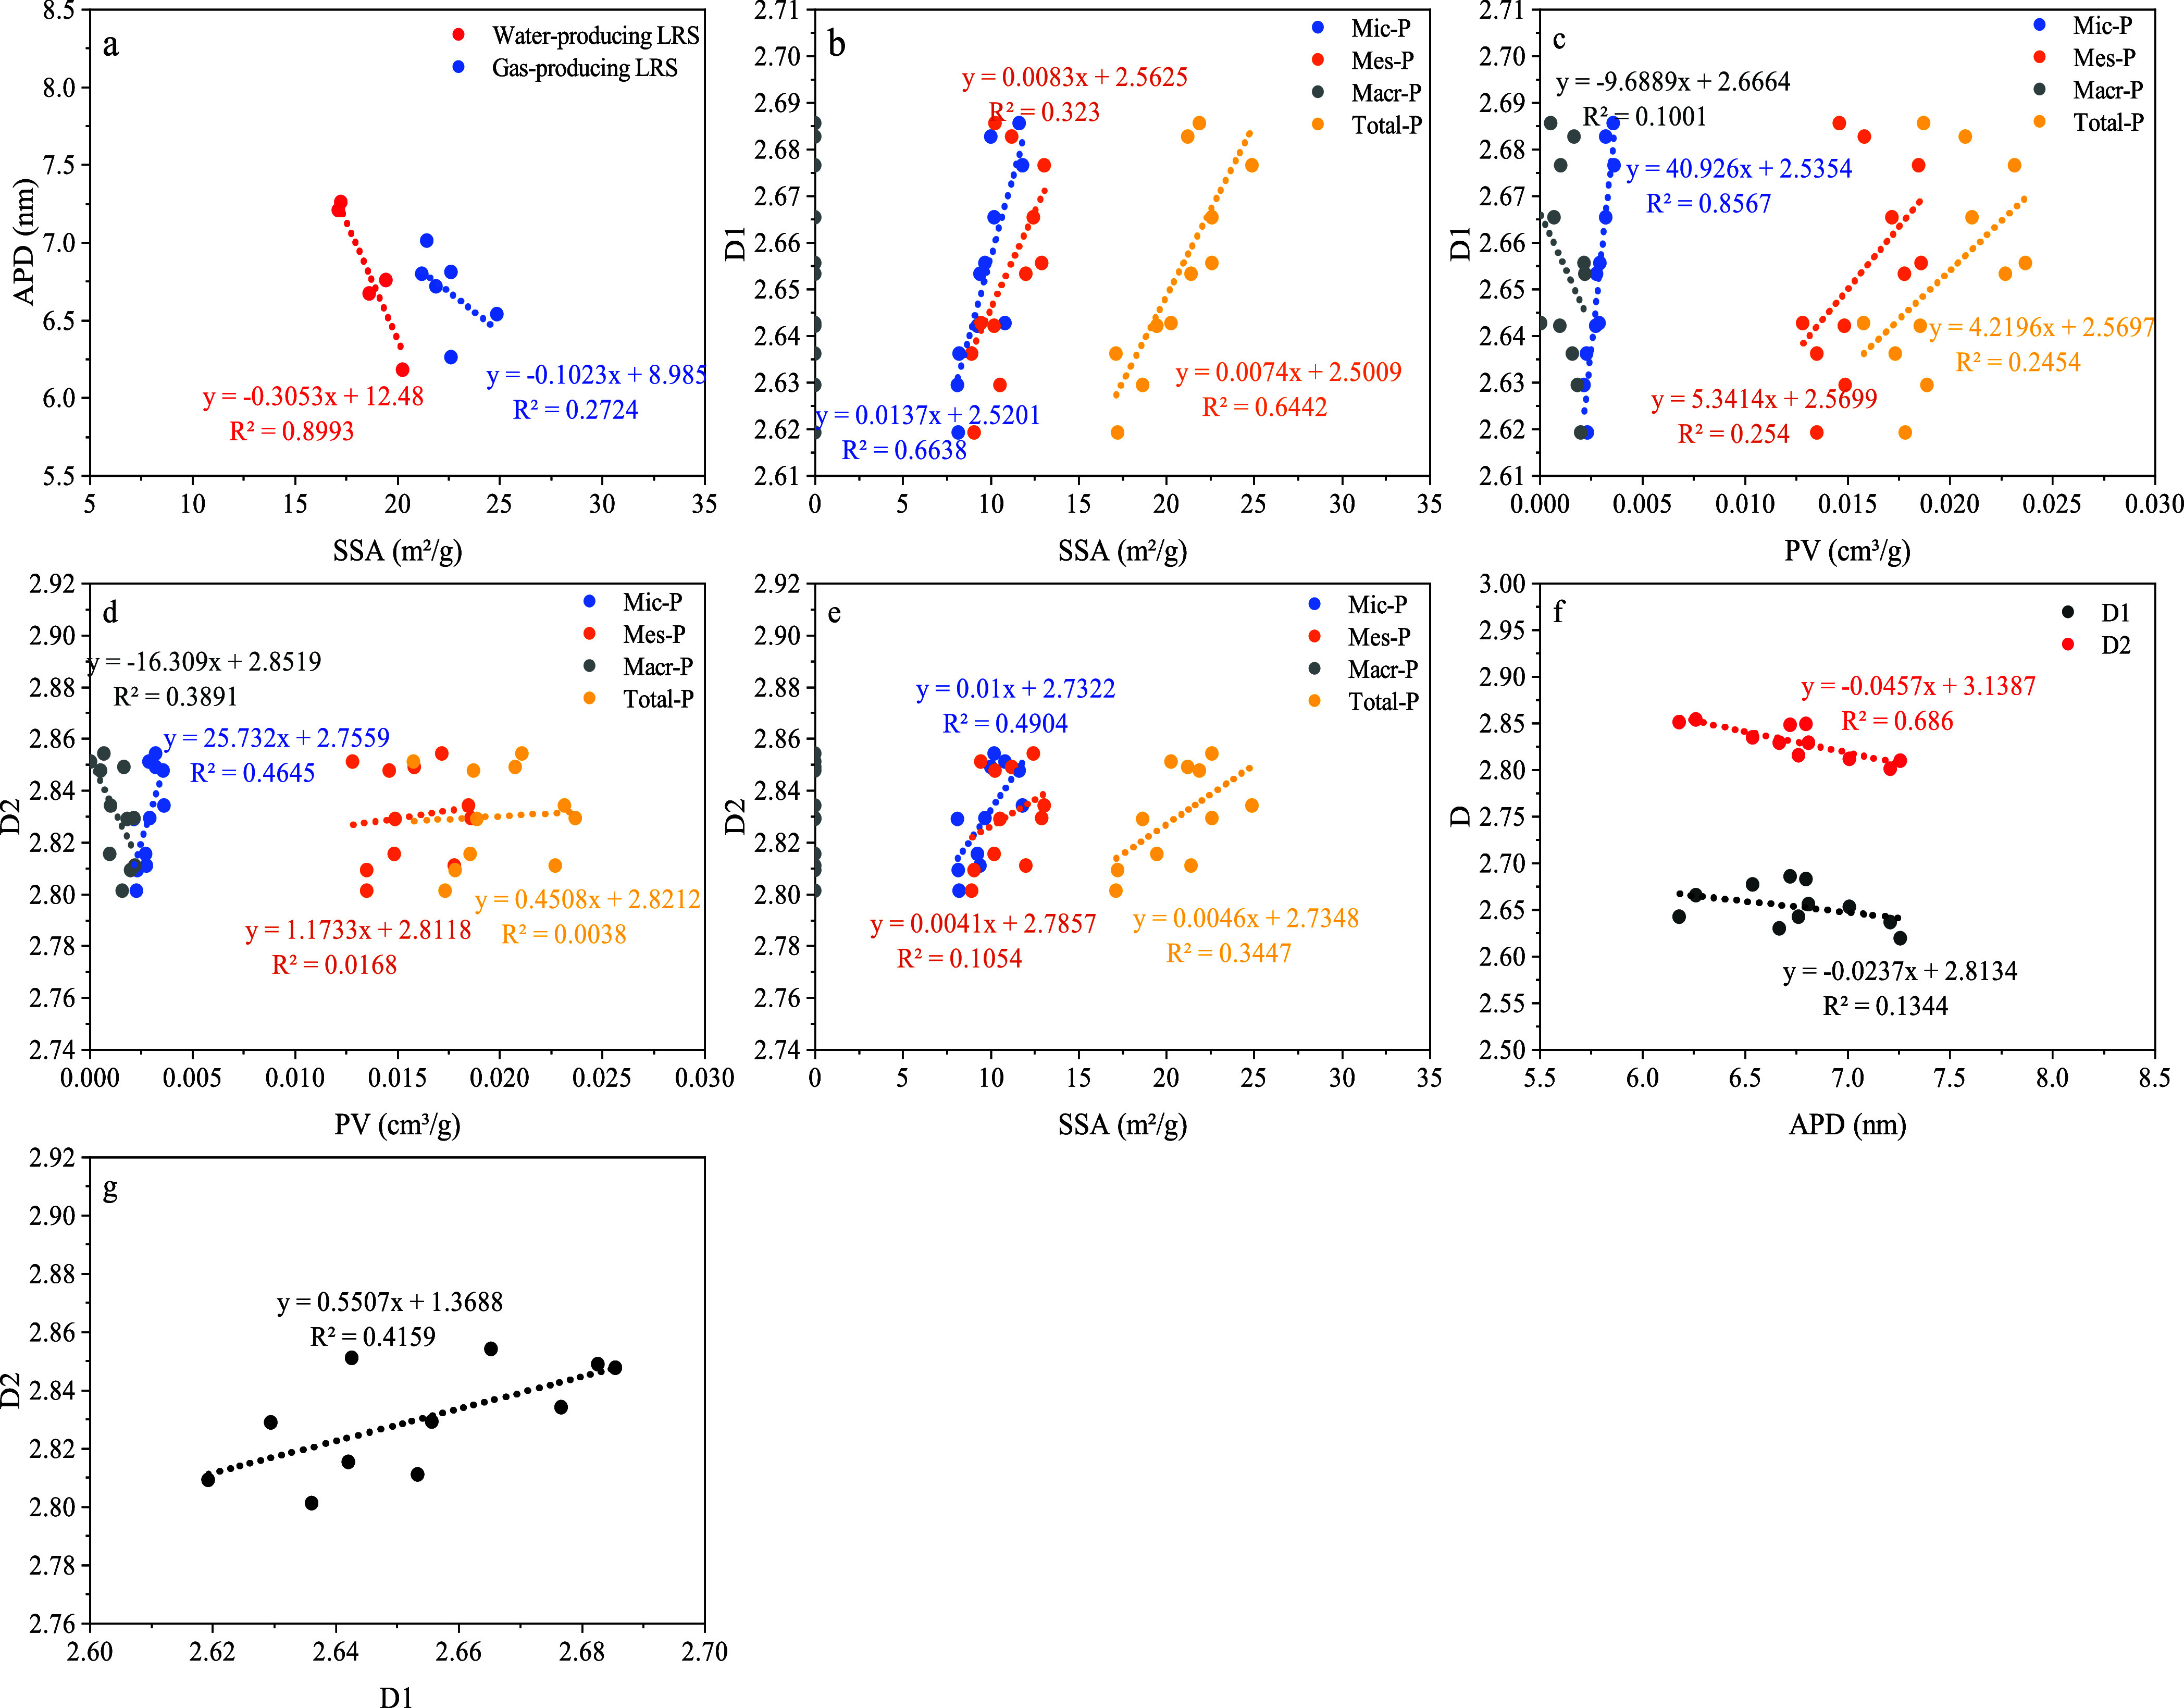
Comparison of pore structure parameters and fractal dimensions (D1 and D2). (a) Correlation between pore structure parameters, (b,c) D1 vs SSA and PV, (d,e) D2 vs SSA and PV, (f) correlation between fractal dimension and APD, and (g) D1 vs D2.
The pore size distribution of shale samples in the study area can be characterized by analyzing the number, shape, position, and area of NMR peaks.49−52 Based on the SEM images and NMR results, the pore system of low-resistivity shale is detailed in the following context: (1) In low-resistivity shale, NMR curves exhibit unimodal, bimodal, and trimodal shapes, indicating a complex pore structure with a wide pore size development. (2) The dominant right peak in the bimodal type and the middle peak in the trimodal type are distinctively developed with pores distributed between 6.4 and 46.4 nm. Most shale samples exhibit obvious protrusions at apertures of approximately 1 nm (0.7–3.3 nm), while only a few rock cores show slight fluctuations at pores above 1000 nm, indicating the presence of micropores and rare microfractures. The pore size distribution in the LRS covers micropores, mesopores, and macropores, which is consistent with gas adsorption results. It is also reported that the micropores are inferred to be OM-related.38 In SEM images of Section 4.2, the OM pores are well-developed, with rare microfractures. Hence, the NMR results are in accordance with SEM data. (3) In low-resistivity shales, the curve peaks are linked to reflect an awesome connectivity between pores, which also corroborates the SEM images. (4) The width of NMR peaks can reflect the sorting property of pores. Looking at Figure 13, it seems that the peak widths of low-resistivity shales are relatively narrow, indicating better pore sorting.
Figure 13.
NMR pore size distribution of Longmaxi Formation low-resistivity shale in Southern Sichuan.
In summary, the results obtained from NMR, gas adsorption experiments, and SEM are consistent on the whole. However, when compared with gas adsorption experiments, the pore size distribution characterized by NMR tends to be larger. This is because the drying temperature is diverse in different experimental institutions and the water molecules have difficulty entering the small pores of dense shale, leading to the signal ignorance of small pores during the process of removing base signals. Likewise, gas is more accessible to single-layer adsorption on a small pore surface than liquid. Therefore, NMR is more effective in characterizing larger pores.
5.2. Fractal Dimensions from LTNA and NMR
According to the LTNA data and FHH model, the isotherm can be divided into two segments to calculate the fractal dimension, indicating different adsorption behaviors. Specifically, when P/P0 ranges from 0 to 0.45, the adsorption occurs in a monolayer and is mainly dominated by van der Waals forces. The calculated D1 reflects the irregularity and heterogeneity of the pore surface area. During a relative high-pressure stage (0.45–1.0), D2 is calculated to characterize the complexity and connectivity of the pore structure, where multilayer adsorption appears with capillary condensation.17,53−56 As shown in Figure 14, the coefficients of all linear fitting lines are high (R2 > 0.99). D1 varies from 2.619 to 2.686 with an average of 2.638, while D2 ranges from 2.854 to 2.863, averaging 2.830 (Table 2). These fractal dimensions fall within the range of 2–3, demonstrating that both the pore structure and surface possess fractal features. Additionally, it is generally believed that the D value approaching 3 signifies a more complicated situation and stronger heterogeneity.46 In all shale samples, the fact that D2 is larger than D1 shows that the pore structure is more complex than the pore surface. The pore surface fractal dimension (D1) and pore structure fractal dimension (D2) of gas-producing LRS are both higher than those of water-producing LRS (N222), indicating that the pore structure is more complicated and the pore surface is more irregular and coarser.
Figure 14.
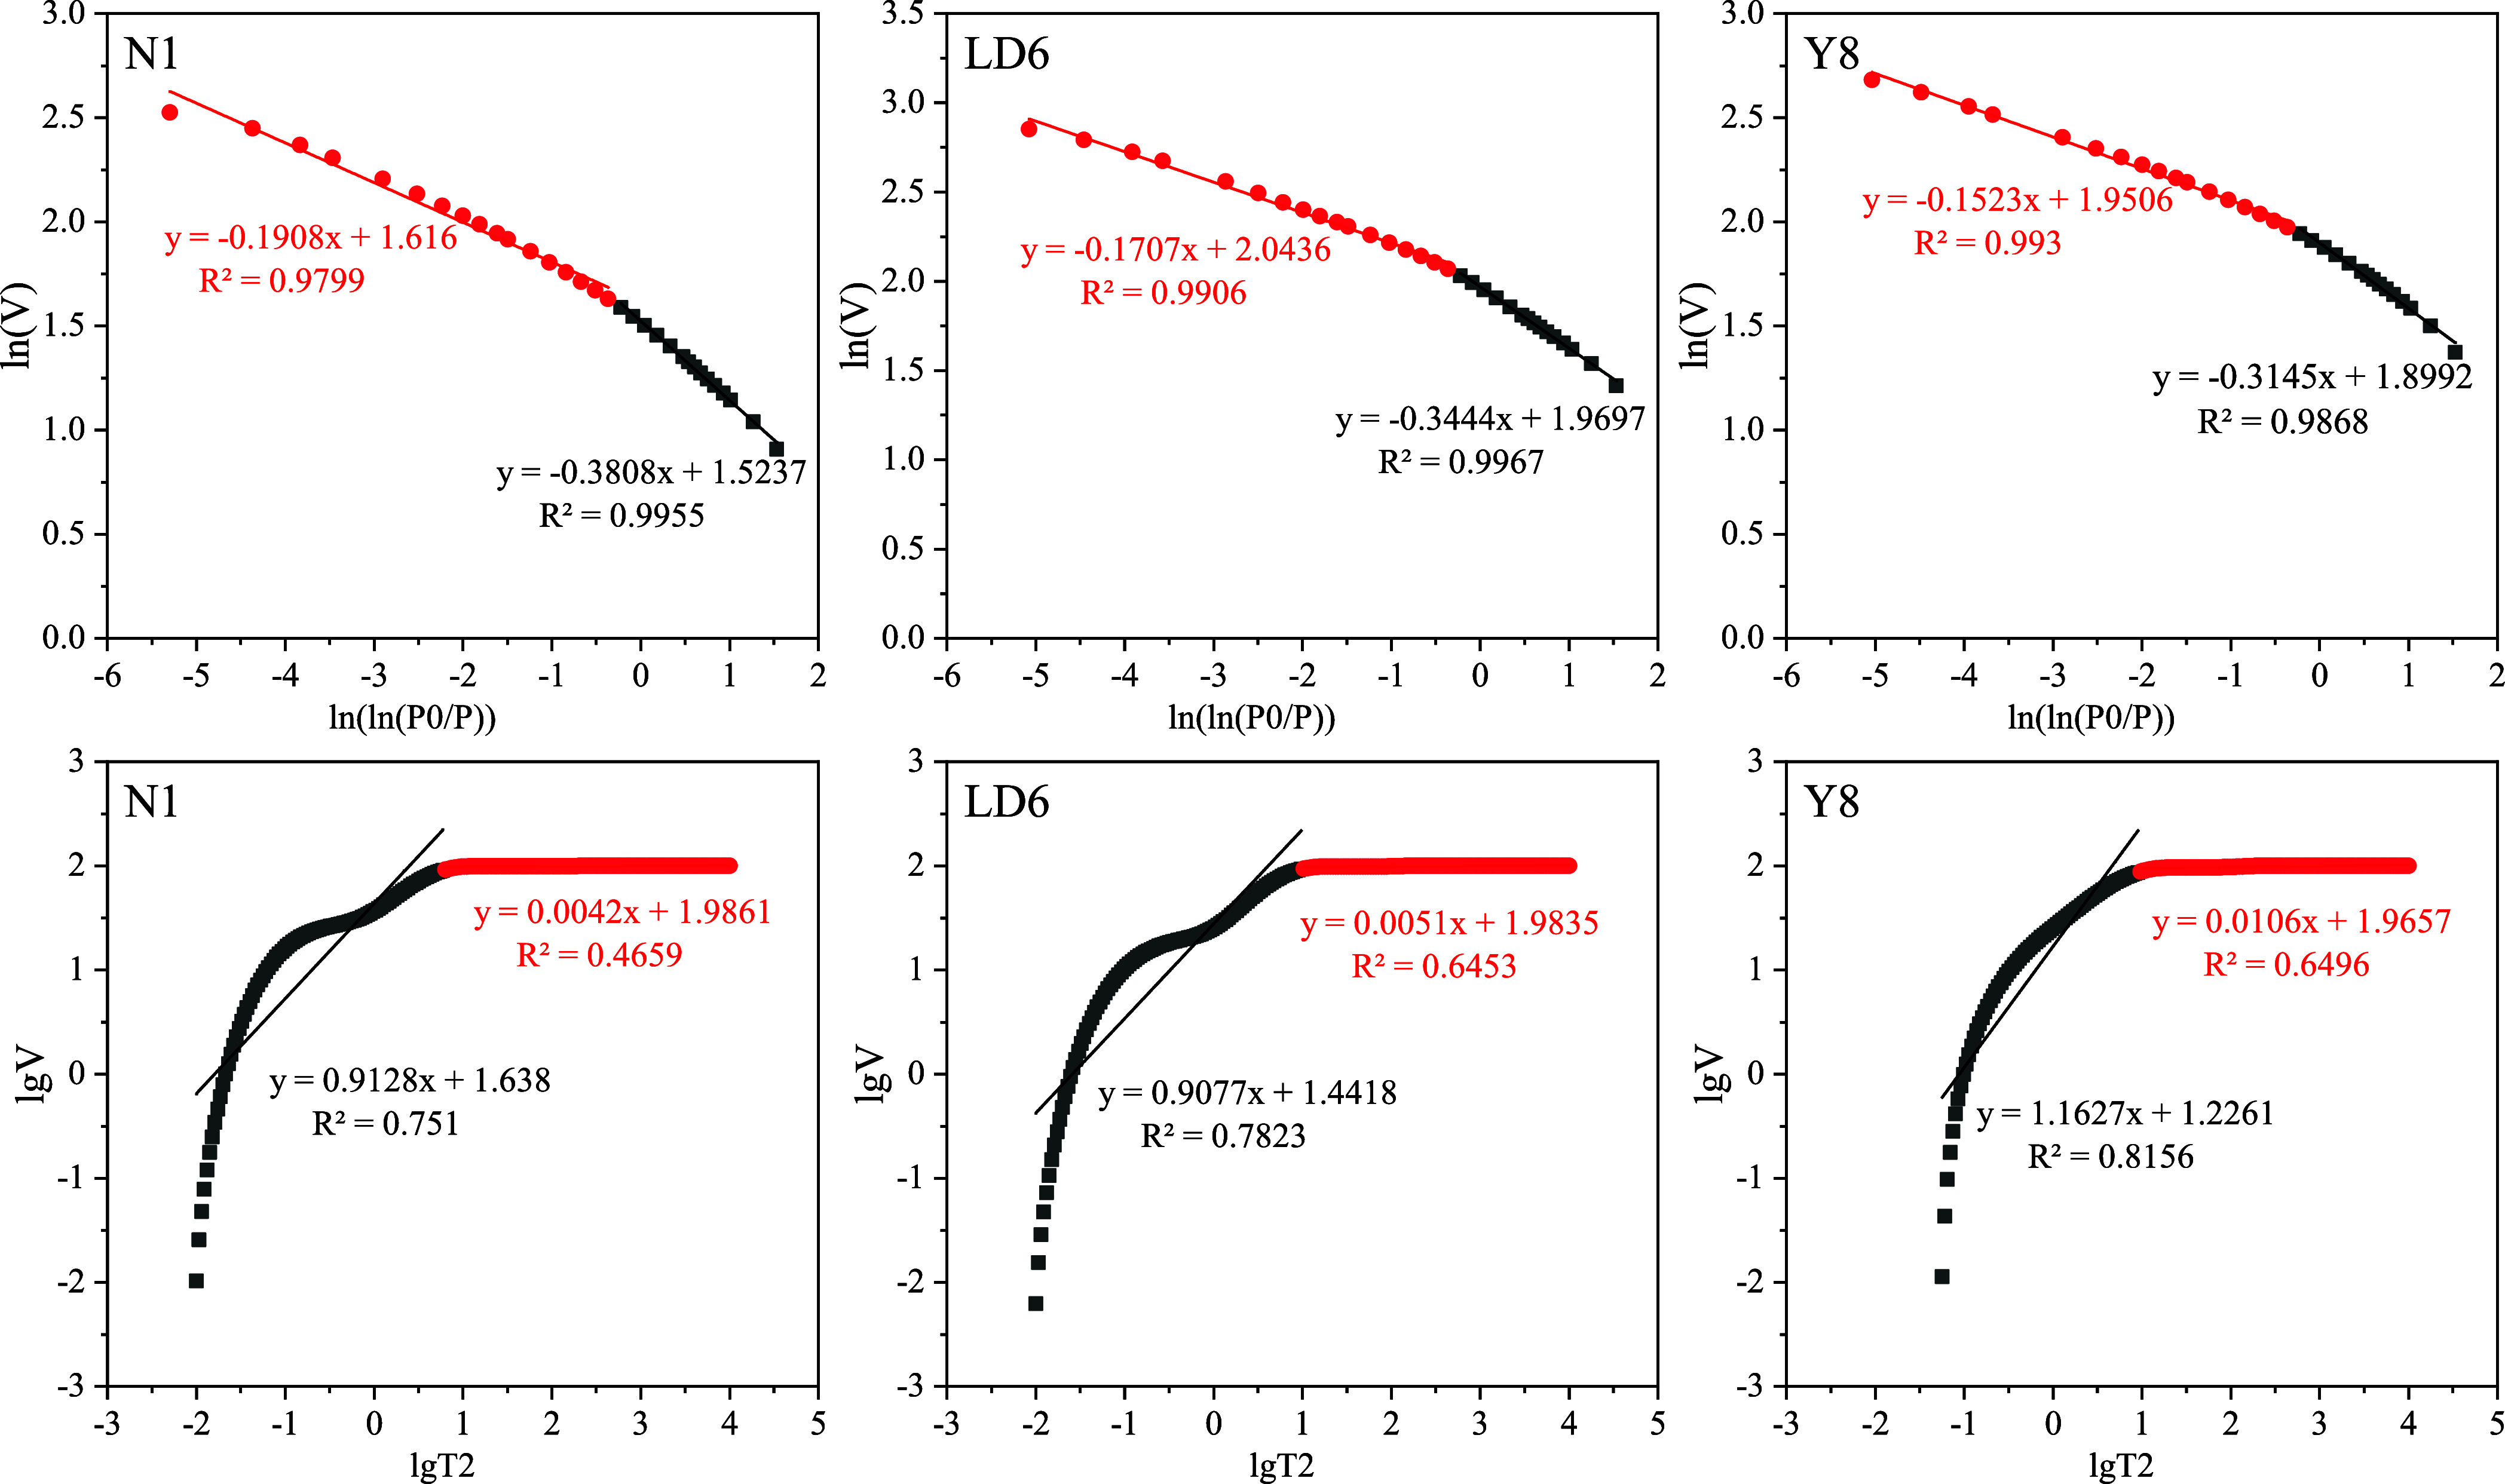
Fractal dimensions obtained from N2 adsorption curves (first row) and the NMR T2 spectrum (second row).
Table 2. Fractal Dimensions D1 and D2 from N2 Adsorption.
| sample | fitting equation | R2 | D1 | fitting equation | R2 | D2 |
|---|---|---|---|---|---|---|
| N1 | –0.3808x + 1.5237 | 0.9955 | 2.62 | –0.1908x + 1.616 | 0.9799 | 2.81 |
| N2 | –0.3639x + 1.5444 | 0.996 | 2.64 | –0.1987x + 1.6095 | 0.9949 | 2.80 |
| N3 | –0.3579x + 1.7035 | 0.995 | 2.64 | –0.1846x + 1.7752 | 0.9922 | 2.82 |
| N4 | –0.3574x + 1.6683 | 0.9906 | 2.64 | –0.1489x + 1.7624 | 0.9793 | 2.85 |
| N5 | –0.3705x + 1.683 | 0.9977 | 2.63 | –0.171x + 1.7838 | 0.9814 | 2.83 |
| LD6 | –0.3444x + 1.9697 | 0.9967 | 2.66 | –0.1707x + 2.0436 | 0.9906 | 2.83 |
| LD7 | –0.3467x + 1.8949 | 0.9964 | 2.65 | –0.1889x + 1.9492 | 0.9963 | 2.81 |
| YB7 | –0.3347x + 1.9951 | 0.994 | 2.67 | –0.1459x + 2.0765 | 0.9776 | 2.85 |
| Y6 | –0.3234x + 2.0839 | 0.9918 | 2.68 | –0.1658x + 2.1336 | 0.9954 | 2.83 |
| Y8 | –0.3145x + 1.8992 | 0.9868 | 2.69 | –0.1523x + 1.9506 | 0.993 | 2.85 |
| Y9 | –0.3173x + 1.9799 | 0.9868 | 2.68 | –0.1511x + 2.0388 | 0.9884 | 2.85 |
Fractal fitting curves (lg V vslg T2) based on NMR data are obtained using eq 5, from which the NMR fractal dimensions are calculated. As shown in Figure 14, the curves can be divided into two different segments by the T2 cutoff (T2c) after centrifugation. Among them, the fractal dimension of the linear part with a T2 value less than T2c is defined as Db, which mainly reflects the fractal features of the pore structure in the bound fluid. The fractal dimension from the linear part where T2 > T2c is defined as Dm, which pertains to movable water. Based on this fractal theory, Db in the target area is distributed in the range of 1.411–2.092 with an average of 1.938. Dm are mostly larger than 2.99 (in the range of 2.976–2.998) and approach 3, which suggests that larger pores possess a more complex pore structure (Table 3). The pore structure of the seepage space is significantly more complex than that of the adsorption space. Furthermore, both Db and Dm in gas-producing LRS are not as much as the water-producing LRS, showing that the pore structures for bound water and movable water are less complicated in gas-producing LRS. However, as the fractal dimension is generally between 2 and 3, the Db, representing small pores, is mostly less than 2 to exceed the available range, while the Dm for larger pores close to 3 fails to effectively characterize the variation in pore complexity. Accordingly, inferior to the N2 adsorption method, the NMR method is not recommended to be selected to evaluate the fractal characteristics of shale pores.
Table 3. Fractal Dimension Db and Dm from NMR.
| sample | fitting equation | R2 | Db | fitting equation | R2 | Dm |
|---|---|---|---|---|---|---|
| N1 | y = 0.9128x + 1.638 | 0.751 | 2.087 | y = 0.0042x + 1.9861 | 0.4659 | 2.996 |
| N2 | y = 0.9418x + 1.6678 | 0.7606 | 2.058 | y = 0.0034x + 1.9888 | 0.4433 | 2.997 |
| N4 | y = 0.996x + 1.6923 | 0.7764 | 2.004 | y = 0.0058x + 1.9811 | 0.5584 | 2.994 |
| N5 | y = 1.0323x + 1.7593 | 0.793 | 1.968 | y = 0.0029x + 1.9904 | 0.7888 | 2.997 |
| Y1 | y = 0.9454x + 1.6138 | 0.7516 | 2.055 | y = 0.0034x + 1.9889 | 0.786 | 2.997 |
| Y7 | y = 1.5886x + 1.9639 | 0.8537 | 1.411 | y = 0.0242x + 1.9288 | 0.4772 | 2.976 |
| Y8 | y = 1.1627x + 1.2261 | 0.8156 | 1.837 | y = 0.0106x + 1.9657 | 0.6496 | 2.989 |
| Y9 | y = 1.1768x + 1.3258 | 0.7877 | 1.823 | y = 0.007x + 1.9776 | 0.5689 | 2.993 |
| YB7 | y = 1.2124x + 2.2832 | 0.7673 | 1.788 | y = 0.0085x + 1.9748 | 0.6463 | 2.992 |
| LD6 | y = 0.9077x + 1.4418 | 0.7823 | 2.092 | y = 0.0051x + 1.9835 | 0.6453 | 2.995 |
| LD7 | y = 0.9284x + 1.5834 | 0.7768 | 2.072 | y = 0.0021x + 1.9935 | 0.3587 | 2.998 |
| LD8 | y = 1.057x + 1.6695 | 0.8098 | 1.943 | y = 0.0028x + 1.9915 | 0.471 | 2.997 |
| LD9 | y = 0.9506x + 1.6147 | 0.7807 | 2.049 | y = 0.0026x + 1.992 | 0.4691 | 2.997 |
5.3. Pore Structure Parameters and Fractal Dimensions
In this section, the pore structure parameters and fractal dimensions of LRS are analyzed to investigate the fractal features of pores in full-scale. In water-containing low-resistivity shale, APD is negatively related with the SSA, with a coefficient as high as 0.9, indicating that smaller pores are the main contributors to the SSA. However, perhaps due to the higher D1 value, this negative relationship in gas-producing LRS is extremely weak (R2 = 0.28), indicating that the pore size only slightly reflects the SSA.
As shown in Figure 15, D1 is positively correlated with the micropore SSA, total pore SSA, and micropore PV in LRS with relatively high coefficients (Figure 15b,c). When D1 is larger, the SSA and PV of micropores in LRS are more developed, which is beneficial for gas adsorption and storage. The development of micropores makes the pore surface more irregular and coarser. D2 shows a weak positive correlation with the micropore SSA, total pore SSA, and micropore PV, but a weak negative correlation with macropore PV (R2 < 0.5). This suggests that small pores enhance the complexity and heterogeneity of the pore structure, while macropores have the opposite effect (Figure 17d,e). Additionally, the negative relationship between APD and D2 (R2 = 0.62) supports the conclusion that smaller pores possess a more complex pore structure (Figure 17f). D2 and D1 are weakly negatively correlated with a coefficient of 0.42.
Figure 17.
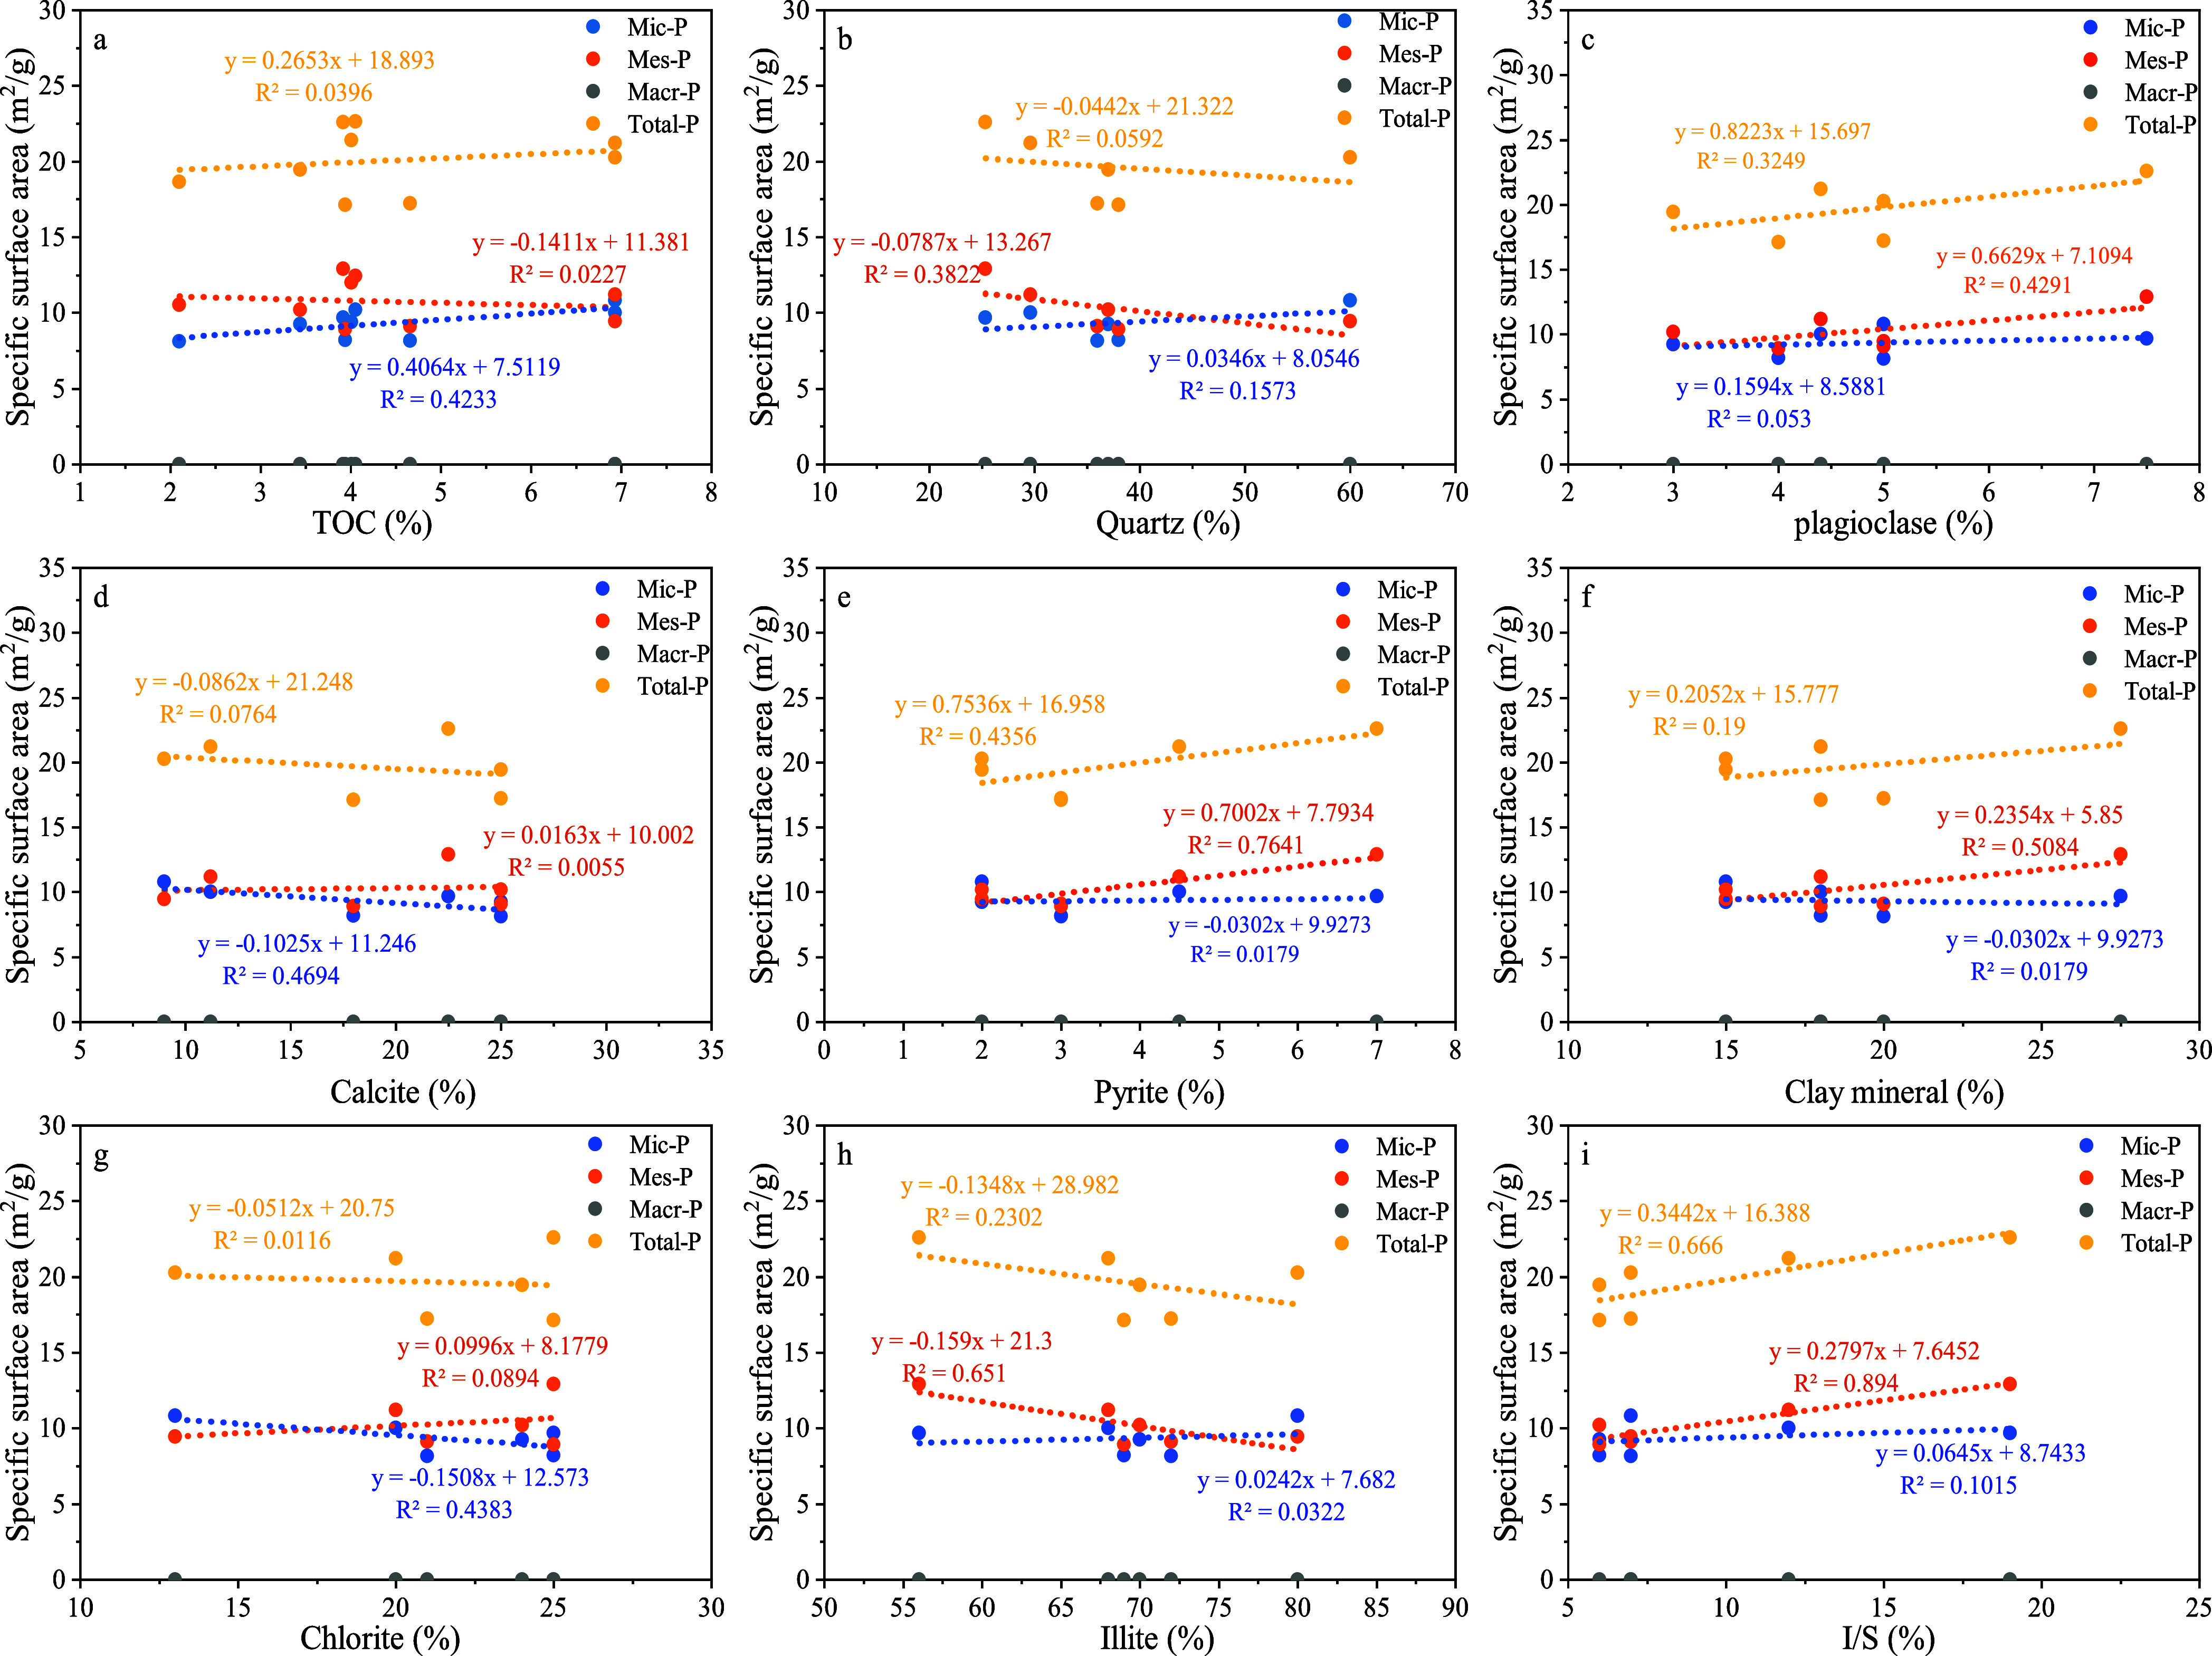
Relationship between the specific surface area and TOC and mineral composition. (a) SSA vs TOC, (b) SSA vs quartz, (c) SSA vs plagioclase, (d) SSA vs calcite, (e) SSA vs pyrite, (f) SSA vs clay mineral, (g) SSA vs chlorite, (h) SSA vs illite, and (i) SSA vs I/S.
5.4. Effects of Composition on Pore Structure and Fractal Dimensions
The pore volume and surface area of low-resistivity shales were plotted against the mineral composition and TOC in Figures 16 and 17. As shown in Figures 16a and 17a, the TOC is only weakly positively correlated with the SSA and PV of micropores, exhibiting a slight growth trend. This suggests that TOC contributes to the development of micropores to some extent. During thermal evolution, acid fluids are released from organic matter to generate significant quantities of nanopores, which coincides with the developed OM pores in SEM images. TOC can enhance the potential for gas production and storage by affecting the pore structure, while the pore structure parameters are not affected by Ro.
Figure 16.
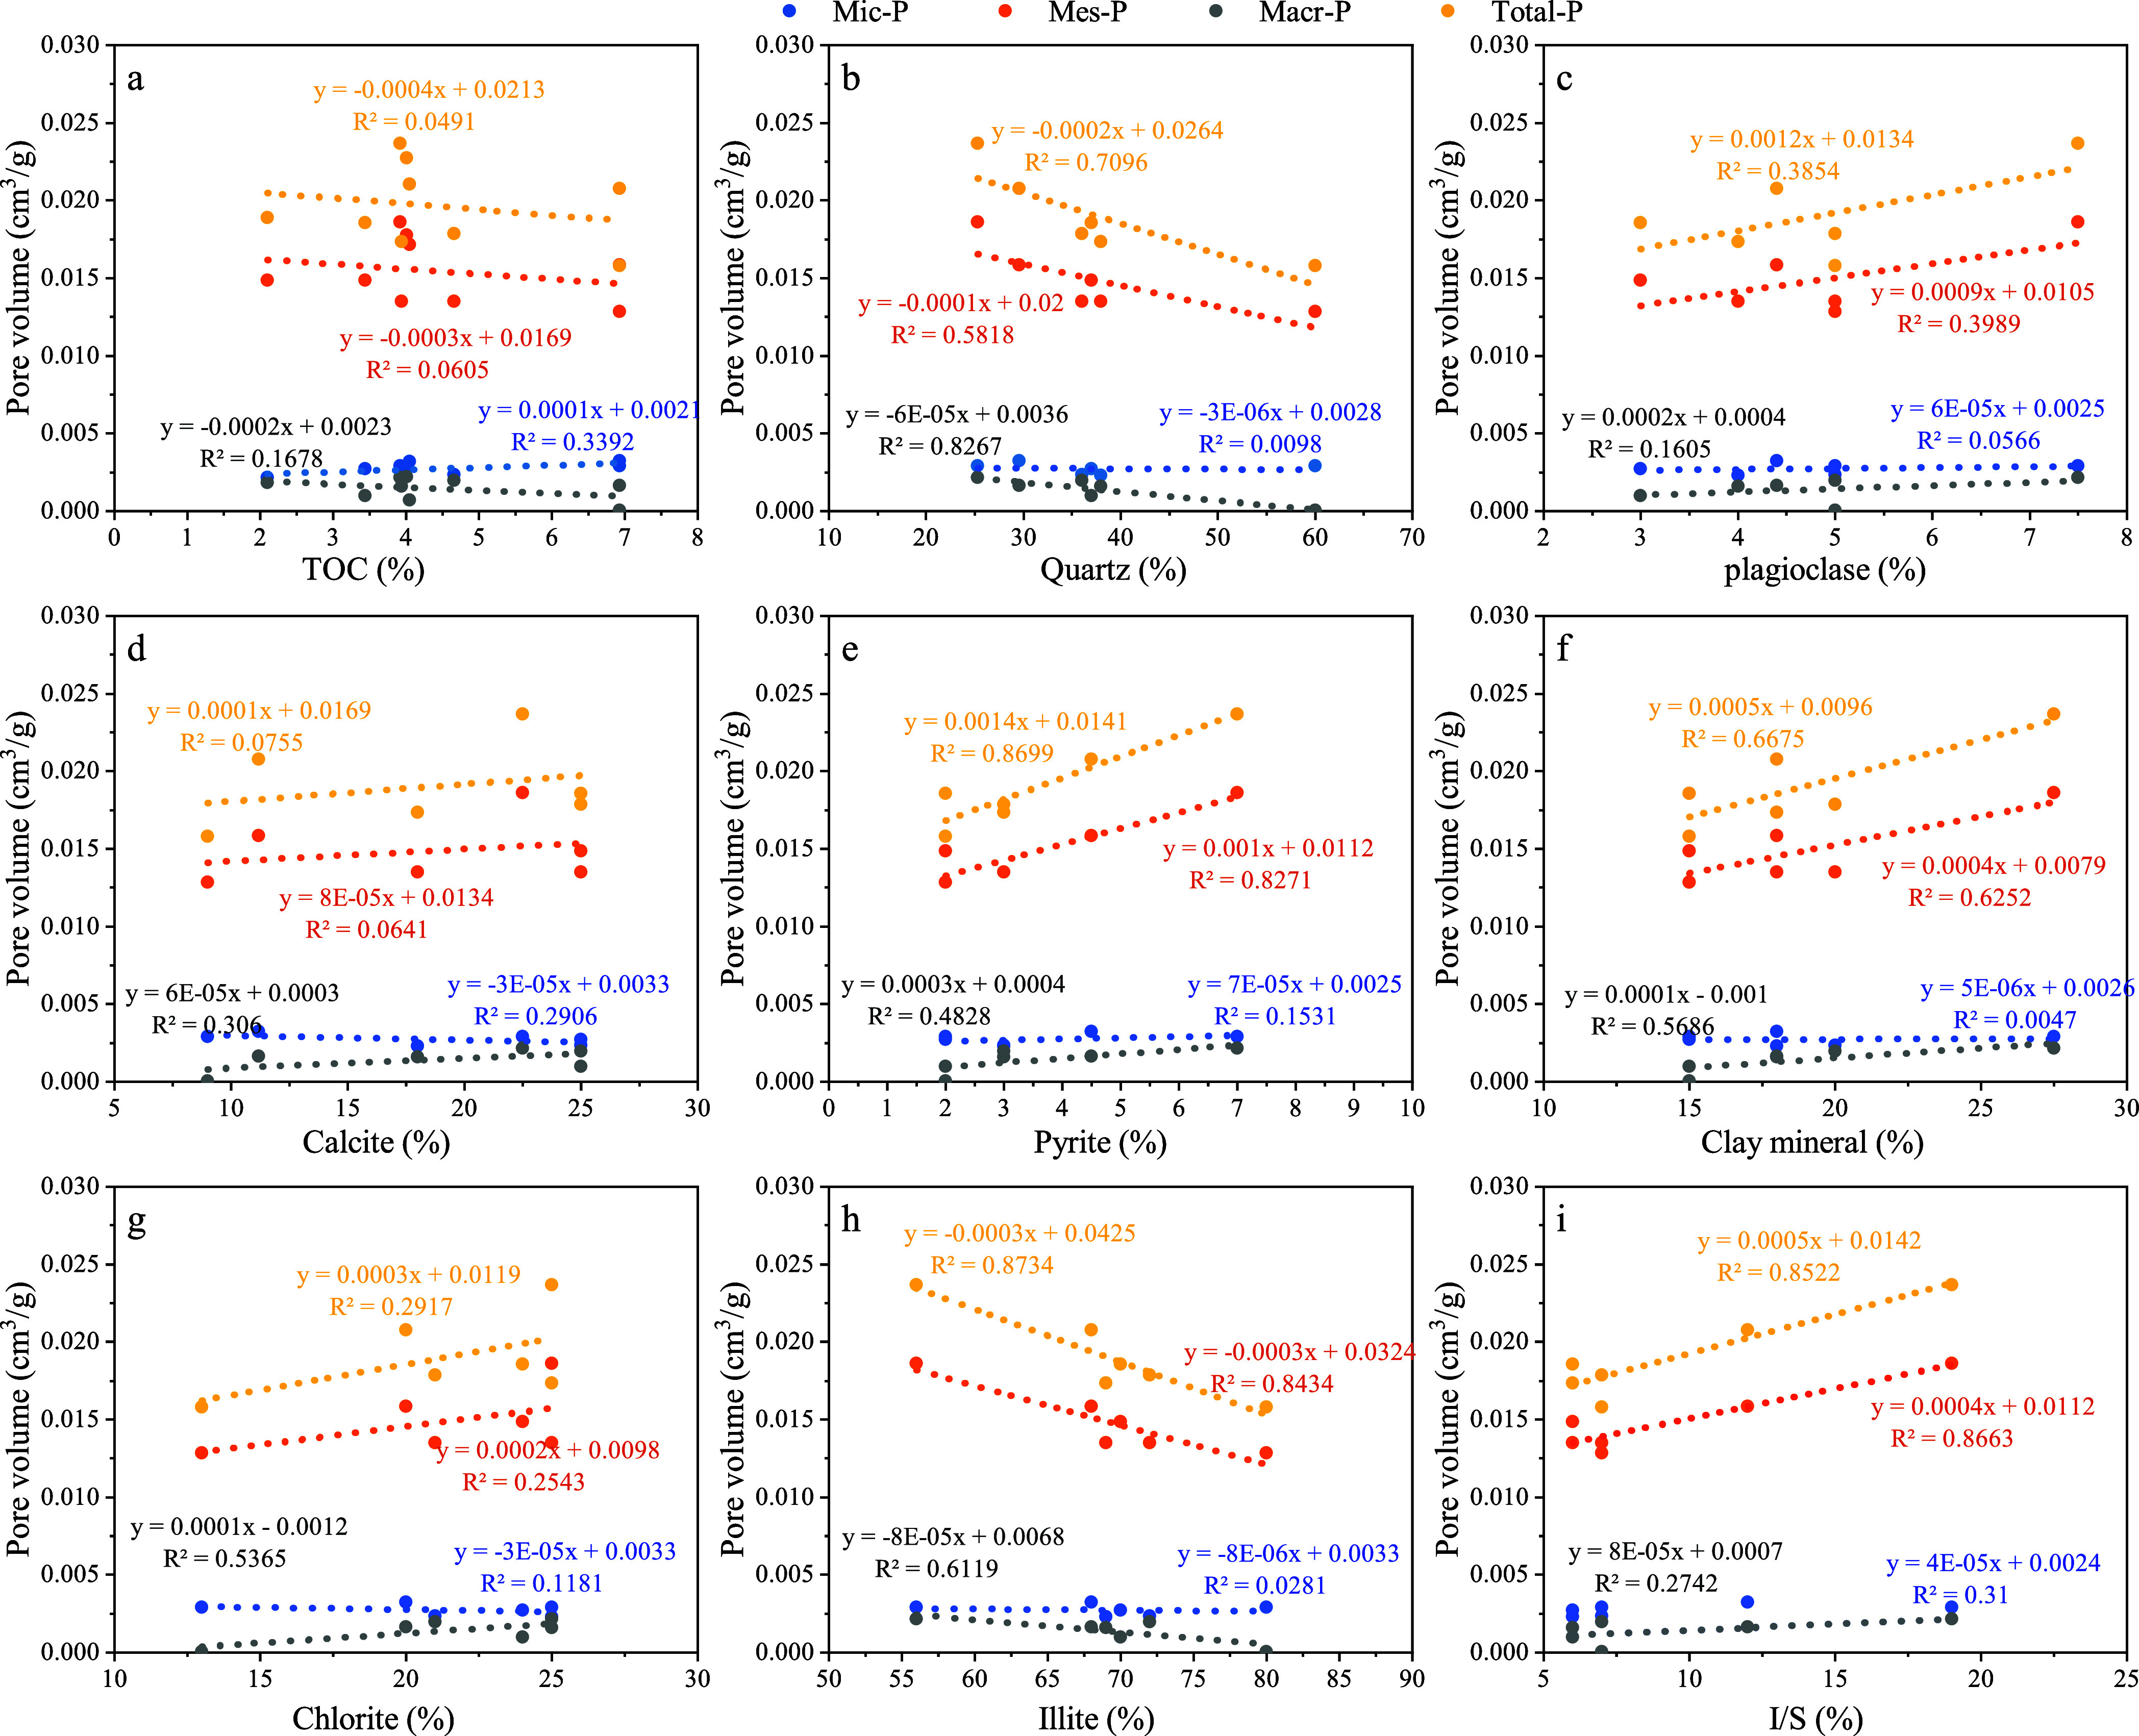
Relationship between the pore volume and TOC and mineral composition. (a) PV vs TOC, (b) PV vs quartz, (c) PV vs plagioclase, (d) PV vs calcite, (e) PV vs pyrite, (f) PV vs clay mineral, (g) PV vs chlorite, (h) PV vs illite, and (i) PV vs I/S.
Apart from the TOC content, the pore structure is also related to the content of mineral composition, which mainly consists of quartz, carbonate, and clay minerals. As shown in Figures 16 and 17, quartz is negatively correlated with the PV of mesopores, macropores, and total pores with relatively high coefficients (0.58, 0.83, and 0.71). It is also weakly negatively correlated with the mesopore SSA (R2 = 0.38), indicating that quartz hinders the development of large pores. During diagenesis, quartz grains gradually grow to partially block some pore space, leading to the decrease in pores.49,50 Plagioclase shows a weak positive correlation with the PV and SSA of the mesopores and total pores. Calcite is weakly negatively related to the PV and SSA of micropores, and dolomite shows no significant relationship with pore structure parameters, which means a negligible contribution to the pore structure. Therefore, brittle minerals can inhibit pore development in LRS, where quartz plays a more important role.
In view of clay minerals, positive correlations are observed between the clay content and mesopore PV (R2 = 0.63), total pore PV (R2 = 0.67), and total pore SSA (R2 = 0.21), which is favored by previous studies as well.11,47 The clay content in low-resistivity shale is generally below 45%, as such pores in clay can be protected by stronger molecular forces to resist overburden pressures, triggering to weak compaction effects.12 Although the pyrite content is low, it shows positive correlations with the PV and SSA of mesopores (R2 = 0.83 and 0.76) and total pores (R2 = 0.87 and 0.44). This suggests that layered pyrite, as seen in SEM images, can protect its intercrystalline pores and clay interlayer pores from compaction and diagenesis.
Illite, chlorite, and I/S are the most abundant clay minerals in low-resistivity shale. Illite is negatively correlated with the mesopore PV (R2 = 0.84), macropore PV (R2 = 0.87), total pore PV (R2 = 0.61), and mesopore SSA (R2 = 0.65), indicating that illite inhibits the development of large pores. This is due to the fact that illite is the final product of smectite dehydration conversion, where the original large pores are compacted by high overburden pressure and filled by illite.57 I/S is positively correlated to the PV and SSA of mesopores and total pores. Specifically, I/S is an intermediate mineral formed during the transformation from smectite to illite. In this process, the interlayer water of smectite flows out into shale pores as free water continuously. If the water is not expelled in time, then the formation pore pressure will be abnormally high, resisting the compaction effect and preserving the original pores.58
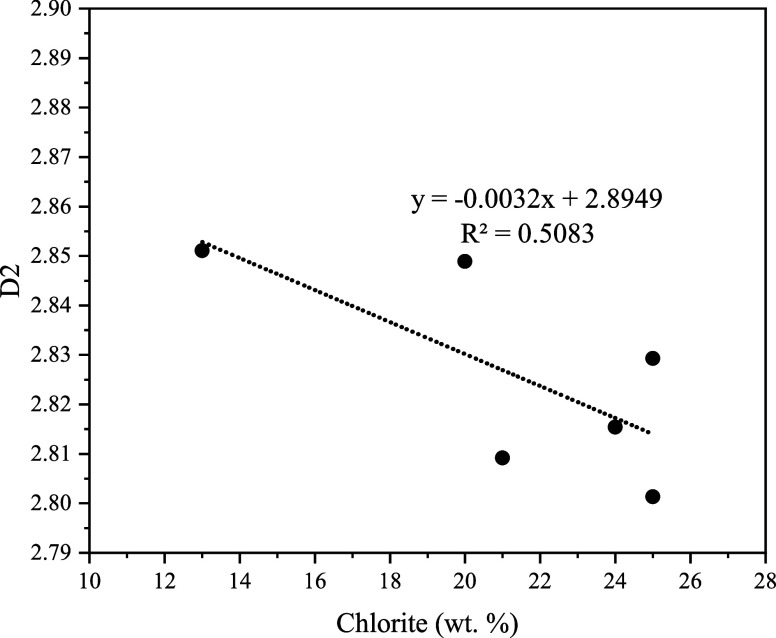
In low-resistivity shale, there is no obvious correlation between the fractal dimension and mineral composition or TOC, except for chlorite (Figure 18). Chlorite is weakly positively correlated with the large pore PV and negatively correlated with the micropore SSA, though the varying trend is slight. As the chlorite content increases, D2 decreases, indicating a less complex pore structure and better connectivity. It is reasonable that the developed large pore volumes and decreased micropore surface area lead to a more regular pore structure. During burial diagenesis, various minerals, including smectite, illite, and kaolinite, may undergo chloritization.59,60 Some scholars proposed that grain-coating chlorite in sandstone reservoirs inhibits quartz cementation.61−65 Chlorite prevents nucleation of authigenic quartz by separating pore water from the quartz surface, which restrains the growth of authigenic quartz in place where chlorite cementation occurs. Likewise, it can be predicated from the negative correlation that there exist some mesopores or macropores in chlorite to increase pore space, leading to a decreasing D2 with increasing chlorite. Hence, increasing the chlorite content enhances the PV of large pores and the SSA of micropores, improving the irregularity and heterogeneity of LRS.
Figure 18.
Correlation between fractal dimension D2 and chlorite in LRS.
6. Conclusions
-
(1)
The qualitative images obtained from SEM suggest that LRS is characterized by developed OM pores, clay mineral interlayer pores, and intercrystalline pyrite pores with large size and better connectivity. The clay mineral and pyrite in LRS are widely distributed in layers and mutually contacted. Hence, the layered mineral distribution and connective large pores can build a complex and superior conductive network in low-resistivity shale.
-
(2)
Based on the gas adsorption experiment, the gas-producing LRS has larger PV and SSA than water-producing LRS. The pore volume is primarily contributed by mesopores, and the major peaks are in sizes of 2–4, 10–30, and 40–50 nm, where 2–4 nm contributes the most. The specific surface area of LRS is mainly controlled by mesopores of 2–4 nm size and micropores of 0.5–0.7 nm. The pore structure characterized through NMR, gas adsorption experiments, and SEM is consistent overall, although NMR is more effective for characterizing larger pores than gas adsorption.
-
(3)
Fractal dimension analysis from gas adsorption data shows that gas-producing LRS has a more irregular pore surface and a more complicated pore structure than water-producing LRS. D2 is generally larger than D1 and has a weakly negative relationship. The NMR method is unsuitable for evaluating the fractal characteristics of shale pores. Additionally, the development of micropores corresponds to higher D1 and D2, indicating that the pore surface and structure are more irregular and complicated.
-
(4)
TOC contributes to micropore development to some extent. Quartz and illite are negatively correlated with the PV and SSA of mesopores and total pores, while pyrite, clay mineral, and I/S are converse with a positive relationship. In addition, chlorite is weakly positively correlated with the PV of large pores and negatively correlated with the micropore SSA in a slightly varying trend. As the chlorite content increases, D2 decreases, indicating a less complex pore structure and better connectivity.
Acknowledgments
This research is supported by the China Postdoctoral Science Foundation (grant no. 2023M730593) and the Cooperation Technology Projects of PetroChina Research Institute of Petroleum Exploration and Development (43230054). We would like to thank all the editors and reviewers for their constructive comments.
The authors declare no competing financial interest.
References
- Chen S.; Zhu Y.; Wang H.; Liu H.; Wei W.; Fang J. Shale gas reservoir characterisation: a typical case in the southern Sichuan Basin of China. Energy 2011, 36, 6609–6616. 10.1016/j.energy.2011.09.001. [DOI] [Google Scholar]
- Ma Y. S.; Cai X. Y.; Zhao P. R. China’s shale gas exploration and development: Understanding and practice. Pet. Explor. Dev. 2018, 45 (4), 589–603. 10.1016/S1876-3804(18)30065-X. [DOI] [Google Scholar]
- Clarkson C. R.; Solano N.; Bustin R. M.; Bustin A. M. M.; Chalmers G. R. L.; He L.; Melnichenko Y. B.; Radliński A. P.; Blach T. P. Pore structure characterization of North American shale gas reservoirs using USANS/SANS, gas adsorption, and mercury intrusion. Fuel 2013, 103, 606–616. 10.1016/j.fuel.2012.06.119. [DOI] [Google Scholar]
- Liu X.; Lai J.; Fan X.; Shu H.; Wang G.; Ma X.; Liu M.; Guan M.; Luo Y. Insights in the pore structure, fluid mobility and oiliness in oil shales of Paleogene Funing Formation in Subei Basin. China. Mar. Pet. Geol. 2020, 114, 104228 10.1016/j.marpetgeo.2020.104228. [DOI] [Google Scholar]
- Zhang J. Z.; Tang Y. J.; He D. X.; Sun P.; Zou X. Y. Full-scale nanopore system and fractal characteristics of clay-rich lacustrine shale combining FE-SEM, nano-CT, gas adsorption and mercury intrusion porosimetry. Applied Clay Science. 2020, 196 (2020), 105758 10.1016/j.clay.2020.105758. [DOI] [Google Scholar]
- Physical chemistry division commission on colloid and surface chemistry, subcommittee on characterization of porous solids: recommendations for the characterization of porous solids (technical report). Pure Appl. Chem. 1994, 66, 1739–1758. [Google Scholar]
- Li Y.; Wang Z. S.; Pan Z. J.; Niu X.; Yu Y.; Meng S. Pore Structure and Its Fractal Dimensions of Transitional Shale: A Cross-Section from East Margin of the Ordos Basin, China. Fuel 2019, 241, 417–431. 10.1016/j.fuel.2018.12.066. [DOI] [Google Scholar]
- Zhang J.; Li X.; Xiaoyan Z.; Zhao G.; Zhou B.; Li J.; Xie Z.; Wang F. Characterization of the full-sized pore structure of coal-bearing shales and its effect on shale gas content. Energy Fuel. 2019, 33, 1969–1982. 10.1021/acs.energyfuels.8b04135. [DOI] [Google Scholar]
- Wang H. J.; Wu W.; Chen T.; Yu J.; Pan J. Pore Structure and Fractal Analysis of Shale Oil Reservoirs: A Case Study of the Paleogene Shahejie Formation in the Dongying Depression, Bohai Bay, China. J. Pet. Sci. Eng. 2019, 177, 711–723. 10.1016/j.petrol.2019.02.081. [DOI] [Google Scholar]
- Ma X.; Guo S. B.; Shi D. S.; Zhou Z.; Liu G. H. Investigation of pore structure and fractal characteristics of marine-continental transitional shales from Longtan Formation using MICP, gas adsorption, and NMR (Guizhou, China). Marine and Petroleum Geology. 2019, 107 (2019), 555–571. 10.1016/j.marpetgeo.2019.05.018. [DOI] [Google Scholar]
- Wang G. P.; Zhang Q.; Zhu R. K.; Tang X.; Liu K. Q.; Jin Z. J. Geological controls on the pore system of lacustrine unconventional shale reservoirs: The Triassic Chang 7 member in the Ordos Basin, China. Journal of Petroleum Science and Engineering. 2023, 221 (2023), 111139 10.1016/j.petrol.2022.111139. [DOI] [Google Scholar]
- Xue Z. X.; Jiang Z. X.; Wang X.; Gao Z. Y.; Chang J. Q.; Nie Z.; Li H.; Wu W.; Qiu H. Y.; Wang Q. Y.; Hao M. Z.; Chen R. H.; Liang Z. K. Genetic mechanism of low resistivity in high-mature marine shale: Insights from the study on pore structure and organic matter graphitization. Marine and Petroleum Geology. 2022, 144, 105825 10.1016/j.marpetgeo.2022.105825. [DOI] [Google Scholar]
- Zhang Q.; Zhao Q.; Luo C.; Liang F.; Zhou S.; Wang Y.; Lu B.; Qiu Z.; Liu H.; Liu W. Effect of graphitization of organic matter on shale gas reservoirs: Take the marine shales in the southern Sichuan Basin as examples. Nat. Gas Ind. 2022, 42 (10), 25–36. [Google Scholar]
- Adão F.; Ritter O.; Spangenberg E. The electrical conductivity of Posidonia black shales—from magnetotelluric exploration to rock samples. Geophysical Prospecting 2016, 64 (2), 469–488. 10.1111/1365-2478.12288. [DOI] [Google Scholar]
- Zhang J. Z.; Li X. Q.; Wei Q.; Sun K. X.; Zhang G. W.; Wang F. Y. Characterization of full-sized pore structure and fractal characteristics of marine–continental transitional Longtan formation Shale of Sichuan Basin, South China. Energy Fuel. 2017, 31 (10), 10490–10504. 10.1021/acs.energyfuels.7b01456. [DOI] [Google Scholar]
- Klaver J.; Hemes S.; Houben M.; Desbois G.; Radi Z.; Urai J. L. The connectivity of pore space in mudstones: insights from high-pressure Wood’s metal injection, BIB–SEM imaging, and mercury intrusion porosimetry. Geofluids 2015, 15 (4), 577–591. 10.1111/gfl.12128. [DOI] [Google Scholar]
- Mishra S.; Mendhe V. A.; Varma A. K.; Kamble A. D.; Sharma S.; Bannerjee M.; Kalpana M. S. Influence of organic and inorganic content on fractal dimensions of Barakar and Barren Measures shale gas reservoirs of Raniganj basin, India. J. Nat. Gas Sci. Eng. 2018, 49, 393–409. 10.1016/j.jngse.2017.11.028. [DOI] [Google Scholar]
- Sakhaee-Pour A.; Li W. Fratal dimensions of shale. J. Nat. Gas Sci. Eng. 2016, 30, 578–582. 10.1016/j.jngse.2016.02.044. [DOI] [Google Scholar]
- Zhang J. Z.; Li X. Q.; Zhang G. W.; Zou X. Y.; Wang F. Y.; Tang Y. J. Microstructural investigation of different nanopore types in marinecontinental transitional shales: examples from the Longtan formation in Southern Sichuan Basin, South China. Mar. Pet. Geol. 2019, 110, 912–927. 10.1016/j.marpetgeo.2019.09.001. [DOI] [Google Scholar]
- Ma X. H.; Wang H. Y.; Zhou S. W.; Shi Z. S.; Zhang L. F. Deep shale gas in China: Geological characteristics and development strategies. Energy Reports. 2021, 7, 1903–1914. 10.1016/j.egyr.2021.03.043. [DOI] [Google Scholar]
- Yuan G.; Sun Y.; Gao W.; Shi X.; Wang Y. Development status of the shale gas geophysical prospecting technology. Geol. Explor. 2013, 49 (5), 945–950. [Google Scholar]
- Shaoul J.; Van Zelm L.; De Pater C. J. Damage mechanisms in unconventional-gas-well stimulation—A new look at an old problem. SPE Prod. Oper. 2011, 26 (04), 388–400. 10.2118/142479-PA. [DOI] [Google Scholar]
- Wang X. M.; Liu L. F.; Wang Y.; Sheng Y.; Zheng S. S.; Wu W. W.; Luo Z. H. Comparison of the pore structures of Lower Silurian Longmaxi Formation shales with different lithofacies in the southern Sichuan Basin, China. Journal of Natural Gas Science and Engineering 2020, 81, 103419 10.1016/j.jngse.2020.103419. [DOI] [Google Scholar]
- Liu K.; Ostadhassan M. Multi-scale fractal analysis of pores in shale rocks. J. Appl. Geophys. 2017, 140, 1–10. 10.1016/j.jappgeo.2017.02.028. [DOI] [Google Scholar]
- Cai Y.; Liu D.; Pan Z.; Yao Y.; Li J.; Qiu Y. Pore structure and its impact on CH4 adsorption capacity and flow capability of bituminous and subbituminous coals from Northeast China.. Fuel 2013, 103, 258–268. 10.1016/j.fuel.2012.06.055. [DOI] [Google Scholar]
- Tang J. W.; Feng L.; Li Y. J.; Liu J.; Liu X. C. Fractal and pore structure analysis of Shengli lignite during drying process. Powder Technol. 2016, 303, 251–259. 10.1016/j.powtec.2016.09.042. [DOI] [Google Scholar]
- Li W.; Lu S.; Xue H.; Zhang P.; Hu Y. Microscopic pore structure in shale reservoir in the argillaceous dolomite from the Jianghan basin. Fuel 2016, 181, 1041–1049. 10.1016/j.fuel.2016.04.140. [DOI] [Google Scholar]
- Mendhe V. A.; Bannerjee M.; Varma A. K.; Kamble A. D.; Mishra S.; Singh B. D. Fractal and pore dispositions of coal seams with significance to coalbed methane plays of East Bokaro, Jharkhand, India. J. Nat. Gas. Sci. Eng. 2017, 38, 412–433. 10.1016/j.jngse.2016.12.020. [DOI] [Google Scholar]
- Shan C. A.; Zhang T. S.; Liang X.; Zhang Z.; Wang M.; Zhang K.; Zhu H. H. On the fundamental difference of adsorption-pores systems between vitrinite- and inertinite-rich anthracite derived from the southern Sichuan basin, China. J. Nat. Gas Sci. Eng. 2018, 53, 32–44. 10.1016/j.jngse.2018.02.025. [DOI] [Google Scholar]
- Ismail I.; Pfeifer P. Fractal analysis and surface roughness of nonporous carbon fibers and carbon blacks. Langmuir 1994, 10 (5), 1532–1538. 10.1021/la00017a035. [DOI] [Google Scholar]
- Sun W. J. B.; Zuo Y. J.; Wu Z. H.; Liu H.; Xi S. J.; Shui Y.; Wang J.; Liu R. B.; Lin J. Y. Fractal analysis of pores and the pore structure of the Lower Cambrian Niutitang shale in northern Guizhou province: Investigations using NMR, SEM and image analyses. Marine and Petroleum Geology. 2019, 99, 416–428. 10.1016/j.marpetgeo.2018.10.042. [DOI] [Google Scholar]
- Ali Akbar M. N., Musu J. T.. Rock Typing and Shale Quality Index Methods Based on Conventional Log: A Case Study for Organic-Rich Shale in the North Sumatra Basin. In SPWLA 23rd Formation Evaluation Symposium of Japan; OnePetro: 2017. [Google Scholar]
- Loucks R. G.; Reed R. M.; Ruppel S. C.; Hammes U. Spectrum of pore types and networks in mudrocks and a descriptive classification for matrix-related mudrock pores. AAPG Bull. 2012, 96 (6), 1071–1098. 10.1306/08171111061. [DOI] [Google Scholar]
- Surdam R. C.; Crossey L. J.; Hagen E. S.; Heasler H. P. Organic-inorganic interactions and sandstone diagenesis. AAPG Bull. 1989, 73 (1), 1–23. 10.1306/703C9AD7-1707-11D7-8645000102C1865D. [DOI] [Google Scholar]
- Jianqing L.; Xingyun L.; Bingsong Y.; Xiaolin C.; Cheng S. The current situation and developing tendency of the study on diagenesis. Pet. Geol. Exp. 2006, 28 (1), 65–72. 10.11781/sysydz200601065. [DOI] [Google Scholar]
- Wang Y.; Wang S.; Dong D.; Li X.; Huang J.; Zhang C.; Guan Q. Lithofacies characterization of Longmaxi Formation of the Lower Silurian, southern Sichuan. Earth Sci. Front. 2016, 23 (1), 119–133. 10.13745/j.esf.2016.01.011. [DOI] [Google Scholar]
- Chao L.; Zaixing J.; Yiting Y.; Xiaojie W. Characteristics of shale lithofacies and reservoir space of the Wufeng-Longmaxi Formation, Sichuan Basin. Pet. Explor. Dev. 2012, 39 (6), 691–698. 10.1016/S1876-3804(12)60098-6. [DOI] [Google Scholar]
- Li Y. R.; Liu X. G.; Cai C. H.; Hu Z. M.; Wu B.; Mu Y.; Duan X. G.; Zhang Q. X.; Zeng S. T.; Guo J. S.; Pu Z. J. Pore Structure Characteristics and Their Controlling Factors of Deep Shale: A Case Study of the Lower Silurian Longmaxi Formation in the Luzhou Area, Southern Sichuan Basin. ACS omega. 2022, 7 (17), 14591–14610. 10.1021/acsomega.1c06763. [DOI] [PMC free article] [PubMed] [Google Scholar]
- Testamanti M. N.; Rezaee R. Determination of NMR T2 cut-off for clay bound water in shales: A case study of Carynginia Formation, Perth Basin, Western Australia. Journal of Petroleum Science Engineering. 2017, 149, 497–503. 10.1016/j.petrol.2016.10.066. [DOI] [Google Scholar]
- Zhang W. W.; Huang Z. L.; Guo X. B.; Pan Y. S.; Liu B. C. A study on pore systems of Silurian highly mature marine shale in Southernern Sichuan Basin, China[J]. Journal of Natural Gas Science Engineering. 2020, 76, 103094 10.1016/j.jngse.2019.103094. [DOI] [Google Scholar]
- Jia A.; Hu D.; He S.; Guo X.; Hou Y.; Wang T.; Yang R. Variations of pore structure in organic-rich shales with different lithofacies from the Jiangdong block, fuling shale gas field, SW China: Insights into gas storage and pore evolution. Energy Fuels. 2020, 34 (10), 12457–12475. 10.1021/acs.energyfuels.0c02529. [DOI] [Google Scholar]
- Yao Y. B.; Liu D. M. Petrophysical properties and fluids transportation in gas shale: A NMR relaxation spectrum analysis method. J. China Coal Soc. 2018, 43 (1), 181–189. 10.13225/j.cnki.jccs.2017.4002. [DOI] [Google Scholar]
- Zhang N.; Wang S.; Xun X.; Wang H.; Sun X.; He M. Pore structure and fractal characteristics of coal-measure sedimentary rocks using nuclear magnetic resonance (NMR) and mercury intrusion porosimetry (MIP). Energies. 2023, 16 (9), 3812. 10.3390/en16093812. [DOI] [Google Scholar]
- Curtis M. E.Structural characterization of gas shales on the micro-and nano-scales. In Canadian unconventional resources and international petroleum conference; OnePetro: 2010. [Google Scholar]
- Sondergeld C. H., Ambrose R. J., Rai C. S.. Micro-structural studies of gas shales. In SPE unconventional gas conference; OnePetro: 2010. [Google Scholar]
- Gong X. P.; Tang H. M.; Zhao F.; Wang J. J.; Xiong H. Quantitative characterization of pore structure in shale reservoir of Longmaxi Formation in Sichuan Basin. Lithologic Reservoirs. 2016, 28 (3), 48–57. [Google Scholar]
- Li J. B.; Lu S. F.; Jiang C. Q.; Wang M.; Chen Z. H.; Chen G. H.; Li J. J.; Lu S. D. Characterization of shale pore size distribution by NMR considering the influence of shale skeleton signals. Energy Fuels 2019, 33 (7), 6361–6372. 10.1021/acs.energyfuels.9b01317. [DOI] [Google Scholar]
- Zhang H. J.; Jiang Y. Q.; Zhou K. M.; Fu Y. H.; Zhong Z.; Zhang X. M.; Qi L.; Wang Z. L.; Jiang Z. Z. Connectivity of pores in shale reservoirs and its implications for the development of shale gas: A case study of the Lower Silurian Longmaxi Formation in the southern Sichuan Basin. Natural Gas Industry B 2020, 7 (4), 348–357. 10.1016/j.ngib.2019.12.003. [DOI] [Google Scholar]
- Zhang G.; Zhou Z.; Cui C.; Zhang J.; Wang J. Characterization of Pore Structure and Fluid Mobility of Shale Reservoirs. ACS Omega 2024, 9, 37724. 10.1021/acsomega.4c03028. [DOI] [PMC free article] [PubMed] [Google Scholar]
- Yuan Y.; Rezaee R.; Zhou M. F.; Iglauer S. A comprehensive review on shale studies with emphasis on nuclear magnetic resonance (NMR) technique. Gas Science and Engineering. 2023, 120, 205163 10.1016/j.jgsce.2023.205163. [DOI] [Google Scholar]
- Gao P.; Xiao X.; Meng G.; Lash G. G.; Li S.; Han Y. Quartz types and origins of the Upper Permian Dalong Formation shale of the Sichuan Basin: Implications for pore preservation in deep shale reservoirs. Mar. Pet. Geol. 2023, 156, 106461 10.1016/j.marpetgeo.2023.106461. [DOI] [Google Scholar]
- Chen X.; Qu X.; Xu S.; Wang W.; Li S.; He H.; Liu Y. Dissolution pores in shale and their influence on reservoir quality in Damintun Depression, Bohai Bay Basin, East China: Insights from SEM images, N2 adsorption and fluid-rock interaction experiments. Marine and Petroleum Geology. 2020, 117, 104394 10.1016/j.marpetgeo.2020.104394. [DOI] [Google Scholar]
- Chalmers G. R. L.; Ross D. J. K.; Bustin R. M. Geological controls on matrix permeability of Devonian Gas Shales in the Horn River and Liard basins, northeastern British Columbia. Canada. Int. J. Coal Geol. 2012, 103 (23), 120–131. 10.1016/j.coal.2012.05.006. [DOI] [Google Scholar]
- Li A.; Ding W.; He J.; Dai P.; Yin S.; Xie F. Investigation of pore structure and fractal characteristics of organic-rich shale reservoirs: a case study of lower Cambrian Qiongzhusi formation in Malong block of eastern Yunnan Province. South China. Marine and Petroleum Geology. 2016, 70, 46–57. 10.1016/j.marpetgeo.2015.11.004. [DOI] [Google Scholar]
- Pyun S. I.; Rhee C. K. An Investigation of Fractal Characteristics of Mesoporous Carbon Electrodes with Various Pore Structures. Electrochim. Acta 2004, 49 (24), 4171–4180. 10.1016/j.electacta.2004.04.012. [DOI] [Google Scholar]
- Xie X. H.; Deng H. C.; Fu M. Y.; Hu L. X.; He J. H. Evaluation of pore structure characteristics of four types of continental shales with the aid of low-pressure nitrogen adsorption and an improved FE-SEM technique in Ordos Basin. China. J. Pet. Sci. Eng. 2021, 197, 108018 10.1016/j.petrol.2020.108018. [DOI] [Google Scholar]
- Hucheng D.; Meiyan F.; Wen Z.; Liying Z.; Xinhui X.; Yilin L.; Dailun W. The pores evolution of lacustrine shale induced by smectite-to-Illite conversion and hydrocarbon generation: upper Triassic Yanchang Formation, Ordos Basin, China. J. Pet. Sci. Eng. 2021, 202, 108460 10.1016/j.petrol.2021.108460. [DOI] [Google Scholar]
- Chang J.; Fan X.; Jiang Z.; Wang X.; Chen L.; Li J.; Zhu L.; Wan C.; Chen Z. Differential impact of clay minerals and organic matter on pore structure and its fractal characteristics of marine and continental shales in China. Appl. Clay Sci. 2022, 216, 106334 10.1016/j.clay.2021.106334. [DOI] [Google Scholar]
- Beaufort D.; Rigault C.; Billon S.; Billault V.; Inoue A.; Inoué S.; Patrier P. Chlorite and chloritization processes through mixed-layer mineral series in low-temperature geological systems – a review. Clay Miner. 2015, 50 (4), 497–523. 10.1180/claymin.2015.050.4.06. [DOI] [Google Scholar]
- Pelayo M.; García-Romero E.; Labajo M. A.; Del Villar L. P. Evidence of montmorillonite/Fe-rich smectite transformation in the Morr′on de Mateo bentonite deposit (Spain): Implications for the clayey barrier behaviour. Appl. Clay Sci. 2016, 131, 59–70. 10.1016/j.clay.2015.12.033. [DOI] [Google Scholar]
- Xia H.; Perez E. H.; Dunn T. L. The impact of grain-coating chlorite on the effective porosity of sandstones. Mar. Pet. Geol. 2020, 115, 104237 10.1016/j.marpetgeo.2020.104237. [DOI] [Google Scholar]
- Worden R. H.; Griffiths J.; Wooldridge L. J.; Utley J. E. P.; Lawan A. Y.; Muhammed D. D.; Simon N.; Armitage P. J. Chlorite in sandstones. Earth-Sci. Rev. 2020, 204, 103105 10.1016/j.earscirev.2020.103105. [DOI] [Google Scholar]
- Nie H. K.; Li P.; Chen Q.; Jin Z. J.; Liu Q. Y.; Dang W.; Chen Q.; Ding J. H.; Zhai C. B. A world-class source rock in southern China formed during the periods from Katian to Rhuddanian: Biostratigraphic distribution, depositional model and shale gas potential. Gondwana Research. 2024, 126, 267–288. 10.1016/j.gr.2023.10.007. [DOI] [Google Scholar]
- Nie H. K.; Sun C. X.; Li P.; Jin Z. J.; Liu Q. Y.; Bao H. Y.; Shen B. J.; Dang W. Carbon isotope evidence for shale gas preservation conditions and large methane release over million years: A case study of shale gas reservoirs of Wufeng and Longmaxi Formations in the Sichuan Basin. Geoscience Frontiers. 2023, 14 (6), 101642 10.1016/j.gsf.2023.101642. [DOI] [Google Scholar]
- Liu S.; Sun H.; Zhang D.; Yang K.; Li X.; Wang D.; Li Y. Experimental study of effect of liquid nitrogen cold soaking on coal pore structure and fractal characteristics. Energy. 2023, 275, 127470 10.1016/j.energy.2023.127470. [DOI] [Google Scholar]


