

Abstract
Existing tensioning cable prestress ensures bridge safety. This work presents the micro-hole release technique, which accurately measures the effective prestress of strands in existing prestressed concrete bridges. The strand drilling model was produced in Solidworks and Abaqus. The effect of drilling depth, diameter, deflection angle, and hole edge distance on strand stress release was then examined. The findings indicate that strand drilling tension relief is directly related to hole depth and diameter. As aperture size increases, stress alleviation decreases. The stress release error rate increases as the strand drilling deflection angle increases from 0° to 15°. Portable electric drill bits are 1.5 mm. A 5.0 mm hole was bored into the steel wire. The steel strand drilling wire is 3.0 mm from the hole’s edge. The drill bit is designed to maintain a drilling deflection angle of less than 5°, ensuring accuracy and ease of testing. After that, the 1860 grade strand drilling test was used to compare stress release and associated circumstances between P-T and T-P operating conditions. The strain-tension fitting equations for strand release were compared to finite element simulation results under P-T and T-P operating conditions. We found that the formula for fitting the strain-tension force of strand release under T-P condition matches finite element simulation results. It also matches real-world engineering methods.
Supplementary Information
The online version contains supplementary material available at 10.1038/s41598-024-74598-9.
Keywords: Bridge project, 1860 grade strand, Effective prestressing, Microcellular method, Simulation calculations, Borehole tests
Subject terms: Civil engineering, Metals and alloys
Introduction
Prestressed concrete parts are often used in bridges with large spans. Prestressed concrete girders often utilize steel strands to apply prestressing force, while steel strands are also widely used in rock reinforcement to maintain the stability of excavated rock formations1. Several researchers have analyzed the variables that impact the effectiveness of the prestressing force in prestressing strands. Li et al.2 examined the influence of corrosion on the prestressing force of prestressed concrete strands. Their research uncovered that the prestressing force of the strands diminished as corrosion in Chengdu escalated, leading to a decline in the tensile characteristics of the strands. Li et al.3 investigated the progression of corrosion in prestressing strands in concrete resulting from the erosion of chloride ions. The results suggest that there is a close correlation between the rate of corrosion of prestressing strands in concrete and the level of stress applied. Furthermore, the rate of corrosion decreases over time, initially at a quick rate and then at a slower speed. Luo et al.4 identified a direct relationship between temperature and prestressing loss. They also proposed a series of equations to accurately model the thermal stresses of the prestressing strands, coefficients of thermal expansion, and the maximum rate of prestressing loss. In addition, a finite element model of a prestressing strand exposed to elevated temperatures was developed and validated.
Over time, the prolonged use of the bridge and its exposure to external elements cause a reduction in the effective prestress of its internal steel strand. The decrease in size can lead to the formation of fissures, bending, and additional structural problems in the concrete beam of the bridge. These issues present a substantial risk to the safety of the bridge5. Visual detection of the loss of prestress is difficult due to the steel strand being buried deep into the girder body. Furthermore, it is unfeasible to ascertain whether the member necessitates prestress supplementation and the specific quantity required. Therefore, accurately determining the optimal amount of force applied by steel strands in active girders has become a major technological challenge. Currently, the methods for determining the effective prestressing of strands in prestressed concrete beams can be classified into direct and indirect approaches. The direct methods widely used include the pull-off method, cross-tension increment method, vibration method, fluctuation method, electromagnetic detection method, ultrasonic guided wave method, cutting method, and other techniques. The use of these methodologies for effective prestress testing of in-service bridges is limited due to challenging testing conditions, increasing factors affecting testing accuracy, and lack of theoretical guidance. Commonly employed indirect techniques include the local stress release method, dissipative bending moment method, dynamic testing method, equivalent mass method, etc6. The complex performance characteristics of the concrete material, together with the interaction of prestressing multi-beam topologies and other factors in the indirect technique, would inevitably lead to considerable discrete and systematic errors7. Numerous experts, both from within the country and abroad, have carried out study on identifying efficient prestressing in concrete bridges. For example, GUO et al.8 developed a method to compute the effective prestressing of pre-stressing tendons in the tension zone of concrete bridges. This estimate relies on the assumption of a two-dimensional structure and the principles of prestressing decompression elastomers. The formula is a useful tool for determining the efficient prestressing of cracked simply-supported girders. Yuan Qin9 proposed a method utilizing the blind hole approach to precisely identify the prestress of strands. The maximum release strain was determined by finite element simulation and testing to occur when the depth of strand drilling reached 2.5 mm and the diameter of drilling was 1.5 mm. Moreover, a correlation between the tension of the strand and the amount of strain released was established. This discovery presents a new method for accurately evaluating the level of tension in bridges that are currently in operation. Zhang Zhiguo et al.7 did a study on detecting the efficacy of prestressing in steel strands using the blind hole method. The researchers examined the strain release occurring at the boundary of the hole in the strand by comparing empirical findings, while considering the impact of the drilling radius. In the end, they established a quadratic correlation between the effective prestressing force of the steel strand and the released strain. This discovery validates the effectiveness of the blind hole technique in identifying the level of prestressing in steel strands. The effectiveness of using the drilling approach to determine the optimal prestress of steel strands is further confirmed. The researchers used a testing methodology to release the prestressing force of the steel strand. This involved applying strain gauges, then tensioning the strand, drilling holes in it, and recording the released strain, known as P-T. While a significant correlation exists between the tension of the strands and the strain observed in the test data provided by the two scholars, it is crucial to examine whether the relationship equation established during the P-T process is applicable to real-world engineering situations. This investigation is particularly important for in-service prestressed concrete bridges where the strands under tension cannot undergo the P-T test procedure.
In summary, there is currently a lack of an effective and simple method to predict the effective prestressing of steel strands, which hinders the accurate assessment of the structural safety of in-service bridges. In light of this, this paper proposes a new method to detect the effective prestressing of 1860-grade steel strands, aiming to improve the accuracy of effective prestress prediction in bridges. Kirsch’s analytical equation establishes the theoretical correlation between strand tension and release strain. The steel strand drilling model was created utilizing Solidworks and Abaqus. The study aimed to investigate the effects of drilling depth, drilling diameter, and drilling deflection angle on the stress release of the steel strand. The ideal depth for drilling, diameter of the drill, angle of deflection during drilling, and position for measuring strain were determined. The laboratory performed a strand drilling pre-stress release test, which encompassed three distinct operating circumstances. The conditions for the experiment were as follows: a stress-free state where no tension was applied to the strand, a sequence where strain gauges were attached, followed by tensioning the strand, and finally drilling for stress release (P-T), and a sequence where the strand was tensioned first, followed by attaching strain gauges, and finally drilling for stress release (T-P). The objective of this study is to evaluate and analyze the differences in outcomes obtained from the strand release strain test conducted under pressure-temperature (P-T) and temperature-pressure (T-P) circumstances. Furthermore, it aims to evaluate the appropriateness of the test and ultimately construct a mathematical equation that defines the correlation between strand tension and release strain. The results of this study will be a significant resource for precisely identifying the pre-tensioning of steel strands in bridges during actual construction projects.
Theory of stress relief in drilled holes
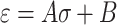
Analyzing the stress-strain release and initial state structural stresses for the through-hole technique can be done directly by employing Kirsch’s analytical equation10,11 (Eq. 1). However, there is a constraint on the maximum depth at which the wire can be bored. The drilling operation generates heat and stress concentration, leading to increased stress levels at the hole’s edge, exceeding the wire’s yield strength and creating additional plastic compressive strain. The calibration formula for Kirsch’s theoretical strain release factor becomes invalid as a result of the impact of hole edge plasticity. The level of tensile stress has a direct impact on the extent of the inaccuracy resulting from the increased strain of the plastic material near the edge of the hole. Hence, to evaluate the precision of the extra strain at the border of the hole, it is imperative to take into account the strain release coefficient derived from a calibration experiment. Consequently, the initial condition of the structural stress can be computed. The examination of the primary hole edge release coefficient for the plasticity correction calibration method reveals that the strain release coefficient’s specific energy may be adjusted according to the hole edge’s shape. The error curve correction method and the strain release coefficient grading correction method are appropriate techniques for quantifying elevated residual stresses. The strain release coefficient grading correction method necessitates the implementation of variable control via grading. Conversely, the iterative error correction method is appropriate for components with holes that are being opened. Comparative analysis shows that using the slope of the σ-ε straight line through the strain release coefficient method produces more precise outcomes in finding the strain release coefficient and subsequently computing the initial stress.
 |
1 |
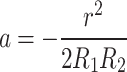
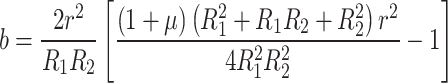
Where: E is the elasticity modulus in GPa. The dimensionless quantity is the Poisson’s ratio. r is the mm-measured radius of the drilled hole. The closest and farthest distances, measured in millimeters, between the sensitive grid of the strain gauge and its center, are and are the angles in radians between the major stress and the strain gauge. The main stresses in orthogonal directions in MPa are and  .
.
While the analytical technique is unable to directly ascertain the stress field surrounding the wire borehole, it is possible to identify it through finite element analysis or calibration testing. Let us assume that the strain release coefficients a and b are utilized to substitute each influencing aspect in Kirsch’s solution. Let:
 |
2 |
 |
3 |
Equations (2) and (3) can be substituted into Eq. (1) to produce:
 |
4 |
When the strain gauges, hole diameter, and hole depth are known, the drill hole drilling produces an extra plastic compressive strain value (initial strain value), a constant B, at the hole edge12. By combining Eq. (4),  ,
,  ,
,  , it is possible to produce unidirectional stress (tensile stress) along the axial direction while taking into consideration the effect of plastic strain at the hole edge.
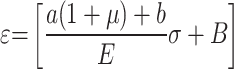 |
5 |
Let 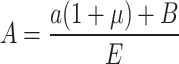 , Then Eq. 5 is:
 |
6 |
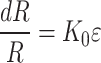
In light of the constraints of the strain gauge specification, the borehole size, a certain depth of the borehole, and ignoring the real measurement error, it is evident from Eq. (6) that the measured strain is linearly and positively connected with the axial tensile stress.
Numerical simulation of steel strand drilling
Determination of model and test physical parameters
The attributes of the strand wire model are established according to the specifications GB/T5224-2014 “pre-stressed concrete with steel strand”13 and GB/T5223-2014 “prestressed concrete with steel wire”14. The model utilizes an 1860-grade strand, as depicted in Table 1. A strand friction coefficient of 0.10 is adequate to fulfill the accuracy criteria for assessing the local behavior and the precise length of the strand15. Applying different levels of tension to the excessively long strand during drilling will cause bending stress, which can affect the release of stress. It is crucial to avoid the strand from becoming too short due to radial contraction at the end, as this can impact the precision of stress analysis while drilling. The optimal length of the strand should be calculated as twice the twist distance, which is 450 mm.
Table 1.
Parameters of 1860 grade strand.
| structure | direction of rotation | navel gaps (S/mm) | Nominal Diameter (Dn/mm) |
density (ρ/g⋅cm-3) | strength class (P/MPa) | yield strength (σc/MPa) | elastic modulus (E/GPa) | Poisson’s ratio |
|---|---|---|---|---|---|---|---|---|
| 1 × 7 | leftwards | 225 | 15.20 | 7.85 | 1860 | 1581 | 195 | 0.269 |
Finite element modeling
The exact measurements of the strand were entered into SolidWorks, where the cylinder was rotated to generate a three-dimensional depiction of the strand. In addition, the shell component was employed to create a model of the drill bit. Figure 1 illustrates the constituents of the strand and drill. The Abaqus model comprised of seven individual wires of the strand and a drill bit. These components were imported as separate parts and subsequently assembled.
Figure 1.

Schematic diagram of drill and strand components.
The hexahedral neutral axis method sweeping mesh is used to accomplish accurate analysis and efficient calculation. It is applied to the overall meshing and subdivision of the strand and drilled steel wires. The utilized cell types are exclusively C3D8R solid cells. The drill was divided into two categories: R3D3 and R3D4 shell cells. The steel strand is composed of a grand total of 79,855 cells and 88,907 nodes. The drill bits measuring 1.0 mm, 1.2 mm, 1.8 mm, and 2.0 mm in diameter together have a total of 706–1245 cells and 704–1242 nodes. Figure 2 depicts the model’s meshing.
Figure 2.

Mesh division of drill and strand.
To optimize the process of analyzing and presenting the results for each test phase, the model analysis phase is divided into three distinct phases. The first phase entails the calibration of strand tension, which is then followed by the wire drilling procedure, and ultimately concludes with the drilling being completed. All analysis step types in the strand drilling analysis are configured to be both geometrically nonlinear and dynamically significant due to its dynamic nature. The heat output leads to a very small and controllable false strain, but the mechanical interference has a large impact on the stress-strain relationship16. Consequently, the model lacks the necessary thermodynamic characteristics and only considers the drill bit’s inertia. Utilizing strand drilling will cause structural damage to the steel wire. Hence, the Johnson-Cook damage model, which incorporates the removal of failed units, is employed for metal materials. The contact type between the drilled wire and the drill bit can be classified as Universal contact. In this contact, a Hard contact occurs between the wires that are perpendicular to each other, while a Penalty contact occurs in the tangential direction. The test tensioning method entails imposing a completely immovable constraint on one end of the strand, while the other end permits only axial displacement and limits radial displacement. In addition, varying levels of facial stresses are applied according to the analytical specifications. A local coordinate system is implemented on the drill bit to eliminate constraints on both displacement and rotation. The depth at which the drill bit enters the steel wire can be controlled by altering the displacement parameter. The rotational speed of the drill bit is configured to be 62.8 radians per second, and it rotates in the same direction as its cutting edge. Figures 3 and 4 illustrate the arrangements of stranded steel wire before and after drilling, respectively.
Figure 3.

Stress maps of stranded steel wire before drilling.
Figure 4.

Stress map of stranded wire after drilling of the outer wire.
Influence of strand drilling control parameters on stress release
Effect of drilling depth on stress relief
The finite element model defines the hole depth of the outer spiral steel wire within the range of 2.0 mm to 5.0 mm. The drilling depth increment is set to 0.5 mm. The tensile tension of the strand is fixed at 1000 MPa, while the diameter of the drilled holes measures 1.5 mm. All other static-dynamic parameter configurations remain unaltered. The goal is to ascertain the stress release value of the axial surface unit of the drilled steel wire at various hole depths.
The axial distance from the designated measurement point to the perimeter of the hole is equivalent to the hole’s edge. The L-M curve fitting method in Origin software was employed to establish the correlation between the distance from the hole edge and the stress release value at various depths of the hole, as well as the correlation between the depth of the hole and the stress release value at different distances from the hole edge. The results of the curve fitting can be observed in Figs. 5 and 6, with all correlation coefficients surpassing 0.98.
Figure 5.

Relationship between hole edge distance and stress release for different hole depths.
Figure 6.

Hole depth versus stress release for different hole edge distances.
Based on the examination of Figs. 5 and 6, it is clear that the stress release value decreases as the hole margin grows within the range of 2 mm to 5 mm. Moreover, the reduction in tension is most noticeable when the margin of the hole is within the range of 3 mm to 5 mm. Figure 5 illustrates a direct correlation between the stress release value and the depth of the hole, throughout the range of hole side distances ranging from 3 mm to 7 mm. Significantly, the reduction in tension is especially noticeable when the depth of the hole ranges from 2 mm to 5 mm. Yuan Qin suggested a drilling depth of 2.5 mm, whilst Zhang Zhiguo advocated for a drilling depth ranging between 2.5 mm and 3.0 mm. According to the researchers, the decrease in stress is most noticeable when drilling at a depth between 2.5 mm and 3.0 mm. However, this depth is considered shallow and presents difficulties in obtaining the target hole depth accurately. Therefore, the authors suggest that the desired drilling depth can be attained within the specified range of 4 mm to 5 mm. This range guarantees a more noticeable stress relief and enables improved control over the depth of drilling.
Effect of borehole diameter on stress relief
The presence of different drilling diameters (apertures) on the cross-section of the stranded steel wire led to inconsistent levels of weakening, as well as diverse degrees of stress relief. Utilizing a portable electric drill to bore through steel wire possessing a minuscule cross-section and significant hardness may result in the drill bit fracturing readily if the diameter is excessively small. On the other hand, if the diameter of the drill bit is very large, it might result in much more significant harm to the strand. Therefore, the objective in this preliminary step of the test is to determine the appropriate drill diameter by considering the current parameters for simulating stress release in strand drilling. The prescribed drilling sizes were 1.0 mm, 1.2 mm, 1.5 mm, 1.8 mm, and 2.0 mm. The strand tension stress was measured at 1000 MPa for each drilling diameter. After analyzing the drilling depth parameters discussed in the previous section, it was found that the drilling depths are 4.0 mm, 4.5 mm, and 5.0 mm. The remaining values for the static-dynamic parameters remained unaltered. The figures in Figs. 7, 8 and 9 illustrate the correlation between hole margin and stress release L-M at different drilling depths. All the graphs have correlation coefficients exceeding 0.95.
Figure 7.

Hole edge distance-stress release relationship for different hole diameters at hole depth 4.0 mm.
Figure 8.

Hole edge distance-stress release relationship for different hole diameters at hole depth 4.5 mm.
Figure 9.

Hole edge distance-stress relief relationship for different hole diameters at hole depth 5.0 mm.
Upon analyzing Figs. 7, 8 and 9, it is apparent that the depth of the hole ranges from 4.0 mm to 5.0 mm. In addition, the stress relief value increases with the growth of the hole diameter, but decreases with the increase in the hole side distance. When the hole spacing is 8.0 mm and the hole depth ranges from 4.0 mm to 5.0 mm, the stress relief in the strand is less than 5% of the tension stress in the strand. Furthermore, the stress relief for hole widths ranging from 1.0 mm to 1.2 mm is very insignificant. For example, when the hole margin is 3 mm and the drilling depth is 4 mm, the stress release at drilling diameters of 1.0, 1.2, 1.5, 1.8, and 2.0 mm is 155, 200, 234, 278, and 340 MPa in order. when the hole margin is 4 mm and the drilling depth is 4 mm, the stress release at drilling diameters of 1.0, 1.2, 1.5, and 1.8 is 1.2, 1.5, 1.8, and 2.0 mm, 2.0 mm, the stress release is 215, 183, 151, 122, 87 MPa in order, and the stress release values are lower than the stress release values when the hole side distance is 3 mm.
JIANG15 through the strand cross-section analysis found that the strand wire depth in 1/2 diameter at the stress and axial tension stress is basically the same. Strand side wire breakage strand bearing capacity will be greatly reduced17, in order to avoid the drilling process, “zero drift” and stress concentration and other factors produce interference strain drilling wire fracture, as well as the test drilling stress release collection of false stress analysis can be measured data for the correction of the theoretical basis, to further improve the test stress-strain measurement. Further improve the accuracy of the test stress-strain measurement. Therefore, the finite element analysis of stresses near the drilled section of stranded steel wire in the drilling process, and determine whether the drilled steel wire will be fractured by tensioning the stranded steel wire after drilling.
Combined with the finite element analysis and the results of the tensioning verification test, it can be seen that the strand drilled steel wire in addition to a very small range of hole edges in the hole edges of the existence of plastic deformation, drilled steel wire other locations in the stress release process did not occur in the obvious plastic deformation. When the hole diameter of 1.5 mm, drilling depth of 5.0 mm, drilling process “zero drift” and stress concentration and other factors produce false stress on the plastic development of the drilled steel wire is very small. After the weakening of the cross-section of the drilled steel wire can still work normally, can still ensure that the strand does not appear outside the drilled steel wire fracture phenomenon, the overall bearing capacity of the strand damage is small.
Effect of drilling deflection on stress relief
A number of researchers have investigated the influence of drilling eccentricity on the stress reduction of steel strands18–20. Nevertheless, there is a scarcity of research on the impact of drilling eccentricity on the stress reduction of steel strands. Hence, this section investigates the relaxation of stress in steel strands when the drilling eccentricity angle ranges from 0° to 15°, employing a finite element model.
The finite element analysis model assumes a tensile stress of 1000 MPa for the strand under different drilling deflection angles. The drilling hole depth is fixed at 5.0 mm, whereas all other static and dynamic characteristics of the strand are similarly determined. Figure 10 illustrates the correlation coefficients between the margin of the hole and the rate of inaccuracy in stress release for different angles of hole deflection. Furthermore, all correlation values obtained by the L-M curve fitting approach exceed 0.85. Figure 11 illustrates the error rates for both the deviation angle of the hole and the reduction of stress under different hole margins.
Figure 10.

Hole edge distance-stress relief error rate relationship for different hole de-flections.
Figure 11.

Borehole deflection-stress relief error rate relationship for different borehole edge distances.
Upon analyzing Figs. 10 and 11 together, it becomes apparent that the angle at which the strand is drilled has a substantial influence on its stress alleviation. The drilling angle induces a deviation in the stress release direction of the drilled steel wire, leading to a reduction in stress release for the surface unit along the original axis. Figure 10 illustrates a direct relationship between the stress release error rate and the hole side distance within the range of drilling deflection angles from 5° to 15°. Put simply, as the distance between the holes increases, the rate at which stress is released also rises. The stress release error rate remains below 8% when the drilling deflection angle is 5°, within the range of 3.0 mm to 5.0 mm. Furthermore, the stress release error rate remains consistently below 16% when the drilling deflection angle is set at 10°. Nevertheless, when the drilling deflection angle reaches 15°, the stress release error rate ranges from 21 to 25%. Figure 11 illustrates a direct relationship between the drilling deflection angle and the stress release error rate at different hole margins, suggesting that an increase in the deflection angle results in a greater error rate. When the angle of deviation during drilling is less than 10°, the percentage of inaccuracy in stress relief is less than 18%. Likewise, if the angle of deflection is less than 5°, the absolute value of the stress release deviation ratio is always less than 9% in every situation. It is of little importance. Therefore, it is crucial to carefully control the alignment of the handheld drill bit during the drilling test to avoid the impact of the angle at which the drill deviates, thereby reducing the potential loss in accuracy of strain collection.
In order to determine the stress in a single long straight strand, the drilling stress release method is employed. This approach involves the use of a hand-held drill bit with a diameter of 1.5 mm. The steel wire is bored to a depth of 5.0 mm. The drill bit is precisely manipulated to maintain a deflection angle of under 5°. The axial distance between the drilled steel wire and the edge of the hole varies from 3.0 mm to 5.0 mm. These parameters guarantee both the precision of the test and the simplicity of execution.
Steel strand drilling experiment
Test equipment
The test equipment used in this study consists of a manually operated hollow hydraulic jack, a DH3819 wireless static strain collector with strong anti-jamming capability made by Jiangsu Donghua Testing Technology Co., and a DHDAS wireless dynamic signal acquisition and analysis system. In addition, a specialized strain gauge model BFH120-1GB-7.0-D150 was used. The strain gauge possesses a fundamental length of 14 mm and a fundamental breadth of 1.5 mm. The sensitivity coefficient of the strain gauge is established via factory calibration and quantified at a value of 2.0. The strain gauge possesses a resistance value of 120Ω. In order to install the strain gauge, you will require fine sandpaper, 502 super-strength fast-drying adhesive specifically designed for metal, a lengthy cable, insulating tape, foam tape, and digital vernier calipers.
There are several improvised tensioning platforms for strands in the vicinity, as seen in Fig. 12. The handcrafted strand tensioning platform has several benefits, including its reusability, easy installation and disassembly, the capability to monitor strain gauge paste, wiring, tension measurement, and the ability to verify the strain gauge’s function during precise grinding.
Figure 12.

Homemade strand tensioning platform and measurement point arrangement.
Stranded wire drilling method
The steel wire is drilled to a depth of 5.0 mm, while ensuring that the deflection of the drill bit does not exceed 5°. The axial drilling range of the steel wire strand is established, with a specific distance of 3.0 mm measured from the hole’s edge. These parameters are combined with the second section of the strand for finite element simulation.
Arrangement of strain measurement points for strand release under stress-free conditions
Table 2 presents the fundamental properties of the twelve 1860-grade steel strands, with each strand being 60 cm in length. There were two measuring places on each strand, and each measurement point was equipped with a distinct strain gauge. A bundle of twelve strands should produce a total of 24 measurements of strain, whereas a single strand would only yield two measurements.
Table 2.
1860 grade steel strand factory basic parameter table.
| Structure | Direction | Weight /kg | Nominal Diameter /mm | Length/m | Strength Class/MPa | Date Of Production | Standard Number | Relaxation Level |
|---|---|---|---|---|---|---|---|---|
| 1 × 7 | Leftwards | 1078 | 15.20 | 978 | 1860 | 2022-08-02 | GB/T5224-2014 | II |
Steps of strain release test for stranded wire in graded tensioning condition
The strain release of the strand under graded tension is divided into two conditions, namely, paste strain gauges first and then tension strand (P-T) and tension strand first and then paste strain gauges (T-P).
P-T test procedure: paste strain gauges - tension strand - strain zeroing - strand drilling - reading strain release.
T-P test procedure: tension strand - paste strain gauges - strand drilling - read release strain.
Arrangement of strain measurement points for stranded wire under graded tensioning condition
A total of thirteen strands of 1860 grade, each with a length of 2.8 m, were organized to apply tension in a graduated fashion. Three measurement places were designated on the exterior spiral wire of every strand, and a unique custom-made strain gauge was attached to each position. Each strand is expected to include 6 strains, resulting in a total of 78 strains that will be measured over the 13 strands, as shown in Fig. 13. Table 3 presents the strand numbers and their corresponding tension.
Figure 13.

Schematic diagram of stranded wire after drilling of the outer wire.
Table 3.
Strand numbers and tension values.
| First P-T | First T-P | ||
|---|---|---|---|
| Steel strand number | Tensile strength/kN | Steel strand number | Tensile strength/kN |
| XT1 | 19.23 | XL1 | 23.15 |
| XT2 | 27.56 | XL2 | 27.74 |
| XT3 | 36.23 | XL3 | 40.31 |
| XT4 | 48.72 | XL4 | 55.67 |
| XT5 | 54.50 | XL5 | 59.25 |
| XT6 | 72.05 | XL6 | 68.92 |
| XT7 | 83.74 | XL7 | 78.37 |
| XT8 | 87.68 | XL8 | 85.14 |
| XT9 | 102.51 | XL9 | 103.56 |
| XT10 | 114.29 | XL10 | 103.15 |
| XT11 | 118.25 | XL11 | 122.85 |
| XT12 | 127.06 | XL12 | 126.01 |
| XT13 | 139.08 | XL13 | 136.56 |
| XL14 | 145.31 | ||
| XL15 | 148.50 | ||
T-P: Kindly organize 15 strands, each measuring 2.8 m, with a stress grade of 1860. Three measurement places are placed along each strand outside the spiral steel wire, and one custom strain gauge is attached to each measurement point. Each strand is expected to capture 6 data points for strain. A total of 15 strands are expected to capture a cumulative of 90 strain data points. The configuration of measuring locations is depicted in Fig. (13). Table 3 presents the numerical values of the strands and their corresponding stress levels.
Test results and analyses
Figure 13 depicts the steel strand after undergoing the drilling procedure. Table 4 presents the results of the strain test performed on the strand that was released by drilling under conditions where no load was applied. The initial pressure-temperature (P-T) conditions The tensile test results of the strand extracted during drilling are presented in Table 5. The beginning T-P. Table 6 presents the results of the strain test performed on the strand that was released during the drilling process.
Table 4.
Strain test results of steel wire released from brick holes under unstressed condition.
| Steel stranded wire number | Mean value of strain at measurement point/
|
The average value of strain in steel strand /
|
|
|---|---|---|---|
| C1 | C2 | ||
| W1 | -158 | -298 | -228 |
| W2 | -395 | -347 | -371 |
| W3 | -359 | -565 | -462 |
| W4 | -537 | -365 | -451 |
| W5 | -432 | -410 | -421 |
| W6 | -437 | -119 | -278 |
| W7 | -228 | -242 | -235 |
| W8 | -199 | -241 | -220 |
| W9 | -450 | -323 | -387 |
| W10 | -437 | -361 | -399 |
| W11 | -132 | -420 | -276 |
| W12 | -232 | -110 | -167 |
Table 5.
Drilled holes release drilled wire strain measurement results (P-T).
| Number of measurement points | Steel stranded wire number | Measurement point number | tensile force/kN |
 / /
|
 / /
|
 / /
|
|
|---|---|---|---|---|---|---|---|
| 1# | 2# | ||||||
| 1 | XT1 | C1 | 19.23 | 89 | 71 | 80.0 | 80.5 |
| 2 | XT1 | C2 | 19.23 | 121 | 48 | 84.5 | |
| 3 | XT1 | C3 | 19.23 | 101 | 53 | 77.0 | |
| 4 | XT2 | C1 | 27.56 | 222 | 119 | 170.5 | 187.0 |
| 5 | XT2 | C2 | 27.56 | 145 | 244 | 194.5 | |
| 6 | XT2 | C3 | 27.56 | 284 | 108 | 196.0 | |
| 7 | XT3 | C1 | 36.23 | 252 | 462 | 357.0 | 361.3 |
| 8 | XT3 | C2 | 36.23 | 367 | 350 | 358.5 | |
| 9 | XT3 | C3 | 36.23 | 412 | 325 | 368.5 | |
| 10 | XT4 | C1 | 48.72 | 554 | 674 | 614.0 | 616.3 |
| 11 | XT4 | C2 | 48.72 | 432 | 715 | 573.5 | |
| 12 | XT4 | C3 | 48.72 | 721 | 602 | 661.5 | |
| 13 | XT5 | C1 | 54.50 | 451 | 314 | 382.5 | 659.7 |
| 14 | XT5 | C2 | 54.50 | 863 | 825 | 844.0 | |
| 15 | XT5 | C3 | 54.50 | 883 | 622 | 752.5 | |
| 16 | XT6 | C1 | 72.05 | 656 | 850 | 753.0 | 813.67 |
| 17 | XT6 | C2 | 72.05 | 923 | 850 | 886.5 | |
| 18 | XT6 | C3 | 72.05 | 725 | 878 | 801.5 | |
| 19 | XT7 | C1 | 83.74 | 1163 | 1137 | 1150.0 | 1122.3 |
| 20 | XT7 | C2 | 83.74 | 1600 | 682 | 1141.0 | |
| 21 | XT7 | C3 | 84.74 | 907 | 1245 | 1076.0 | |
| 22 | XT8 | C1 | 87.68 | 1520 | 978 | 1249.0 | 1151.2 |
| 23 | XT8 | C2 | 87.68 | 1321 | 963 | 1142.0 | |
| 24 | XT8 | C3 | 87.68 | 925 | 1200 | 1062.5 | |
| 25 | XT9 | C1 | 102.51 | 1205 | 1520 | 1362.5 | 1417.0 |
| 26 | XT9 | C2 | 102.51 | 906 | 1820 | 1363.0 | |
| 27 | XT9 | C3 | 102.51 | 1644 | 1407 | 1525.5 | |
| 28 | XT10 | C1 | 114.29 | 1200 | 2116 | 1658.0 | 1567.7 |
| 29 | XT10 | C2 | 114.29 | 1821 | 1235 | 1528.0 | |
| 30 | XT10 | C3 | 114.29 | 1523 | 1511 | 1517.0 | |
| 31 | XT11 | C1 | 118.25 | 1807 | 1359 | 1583.0 | 1573.8 |
| 32 | XT11 | C2 | 118.25 | 2031 | 895 | 1463.0 | |
| 33 | XT11 | C3 | 118.25 | 2766 | 585 | 1675.5 | |
| 34 | XT12 | C1 | 127.06 | 2720 | 1036 | 1878.0 | 1760.7 |
| 35 | XT12 | C2 | 127.06 | 1652 | 1804 | 1728.0 | |
| 36 | XT12 | C3 | 127.06 | 1432 | 1920 | 1676.0 | |
| 37 | XT13 | C1 | 139.08 | 2855 | 851 | 1853.0 | 1656.2 |
| 38 | XT13 | C2 | 139.08 | 2153 | 1608 | 1880.5 | |
| 39 | XT13 | C3 | 140.18 | 1305 | 1165 | 1235.0 |
Note:  indicates the strain value of the strand released by posting and then pulling the drill hole;
 indicates the average value of 1# and 2# strains under a single measurement point;
  indicates the average value of 6 strains of a single strand.
Table 6.
Drilled holes release drilled wire strain measurement results (T-P).
| Number of measurement points | Steel stranded wire number | Measurement point number | tensile force |
 / /
|
 / /
|
 / /
|
|
|---|---|---|---|---|---|---|---|
| 1# | 2# | ||||||
| 1 | XL1 | C1 | 23.15 | 23 | 15 | 19.0 | 46.5 |
| 2 | XL1 | C2 | 23.15 | 75 | 62 | 68.5 | |
| 3 | XL1 | C3 | 23.15 | 56 | 48 | 52.0 | |
| 4 | XL2 | C1 | 27.74 | 130 | 75 | 102.5 | 94.2 |
| 5 | XL2 | C2 | 27.74 | 70 | 81 | 75.5 | |
| 6 | XL2 | C3 | 27.74 | 50 | 159 | 104.5 | |
| 7 | XL3 | C1 | 40.31 | 188 | 198 | 193.0 | 155.3 |
| 8 | XL3 | C2 | 40.31 | 273 | 178 | 225.5 | |
| 9 | XL3 | C3 | 40.31 | 78 | 17 | 47.5 | |
| 10 | XL4 | C1 | 55.67 | 74 | 122 | 98.0 | 98.8 |
| 11 | XL4 | C2 | 55.67 | 111 | 44 | 77.5 | |
| 12 | XL4 | C3 | 55.67 | 149 | 93 | 121.0 | |
| 13 | XL5 | C1 | 59.25 | 144 | 112 | 128.0 | 193.8 |
| 14 | XL5 | C2 | 59.25 | 261 | 281 | 271.0 | |
| 15 | XL5 | C3 | 59.25 | 102 | 263 | 182.5 | |
| 16 | XL6 | C1 | 68.92 | 189 | 150 | 169.5 | 177.2 |
| 17 | XL6 | C2 | 68.92 | 156 | 185 | 170.5 | |
| 18 | XL6 | C3 | 68.92 | 185 | 198 | 191.5 | |
| 19 | XL7 | C1 | 78.37 | 212 | 182 | 197.0 | 251.0 |
| 20 | XL7 | C2 | 78.37 | 198 | 526 | 362.0 | |
| 21 | XL7 | C3 | 78.37 | 214 | 174 | 194.0 | |
| 22 | XL8 | C1 | 85.14 | 363 | 324 | 343.5 | 305.0 |
| 23 | XL8 | C2 | 85.14 | 306 | 247 | 276.5 | |
| 24 | XL8 | C3 | 85.14 | 190 | 400 | 295.0 | |
| 25 | XL9 | C1 | 103.56 | 210 | 251 | 230.5 | 219.0 |
| 26 | XL9 | C2 | 103.56 | 71 | 313 | 192.0 | |
| 27 | XL9 | C3 | 103.56 | 274 | 195 | 234.5 | |
| 28 | XL10 | C1 | 103.15 | 274 | 379 | 326.5 | 364.2 |
| 29 | XL10 | C2 | 103.15 | 339 | 528 | 433.5 | |
| 30 | XL10 | C3 | 103.15 | 351 | 314 | 332.5 | |
| 31 | XL11 | C1 | 122.85 | 604 | 508 | 556.0 | 430.0 |
| 32 | XL11 | C2 | 122.85 | 623 | 369 | 496.0 | |
| 33 | XL11 | C3 | 122.85 | 278 | 198 | 238.0 | |
| 34 | XL12 | C1 | 126.01 | 725 | 710 | 717.5 | 710.2 |
| 35 | XL12 | C2 | 126.01 | 715 | 775 | 745.0 | |
| 36 | XL12 | C3 | 126.01 | 724 | 612 | 668.0 | |
| 37 | XL13 | C1 | 136.56 | 988 | 488 | 738.0 | 450.2 |
| 38 | XL13 | C2 | 136.56 | 388 | 313 | 350.5 | |
| 39 | XL13 | C3 | 136.56 | 394 | 130 | 262.0 | |
| 40 | XL14 | C1 | 145.31 | 685 | 722 | 703.5 | 679.5 |
| 41 | XL14 | C2 | 145.31 | 653 | 813 | 733.0 | |
| 42 | XL14 | C3 | 145.31 | 652 | 552 | 602.0 | |
| 43 | XL15 | C1 | 148.50 | 921 | 905 | 913.0 | 832.0 |
| 44 | XL15 | C2 | 148.50 | 674 | 726 | 700.0 | |
| 45 | XL15 | C3 | 148.50 | 778 | 988 | 883.0 |
The law of change of release strain variation of steel wire
When the wire is drilled without any applied tension, the drill bit creates compressive stresses around the drilled area, leading to a negative strain value. When the strand is drilled while being pulled, the tensile stresses around the drilled wire are reduced, causing a buildup of stress at the hole. Consequently, the strain that was measured is positive.
During the process of drilling holes to alleviate strand stress, the specialized strain gauges display distinct characteristics that lead to the presence of two strain values at a single point of measurement. Figure 14 illustrates the results of two strains acquired from the same measurement point for the same strand. The strains were tested under three different conditions: no stress, first P-T, and first T-P. Figure 14 depicts a clear difference between the two strains at the exact location of measurement, known as the strain difference at the same point (DP). It is important to mention that the DP has greater significance when there is increased tensile stress. Several factors contribute to the mentioned phenomenon, such as uneven distribution of adhesive at the base of the strain gage during application, slight variation in the angle between the strain gage and the axial direction of the individual steel wire during pasting, displacement of the hole position when drilling holes in the strand, and uneven friction between the steel wires, among other factors.
Figure 14.

Plot of the distribution pattern of release strain values.
Figure 15 depicts the distribution of drilling pressure (DP) during the process of drilling holes in the strand under three distinct operating conditions: unstressed condition, first P-T, and first T-P. Figure 15 demonstrates that the DP in the stress-free state varies between − 310 and 300. Under the initial pressure-temperature (P-T) conditions, the range of the differential pressure (DP) is between − 1000 and 2500, with the bulk of values falling within 500. Furthermore, there are a total of 10 measurement locations where the DP (dew point) exceeds 500. The range of the DP in the initial T-P state is from − 350 to 500. The majority of the data points (DP) are within the range of 150 to 500, with a specific concentration between 350 and 500. The initial temperature-pressure situation displays a differential pressure (DP) that varies from − 350 to 500. Most of the data points (DPs) are between 150, while 8 points exceed this limit. In the first T-P condition, the DP is somewhat less than the first P-T condition. This phenomenon can be explained as follows: When the strain gauge is placed on the strand before it is tensioned, it experiences an initial tensile strain, which may result in a DP (damage propagation). Afterwards, the strain data is reset, and the tension is relieved by drilling the borehole, resulting in a subsequent occurrence of tensile strain in the strain gauge. Applying tensile tension for the second time may lead to a ductile fracture. Commence by attaching the strain gauge, then add stress to the strand, and conclude by drilling. Afterwards, the strain gauge will operate twice, leading to two instances of tensile stress and two instances of DP. Initially, the DP will be considerably greater in size compared to the strand. Afterwards, the strain gauge will be affixed, and then a hole will be made to generate the DP.
Figure 15.

DP value distribution pattern.
Relationship between tensile stress and release strain
First P-T
Linear regression is a statistical method used to model the relationship between a dependent variable and one or more independent variables by fitting a linear equation to the observed data. The tension force for Table 5 is associated with strain values 1# and 2#. The correlation coefficient between the tension force and strain is 0.84. The results are displayed in Fig. 16 (a), and the mathematical equation for fitting is given in Eq. (7). Linear regression is a statistical technique used to model the relationship between a dependent variable and one or more independent variables. It aims to find the best-fitting straight line that represents the relationship between the variables The correlation coefficient between the tension force for Table 5 and the average strain for 1# and 2# is 0.97. The results are shown in Fig. 16 (b), and the mathematical equation is given in Eq. (8). The mean values of tension force and strand strain from Table 5 were submitted to linear regression analysis. The correlation coefficient between the two variables was found to be 0.98. The results can be seen in Fig. 16 (c), while the mathematical equation used for fitting is shown in Eq. (9). Linear regression must consider the strain released by the strand drill hole when it is not under stress.
 |
7 |
 |
8 |
 |
9 |
Figure 16.

Tension-strain relationship under P-T condition.
Where:  is the strain released from the drill hole under the condition of First P-T;
  is the average value of the two strains of 1# and 2# at a single measurement point under the condition of First P-T; and
  is the average value of the six strains of a single strand under the condition of First P-T.
When considering Fig. 16, it is evident that the strongest correlation between tension and the average value of 6 strains of a single strand under the First P-T condition can be observed from Eqs. (7), (8), and (9). Furthermore, the disparities between the slopes and intercepts of these three equations are relatively insignificant.
T-P
The tension force and strain values presented in Table 6 were analyzed using linear regression. The calculated correlation coefficient between the two variables is 0.81. The outcomes of the fitting process are displayed in Fig. 17 (a), while the corresponding fitting equation is provided in Eq. (10). A linear regression model was used to fit the average tension force and strain values for 1# and 2# in Table 6. The correlation coefficient between the two variables is 0.85. The outcome is shown in Fig. 17 (b), and the mathematical expression for fitting is given in Eq. (11). Furthermore, a linear regression was performed to determine the relationship between the average tension force and strand strain values presented in Table 6. The correlation coefficient between the two variables is 0.91. The outcome is displayed in Fig. 17 (c), and the mathematical expression for the fitting is provided in Eq. (12). The linear regression analysis must consider the release strain of the drilled strand while it is in its unstressed condition.
 |
10 |
 |
11 |
 |
12 |
Figure 17.

Tension-strain relationship under T-P condition.
Where:  is the strain released from the drill hole under the condition of First T-P;
  is the average value of the two strains of 1# and 2# of a single measuring point under the condition of First T-P;
  is the average value of the six strains of a single strand under the condition of First T-P.
Upon examining Fig. 17, it becomes clear that the most pronounced association between the initial tension and the average value of six strains of a single strand in the First T-P condition may be detected by referring to Eqs. (10), (11), and (12). Furthermore, the difference between the slopes and intercepts of all three equations is quite small, which closely resembles that of the First T-P condition.
Influence of strain gauge adhesion sequence on Test results
By integrating the results from Fig. 16(a) and Fig. 17(a), it is evident that the strand release strain is higher under P-T conditions, varying from 0 to 3200, when exposed to the same tensile force. In contrast, the amount of strain released in the T-P condition is less, with values ranging from 0 to 1200. The correlation coefficient between tension condition and strand release strain is higher for Eqs. (7), (8), and (9) in comparison to Eqs. (10), (11), and (12), suggesting a higher level of precision. In summary, the strain gauges display diverse correlations between tension force and release strain due to different pasting sequences. The precise causes of this disparity are examined as follows.
The following relationship exists between the rate of change of strain gauge resistance and strain21:
 |
13 |
where R is the resistance of the strain gauge,  is the sensitivity factor of the single resistance wire, and
  is the strain.
As can be seen from Eq. (13), the relationship between the rate of change of the resistance of the strain gauge and the strain is determined by the sensitivity coefficient of the single resistance wire  . The coefficient is related to the Poisson’s ratio of the resistance wire material which is related to its geometry. The coefficient
  is related to the Poisson’s ratio of the resistance wire material, which is related to its geometry. Strain gauges are applied first and then the strand is tensioned, and the length of the strain gauges changes after they are tensioned. The change in the geometry of the strain gauge leads to a change in its Poisson ratio, which in turn leads to a change in the sensitivity coefficient of the resistance wire.
Therefore, compared with T-P, the strain gauge resistivity change is more sensitive in the P-T condition. Under the same tension condition, the strain gauge resistivity change on two strands with different strain gauge pasting order is the same, but the strain released from the drilled hole in the P-T strand is larger due to the different sensitivity coefficients of the strain gauges  . The strain gauge resistivity change on the two strands with different strain gauge pasting orders is the same.
Method validation
Figures 7, 8 and 9 illustrate a constant variation in stress release as the distance from the edge of the hole rises. Hence, the stress relieved on the surface of the steel wire over the length of the strain gauge wire grid corresponds to the total sum of the relieved stress. The borehole has a diameter of 1.5 mm and the steel wire used for drilling has a length of 5.0 mm. The axial span of the drilling steel wire strand extends from 3.0 mm to 5.0 mm starting from the hole’s edge. An empirical analysis was performed to examine the correlation between stress reduction and the magnitude of tensile stress in the strand, as denoted by Eq. (15). The simulated strand exhibited a tensile stress of 1000 MPa.
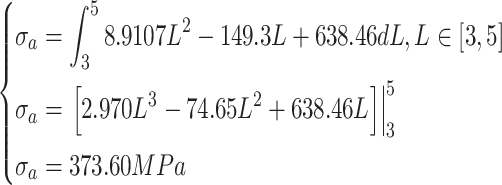 |
14 |
Where:  is the theoretical stress release, unit: MPa; L is the distance between the surface unit and the hole edge, unit: mm.
The strain gauge functions by utilizing the concepts of strain measurement and the material properties of the strand. The measured findings provide the mean strain value on the surface of the steel wire within the length of the strain gauge wire grid. Therefore, the correlation between the strain release in the customized strain gauge finite element simulation and the tension value of the strand can be represented as:
 |
15 |
Where:  is the finite element simulated strain value, the unit is
  ; L is the elastic modulus, the unit is MPa;
The method described above calculates the stress release and strain release during the application of a strand with a range of 400 ~ 900 MPa using finite element numerical simulation. The calculation results are presented in Table 7.
Table 7.
Finite element simulation results.
| number | Simulation of tensile stress /MPa | Simulated Tension /kN | Stranded wire simulation length /mm | Analog stress relief /MPa | Analogue strain relief /
|
|---|---|---|---|---|---|
| 1 | 400 | 56 | 450 | 206.29 | 528.94 |
| 2 | 500 | 70 | 450 | 230.03 | 589.82 |
| 3 | 600 | 84 | 450 | 255.64 | 655.48 |
| 4 | 700 | 98 | 450 | 279.21 | 715.91 |
| 5 | 800 | 112 | 450 | 302.49 | 775.61 |
| 6 | 900 | 126 | 450 | 338.62 | 868.25 |
| 7 | 1000 | 140 | 450 | 373.6 | 957.96 |
Linearly fit the tensile force to the modeled strain release in Table 7 with the following expression:
 |
16 |
Upon analyzing Figs. 16 and 17 concurrently, it becomes apparent that the relationship between tension force and strand borehole release strain is more pronounced in the FIRST P-T condition than in the FIRST T-P condition. This suggests that Eq. (9), which is utilized to forecast the effective prestressing force of the strand, possesses a significant degree of theoretical precision. Yuan Qin4 utilized the initial P-T approach to establish a correlation between the tension force and the release stress of the strand holes. However, meeting the initial need for pre-tensioning in real-world engineering is difficult unless the prestressed component is pre-tensioned prior to embedding the strand and strain gauges are utilized to detect the released prestress in the drilled hole. This technique is not consistent with the current implementation of this procedure.
Figure 18 illustrates the graphs depicting the correlation between strand tension and strain release under three distinct conditions: the initial P-T condition (Eq. 9), the initial T-P condition (Eq. 12), and the finite element simulation (Eq. 17). The curves described by Eqs. 12 and 17 demonstrate a greater level of closeness, while Eq. 9 deviates greatly from the other two curves. The study demonstrates that the traditional approach of utilizing strain gauges to quantify strain release and tension in the steel strand of a prestressed bridge in operation is invalid. The accuracy of strain release measurement is significantly influenced by the starting state of the strain gauges.
Figure 18.

Comparison of different calculation formulas.
Kirsch’s theory calculates the tension in the strand by considering it as a unified entity, leading to a significant discrepancy in the strain release coefficient from the actual condition and resulting in a significant error in the projected tension values. Numerical modeling has the ability to precisely depict the distinct composition of the strand and the interactions between the steel wires. Thus, employing numerical simulation to predict tension outcomes based on the tension-release stress curve produces a relatively accurate result.
The 1860 grade strand has a maximum tensile strength of approximately 260 kilonewtons (kN). However, to ensure safety, the tension applied to the project is often restricted to 75% of its maximum capacity, which is equal to 200 kN22. Figure 18 illustrates that as the tension force increases, the difference between the finite element simulation curves and the experimental fitting curves gradually decreases. Equation (12) is validated by this, indicating its accuracy.
To summarize, it is advisable to utilize the correlation between tension and strand borehole release stresses under T-P conditions for the purpose of forecasting strand prestressing. By simplifying Eq. (12), we can establish the correlation between strain release and tension in the prestressing strand:
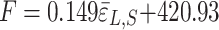 |
17 |
Conclusions
This study introduces a method for detecting the effective prestressing of strands in existing prestressed concrete bridges, specifically focusing on the problem of achieving precise detection. The method involves a blind-hole approach. The proposed methodology is applicable for bridges that are currently in use and is based on prior investigations. Based on theoretical analysis, finite element simulation, and inspection of test results, the following conclusions can be deduced:
According to Kirsch theory, there is a direct and proportionate relationship between the measured release strain of a steel strand and the axial tension. This relationship remains valid even taking into account elements such as strain gauge specifications, drilling size, a certain drilling depth, and without considering any actual errors.
The stress relief in steel strand intensifies with the rise in drilling depth and diameter. On the other hand, the reduction in stress relief is inversely proportional to the increase in hole side distance. Moreover, the error rate of stress release escalates when the drilling deflection angle of the steel strand varies between 0° and 15°. The portable electric drill features a drill bit with a diameter of 1.5 mm and is capable of drilling steel wire to a maximum depth of 5.0 mm. The axial distance from the hole’s edge for drilling the steel wire strand ranges from 3.0 mm. The drill additionally ensures that the angle of deflection while drilling is limited to 5°, thereby ensuring both accuracy and convenience of use during testing.
Variations in strain measurements at the same point can occur due to the uneven distribution of glue at the bottom of the strain gauge, the angle difference between the strain gauge and the axial direction of the single steel wire during pasting, the deviation in hole position when drilling the stranded wire, and the uneven friction between the stranded wires. More precisely, the disparity in strain measurements between points P and T is larger than the disparity between points T and P. Concerning a particular strain gauge, changes in the P-T and T-P processes will modify the sensitivity coefficient of the strain gauge, causing inconsistencies between P-T and T-P, finally resulting in disparities in P-T. The difference between the P-T and T-P processes will modify the sensitivity coefficient of strain gauges, leading to an increased value for strain release tests conducted under P-T conditions. The association between tensile force and strain release is stronger than that of T-P. However, P-T does not conform to actual engineering and shows a large divergence with the findings of finite element simulation. Therefore, it is recommended to use the suitable equation to calculate the tension in the strand and the strain that occurs when it is released in the T-P scenario.
Discussion
There are no publications in the publically available literature regarding the identification of efficient prestressing in steel strands utilizing the microvia method for practical engineering testing. The objective of this study is to definitively determine the method for detecting prestress in the strands of prestressed concrete bridges that are currently in operation. Nevertheless, there are unresolved concerns that must be resolved before implementing this detection technique for strands located deep within the girders of bridges.1. The calculations obtained from the theory of infinite perforated thin plates are inadequate for accurately examining the principle of strand stress release. Furthermore, there is a need for further improvement in the interactions between steel wires and their effect on the correction coefficient of the off-axis strain. 2. The existing finite element model for strand drilling stress release, unit deletion, and thermodynamic characteristics is highly straightforward. However, further research is necessary to better its knowledge and accuracy.3. The drill bit is delicate and vulnerable to breaking during drilling, and the rotation direction is prone to altering. In order to apply this detection technique to a real bridge, it is imperative to fabricate a collection of adaptable and functional specialist drilling apparatus.The results of this study are obtained by an examination of the 1 × 7–15.2–1860 steel strand model. The 15.2–1860 bare strand study has limits when applied to different types of strand. In addition, the boundary conditions for the exposed strand differ from those for the strand that is deeply embedded in the girder. Hence, additional theoretical and empirical investigations, together with appropriate detecting technology, are required. 5. The In-service bridge strand is incorporated into the girder. The objective is to accurately cut the concrete girder to reveal the internal pre-stressing strand, which poses a notable technological challenge. This method can be used to determine the optimal prestressing force of steel strands after reinforcing bridges from the outside of the structure.
Electronic supplementary material
Below is the link to the electronic supplementary material.
Acknowledgements
The first author is grateful to Yunnan Tongqu Engineering Testing Co., Ltd. for providing continuous support and necessary technical assistance for this project.
Author contributions
writing—original draft preparation, J.Z.Y.; writing—review and editing, J.Z.Y., S.C.C., C.Y.D., M.H and W.X.W.; project administration, S.T.Y.; funding acquisition, L.P.N., All authors have read and agreed to the published version of the manuscript.
Funding
This research was funded by the Research on Effective Prestress Detection Technology of PC Bridge Steel Bundle Based on Microcellular Stress Relief Method (grant numbers Yunnan Traffic Science and Education [2020] No. 91).
Data availability
The data that support the findings of this study are available on request from the corresponding author, upon reasonable request.
Declarations
Competing interests
The authors declare no competing interests.
Footnotes
Publisher’s note
Springer Nature remains neutral with regard to jurisdictional claims in published maps and institutional affiliations.
Contributor Information
Jianzhou Yun, Email: yunjianzhou2022@163.com.
Shunchao Chen, Email: csc99@163.com.
Chunyan Dong, Email: dongchunuan@163.com.
References
- 1.Chen, J. H. et al. A Constitutive Model to Reveal the Anchorage Mechanism of Fully Bonded Bolts. Rock Mech. Rock Eng.56(3), 1739–1757. 10.1007/s00603-022-03160-8 (2022). [Google Scholar]
- 2.Li, J. Y. et al. Experimental Study on Prestressing Force of Corroded Prestressed Concrete Steel Strands. J. Adv. Concrete. Technol.20, 550–563. 10.3151/jact.20.550 (2022). [Google Scholar]
- 3.Li, F. M., Yuan, Y. S. & Li, C. Q. Corrosion propagation of prestressing steel strands in concrete subject to chloride attack. Constr. Build. Mater.25, 3878–3885. 10.1016/j.conbuildmat.2011.04.011 (2011). [Google Scholar]
- 4.Lou, G. B. et al. Prestress loss of twisted wire strands and parallel wire strands at elevated temperatures. Eng. Struct.10.1016/j.engstruct.2023.116483 (2023).
- 5.Wang, Y. H. Achievements current situation and existing problems of bridge construction in China. Highway. 0451-0712(2004)12-0155-03.
- 6.Tang, W., & Zhang, H. Research on effective prestressing detection method for in-service prestressed structures. Technol. Innov. Appl. 2095-2945(2020)05-0135-02.
- 7.Zhang Zhiguo, Wu. et al. Identification of effective prestress of steel strand based on blind-hole method. J. Railway.45(08), 166–175. 10.3969/j.issn.1001-8360.2023.08.018 (2023). [Google Scholar]
- 8.Guo, W. L. et al. An evaluation method for effective prestress of simply supported prestressed concrete beams with breathing cracks. Adv. Civ. Eng.10.1155/2021/8876093 (2021).
- 9.Yuan Q. Research on detecting the effective prestress of prestressed strand by using blind-hole method. Harbin Institute. Technol. 27–32 (2018).
- 10.Wu, W. et al. Numerical Simulation and Experimental Study on Detecting Effective Prestress of 1860-Grade Strands Based on the Drilling Method. Coatings.13(11). 10.3390/coatings13111869 (2023).
- 11.Liu, X. H. et al. Strain Releasing Factor Amendment of Hole Edge under the Yield Status. Foundry. Technol.31(1), 36–39 (2010). [Google Scholar]
- 12.Yan, S. Z., Yu, X. J. & Wang, Y. M. A new method for calibration of release coefficient in residual stress measurement. J. Jilin. Univ. Technol. 25(02), 49–54. 10.13229/j.cnki.jdxbgxb1995.02.008 (1995).
- 13.General Administration of Quality Supervision, Inspection and Quarantine of the People’s Republic of China, Standardization Administration of the People’s Republic of China. Steel Strand for Prestressing of Concrete: GB/T 5224—2014. Steel Strand for Prestressing of Concrete: GB/T 5224—2014 (Standards Press of China, Beijing, 2015). [Google Scholar]
- 14.General Administration of Quality Supervision, Inspection and Quarantine of the People’s Republic of China, Standardization Administration of the People’s Republic of China. Steel Wire for Prestressing of Concrete: GB/T 5223—2014 (Standards Press of China, Beijing, 2015). [Google Scholar]
- 15.Jiang, J. W., Deng, N. C. & Gou, X. Finite element simulation of section stress of 1860-grade steel strand. Chin. Sci. Paper.16(02), 193–198198+ 204. 10.3969/j.issn.2095-2783.2021.02.011 (2021). [Google Scholar]
- 16.Guo, X. B. et al. Research on existing stress measurement method of strands for prestressed concrete structures. Ind. Constr.46(01), 80–83+ 94. 10.13204/j.gyjz201601016 (2016). [Google Scholar]
- 17.Liu, L. J., Zhang, J. & Zhang, X. Y. Fine analysis of wire breaking effect of grade 1860 steel strand. Chin. Sci Paper.17(02), 161–166 (2022). [Google Scholar]
- 18.Boyuan, Yang. Effect of drilling eccentricity on relaxation strain and residual stress. Mech. Pract. (03), 33–37 (1988).
- 19.Wang, J. Y. Analysis of the error caused by eccentric drilling when calculating residual stresses with the center drilling formula. Abstracts of the scientific symposium of Harbin University of Science and Technology, (S1), 117 (1985).
- 20.Sandifer, P. J. & Bowie, E. G. Residual stress by blind-hole method with off-center hole. Exp. Mech.18(5). 10.1007/bf02324138 (1978).
- 21.Zhang, J. P. Bridge Inspection and Repair and Reinforcement (People’s Transportation Press, 2011). [Google Scholar]
- 22.Ministry of Transport of the People’s Republic of China. Specifications for Design of Highway Reinforced Concrete and Prestressed Concrete Bridges and Culverts: JTG 3362 − 2018 (People’s Transport Publishing House Co, Ltd, 2018). [Google Scholar]
Associated Data
This section collects any data citations, data availability statements, or supplementary materials included in this article.
Supplementary Materials
Data Availability Statement
The data that support the findings of this study are available on request from the corresponding author, upon reasonable request.