Abstract
Medical image machines serve as a valuable tool to monitor and diagnose a variety of diseases. However, manual and centralized interpretation are both error-prone and time-consuming due to malicious attacks. Numerous diagnostic algorithms have been developed to improve precision and prevent poisoning attacks by integrating symptoms, test methods, and imaging data. But in today’s digital technology world, it is necessary to have a global cloud-based diagnostic artificial intelligence model that is efficient in diagnosis and preventing poisoning attacks and might be used for multiple purposes. We propose the Healthcare Federated Ensemble Internet of Learning Cloud Doctor System (FDEIoL) model, which integrates different Internet of Things (IoT) devices to provide precise and accurate interpretation without poisoning attack problems, thereby facilitating IoT-enabled remote patient monitoring for smart healthcare systems. Furthermore, the FDEIoL system model uses a federated ensemble learning strategy to provide an automatic, up-to-date global prediction model based on input local models from the medical specialist. This assures biomedical security by safeguarding patient data and preserving the integrity of diagnostic processes. The FDEIoL system model utilizes local model feature selection to discriminate between malicious and non-malicious local models, and ensemble strategies use positive and negative samples to optimize the performance of the test dataset, enhancing its capability for remote patient monitoring. The FDEIoL system model achieved an exceptional accuracy rate of 99.24% on the Chest X-ray dataset and 99.0% on the MRI dataset of brain tumors compared to centralized models, demonstrating its ability for precision diagnosis in IoT-enabled healthcare systems.
Keywords: Federated Ensemble Modeling, CXR, MRI, Internet of things, Medical imaging, Cloud server, Medical Data Security, Biomedical Image Processing, Deep learning
Subject terms: Diseases, Health care, Engineering
Introduction
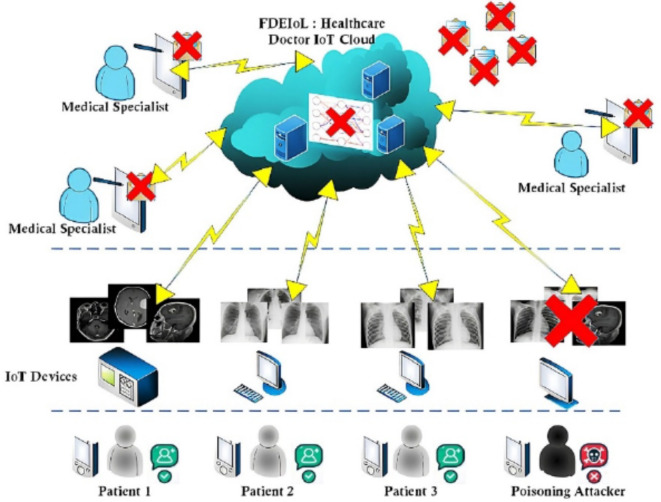
Industry 4.0 has seen significant enhancements in cloud computing technology, significantly influencing the healthcare System in many ways. Cloud-assisted Internet of Things (IoT) has become an efficient system provider in healthcare systems as it offers diagnosis and treatment in improved and fashionable ways1. Cloud-assisted IoT enables the secure generalized transfer of critical medical data; thus, innovative IoT-based remote patient monitoring systems have a broad application in smart healthcare organizations2. Many of these systems have been found to play a crucial role in increasing the level of security, the rate of care delivery, and the quality of outcomes. However, it is imperative to prevent poisoning attacks that can be uploaded to the cloud from an unknown source, as depicted in Fig.1
Fig. 1.
Malicious attacks on the IoT cloud system paradigm for healthcare.
The main goal of remote patient monitoring in smart healthcare systems through IoT technology is to raise people’s quality of life by increasing access to appropriate, affordable, and quality healthcare. However, the increased adoption of these technologies has brought new problems, especially in data security and the possibility of poisoning attacks where some unknown user may upload wrong data to the cloud. These threats highlight the importance of strong biomedical security policies to safeguard patient information and guarantee the stability and availability of healthcare services. Some of the diseases include chest diseases, which, along with other severe illnesses such as brain tumors, still kill millions of individuals annually who do not have access to proper health care or experienced professionals3. With the current crisis in global healthcare made worse by the SARS-CoV-2 virus, even the most sophisticated healthcare delivery systems are under pressure4. The high rate of people seeking medical attention has led to challenges in early detection and treatment of such conditions as new strains of COVID-19 and rapid-growing brain diseases like glioblastoma5.
Therefore, privacy, security, reliability, and accessibility of the patient data that is transmitted through IoT-based remote monitoring systems have become a significant concern. However, several challenges persist in comprehensively integrating medical imaging techniques that present potentially accurate and less expensive methods of diagnosing diseases as an optimal solution6,7. Manual evaluation of medical images is not effective in terms of time, and specialized medical professionals are scarce worldwide, especially in developing nations8. While X-ray diagnostics is cheaper and computed tomography (CT) scans are more widespread, they may take days to return values, as images have to be sent to specialized centers to be read. This delay can be crucial, especially in areas with limited qualified radiologists who can analyze the images. Accurate analysis of medical images is highly significant in identifying diseases at early stages9and initiating the treatment and management process10. To address this, more attention has been paid to the use of deep learning (DL) approaches in recent years. These techniques can predict diseases from medical images with high accuracy within a short time11. However, the problem lies in finding a feasible way in which an assisted IoT-based DL model can analyze the medical images quickly and ensure that security is not compromised12,13.
New approaches have also been proposed regarding the framework for medical image analysis leveraging IoT and Deep Convolutional Neural Network (CNN)14–16. Even so, some drawbacks remain. As mentioned above, these models have potential. In particular, they are challenged when assessing new diseases and are receiving poisoning attacks by other local models. It is desirable to build a model to help predict various diseases that encounter these barriers, but when integrating the global model, it can only accept accurate, fraud-free data. Smart healthcare systems are as effective and precise for medical image analysis if they are connected to high-grade biomedical security measures. This integration ensures early diagnosis and start of treatment of diseases, especially in developing regions with few doctors. In this paper, we present the new healthcare federated ensemble Internet of Learning cloud doctor system (FDEIoL) model that can enhance the accuracy and security of using IoT for rural patient monitoring in smart healthcare systems. Table 1 illustrates the performance of our proposed system with state-of-the-art approaches, while Fig. 2 demonstrates a detailed description of the present study. The main contributions of the present research are as follows:
Table 1.
Comparison of the proposed approach with state-of-the-art diagnostic algorithms.
| Criteria | FDEIoL | Algorithm A (e.g., Deep Learning Model) | Algorithm B (e.g., Centralized Model) | Algorithm C (e.g., Hybrid Model) |
|---|---|---|---|---|
| Efficiency | High: Utilizes edge computing for real-time processing and federated learning for scalability. | Medium: Requires high computational resources for large datasets. | Low: Centralized processing with significant latency. | Medium-High: Hybrid approach with some decentralization. |
| Accuracy (CXR Data) | 99.24% | 98.5% | 97.2% | 98.8% |
| Accuracy (Brain Tumor Data) | 99.0% | 98.2% | 96.7% | 98.4% |
| Resistance to Attacks | High: Incorporates federated learning, secure aggregation, and anomaly detection. | Medium: Vulnerable to adversarial attacks, limited defenses. | Low: High vulnerability due to centralized data storage. | Medium-High: Some resistance due to hybrid model structure. |
| Scalability | High: Scales efficiently across multiple IoT devices and data sources. | Medium: Limited by centralized processing power. | Low: Scalability issues due to centralization and bandwidth limitations. | Medium: Partially scalable but constrained by centralized components. |
| Data Privacy | High: Data remains decentralized with federated learning, enhancing privacy. | Medium: Requires significant data aggregation, potential privacy concerns. | Low: Centralized data storage poses high privacy risks. | Medium-High: Hybrid structure offers some privacy protection. |
| Data Privacy | High: Data remains decentralized with federated learning, enhancing privacy. | Medium: Requires significant data aggregation, potential privacy concerns. | Low: Centralized data storage poses high privacy risks. | Medium-High: Hybrid structure offers some privacy protection. |
| Model Update Frequency | High: Continuous updates from local models ensure an up-to-date global model. | Medium: Requires periodic retraining for updates. | Low: Infrequent updates due to centralized retraining needs. | Medium: Hybrid model allows for moderate update frequency. |
Fig. 2.
A detailed description of the present study.
We propose a novel Federated Learning (FL) ensemble model that aims to improve disease diagnosis accuracy in patients under the IoT-based remote monitoring system. Chest X-ray (CXR) and Magnetic Resonance Imaging (MRI) are used in the proposed model because they are better at detecting lung infection and brain matter damage compared to other imaging techniques. Our system can also provide a high level of biomedical security through the backend features of the pre-trained local models and fine-tuned global models. The FL ensemble approach shows feasibility and a novel contribution in medical image processing to differentiate the malicious from non-malicious local model features, which enhance the trustworthiness and efficiency of remote patient monitoring for sophisticated healthcare systems.
The FDEIoL system model reveals significant gains in terms of data integrity and dependability of IoT-supported remote supervision systems in smart healthcare. One of the benefits derived from our model is the reduction of false positives and false negatives, resulting in improved feasibility of biomedical security. This success is due to the FL ensemble techniques and proper feature selection, which solves a significant problem in medical diagnosis.
The proposed FDEIoL system model has been benchmarked against the best DL ensemble models and state-of-the-art local classification models. This method demonstrates a 99.24% accuracy rate on the CXR dataset, while a 99% accuracy rate for the MRI dataset makes them more effective in biomedical security and efficient remote patient monitoring compared to other models. This is even a step up from identifying disease indicators from early cloud-based IoT technologies.
The remainder of this paper is structured as follows: Sect. 2 provides an in-depth review of related work in the field, highlighting key developments and identifying gaps that our research aims to address. Section 3 elaborates on the methodology employed in developing and implementing the FDEIoL system model, detailing the technical aspects of the FL ensemble approach. Section 4 presents the experimental results, showcasing the model’s performance metrics and comparing them with existing methods. Section 5 delves into the results and thoroughly discusses the implications of our findings. Finally, Sect. 6 concludes the paper by summarizing the key contributions and outlining potential directions for future research.
Related works
Recent research in medical image analysis demonstrates that DL and Machine Learning (ML) models enhance computer-aided diagnosis for MRI and CXR images for disorders such as Coronavirus Disease 2019 (COVID-19), as shown in Table 2. On the other hand, unexpected diseases have appeared throughout time, such as JN.15. The primary symptoms of COVID-19, or JN.1, include headaches, muscle discomfort, coughs, frequent colds, periodic fevers, and breathing difficulties in certain vulnerable cases17. ML and DL models are used to mitigate potential risks to human life18,19. Research on COVID-19 intensified in 2021 compared to 2020. We recommend several books for more in-depth information on COVID-19 screening20. Studies have utilized various approaches to detect COVID-19. For instance, this study21presented a novel definition of cluster-based one-shot learning to identify COVID-19 cases. Das et al22. used a pre-trained CNN model to find patients with COVID-19 positive. Mukherjee et al23,24. used CT scans and CXRs to find the diseases. Other studies, such as25–28, have used fuzzy color and stacking methods alongside DL models. Moreover, deep transfer learning is another prevalent technique29,30, with some authors reporting accuracy above 98%. Specific DL models such as DarkCovidNet and CoroDet have also been suggested31,32for early disease identification. Due to the diversity of data sets, the results of each study may vary. For further information, the researchers recommend the importance of big data in medical imaging for COVID-1933. The researcher of34discussed various security concerns related to the implementation of FL in different IoT applications. They emphasized FL’s local and collaborative aspect, which enables AI models to be trained locally on IoT devices without full data exchange. In their study, they stress the need to address these issues in the context of real-world applications in encrypted data communication. The scholar of35provided a literature survey of the published studies regarding IoT-based healthcare devices and how 5G and mobile edge computing improve patient outcomes. They covered how these technologies benefit healthcare and explained some real-life issues surrounding decentralized computing solutions, especially medical IoT devices. In36, researchers emphasized the need for the appropriate selection of features to optimize the performance. In37, researchers investigated the effect of image enhancement on tuberculosis (TB) detection. Ensemble learning techniques for the detection of TB in CXR using hybrid feature descriptors were presented in38. The study in39focuses mainly on removing possible sources of bias in computer-assisted CXR analysis for pulmonary TB. In40, DL techniques were applied to identify TB using CXR, achieving an accuracy of 94. 73% and 98. 6%. The study41employed deep CNNs for detecting TB in CXR images. The writers of42proposed a machine vision system for diagnosing TB on lung CT scan images based on statistical texture characteristics. They decided on the six most optimized features and tested the various supervised learning classifiers, with the multi-layer perceptron having the highest accuracy at a perfect 99%. In43, researchers explored DL methods and automated CXR analysis to aid medical professionals in diagnosing COVID-19. The COVID DeepNet system has been introduced for precision assessment to assist radiologists with image interpretation44. In45, the authors proposed a software-defined fog structure for healthcare applications in IoT and presented an optimization model for enhancing the fog node usefulness. The authors applied the Lagrangian approach and the Karush Kuhn Tucker conditions to solve the problem and obtained a substantial improvement in delay and energy compared with the benchmark approach. In46, researchers used deep transfer learning with a variety of pre-trained models, such as MobileNetV3 and InceptionV3, and reported an accuracy of 98.43%. Moreover, AlexNet is used to distinguish between COVID-19 and other types of Pneumonia (PNA)47. We often find that transfer learning techniques using pretrained models such as VGG16, GoogLeNet, and ResNet-50, among others, are commonly used for these applications. As for health monitoring in the metaverse, the authors in48 created an extensive framework that involved IoT sensors, augmented reality, and virtual reality. They used the best encryption standard of 256-bit Advanced Encryption Standard to protect the data. They show how the framework has a lot of potential in improving the quality of remote patient monitoring while sustaining confidentiality.
Table 2.
DL frameworks for analyzing and recognizing brain tumors and covid-related behaviors, as well as identifying, classifying, and detecting different sorts of Covid and Brain tumors cases.
| Previous Work | Methods | Objective | Dataset | Performance Measures |
|---|---|---|---|---|
| I. D. Apostolopoulos et al. [63] | VGG-19, Mobile Net, Inception, Xception, and Inception_ResNet_V2 | Detecting Covid-19 from X-ray images | 1427 X-ray Images | Accuracy = 98.75% |
| A. Shelke et al. [64] | DenseNet-161 | Diagnosis of COVID-19 from CXR images | 2271 CXR Images | Accuracy= 98.9% |
| A. Narin et al. [25] | ResNet50, Inception_V3, and Inception ResNet_V2 | Detection Coronavirus Infection in CXR images | 5064 CXR Images | Accuracy= 98% |
| L. Duran-Lopez et al. [26] | Inception-v3 | Covid-19 Patients Classification using CXR images | 2589 CXR Images | Accuracy = 98.8% |
| N. N. Das et al. [27] | Alex Net, DenseNet121, Inception_V3, ResNet18, and Google Net | Covid-19 Patients Classification using CXR images | 5232 CXR Images | Accuracy= 96.4% |
| M. Wo´zniak et al. [65] | CLM+CNN | Brain tumor detection from CT Brain Scan images | 3064, CT Brain Scan Images | Accuracy = 97.5%, Sensitivity = 95.6% and Specificity =96.21% |
| M.R. Obeidavi et al. [66] | Residual Network | Brain Tumor detection from MRI images | BRATS 2015 Dataset, 2000 MR Images | Accuracy = 97.05% and BF Score = 57.02% |
| Anantharajan S et al. [67] | END-SVM | Detection of Brain Tumor from MRI Images | MRI images | Accuracy= 97.93%, Sensitivity = 92% and Specificity =98% |
| Hao R et al. [68] | AlexNet | Classifying MRI images | 2019 BRATS | AUC= 82% |
| Rahman T et al. [69] | PDCNN | Brain tumor detection and classification using MRI images | MRI Images | Accuracy = 97.33% and Cohen’s Kapp = 0.944 |
| Proposed FL ensemble Work |
¬ Non-priority-Vote: HincV3XGBoost, LT-ViT, BM-Net, VGG-SCNet, MEEDNets, ResGANet ¬ Priority Vote: ResGANet and CE-EEN-B0 |
Classifying into Covid-19, TB, PNA, and healthy individuals using CXR images as well as Glioma, Meningioma, Pituitary and no tumor using MRI images. | 7000 CXR, 6420 MRI Images | Accuracy = 99.24%, Error Rate = 0.0076, Cohen’s Kapp = 0.9967 and Average F1 Score = 0.995 for CXR Dataset. For MRI dataset, Accuracy = 99%, Error Rate = 0.01, Cohen’s Kapp = 0.97 and Average F1 Score = 0.995 |
Furthermore, in49, researchers presented the integration of fuzzy logic with CNN to find glioma in brain tumor images. However, the model is computationally very expensive. Similarly, in50, an ensemble model with five DL models is introduced, which is not practical to implement on the cloud server for real-time use in binary classification. Moreover, the model is not trained with multi-disease classifications. The authors51proposed a DL technique integrated with blockchain to maintain the privacy of the Electronic Health Record. They employed a CNN for user categorization and deployed blockchain with a cryptography-based FL module to handle and protect the information. The model was implemented in Python, and the results obtained were superior to those of the existing methods. In52, the researchers used a CNN with a support vector machine for glioma classifications. The authors53proposed a technique for constructing the classifier ensembles using an algorithm known as Dynamic Programming-based Ensemble Design (DPED). In the first phase, DPED applies cooperative game theory to down-select from the more extensive set of detected ensembles, while in the second phase, the accuracy and diversification are increased by using a dynamic programming approach to decrease the size of the ensemble. It was compared with classical ensembles and the ‘most diverse’ algorithm in terms of accuracy and the number of classifiers in the ensemble, and it was found to have higher accuracy and smaller enrollment sizes across different data sets. The authors54employed an integrated meta-heuristic algorithm to derive the input coefficients of a trained neural network. They benchmarked the proposed algorithm with other algorithms, such as ant colony and invasive weed optimization and determined that their approach offered lower prediction error and better convergence. The authors55presented the concept of the physical realization of a Deep Neural Network (DNN) with integrated analog/digital techniques, using very large-scale integration with pulse width modulation and analog/digital circuits to minimize power consumption while optimizing image classification. This paper56introduces a dynamic fusion FL framework model that undergoes evaluation using two techniques: FedAvg and FedFocus. The authors utilized a generative adversarial network (GAN) in57 to generate actual COVID-19 images. The objective was to improve privacy in COVID-19 detection by employing GANs in edge cloud computing. They then applied this approach to a FL technique known as FedGAN.
However, most of these models are typically limited to binary classification or are computationally expensive, distinguishing between healthy and non-healthy conditions. Due to the feature-learning approach, even these models are not feasible for the new diseases and are precarious for prolonged use in real-time. Therefore, we must design a composite model that ensembles the features of two models with a precise selection of layers for feature learning and provides an optimal level of precision in healthcare with low computation. Moreover, it is essential to prevent anomalies that can lead the ensemble model to make the wrong prediction. The authors of58employed a quantum ML (QML) model to forecast heart issues and compared classical classifiers, namely SVM and QML models, including quantum neural networks and quantum SVM(QSVM). They also created and implemented the Bagging_QSVM model, which optimized all the performance measures to the 100% level. The researcher of59presents the classification of both X-ray and MRI images as important for disease diagnosis, patient care, and health outcomes. Distributed learning models with multiple interconnected networks can increase the accuracy and robustness of image classification. These models use collective knowledge from various institutions or data sources to allow more diversity for training datasets. In addition, distributed learning is good for tackling data privacy and regulatory issues since it will allow locally sensitive patient information to be stored and processed while contributing to the global model. In60, the writer presents an approach that involves splitting a neural network between the client (e.g., a hospital) and the server so that sensitive data can be processed locally while still contributing to the global model. This technique has been successfully applied to binary classification problems in fundus images and multi-label classification tasks in CXRs and MRI, showing performance comparable to centralized models while maintaining data privacy. Distributed learning essentially depends on the ability to manage data heterogeneity across multiple sites61,62. This is particularly relevant to the case of MRI and X-Ray, where nuisance factors caused by the hardware, acquisition protocols, and patient populations are likely to be dramatically different between scanner machines. One of the solutions that has arisen to meet this challenge is data augmentation strategies that simulate the effect of multi-scanner variability during training, which improves the generalization of learned representations to new data sources.
System model
The advancements in smart healthcare systems make the proposed system as accurate and secure for diagnostics. Current diagnostic methods are mainly based on traditional approaches, including manual analysis and centralized structures, which may not be efficient due to errors and delays, especially when the systems that implement the diagnostic are under cyber-attacks such as data poisoning attacks. Vulnerabilities, for example, may lead to unreliable diagnostic results, posing severe risks to the safety of the patient. Our proposed system also pointed out that they are mostly centralized, which slows the processing time of the systems. This problem is an always-looming problem of laxity in security that is prevalent in healthcare facilities. According to these challenges as mentioned earlier, the proposed FDEIoL system connects multiple IoT devices to one system, resulting in a more accurate and secure diagnosis. It uses the federated ensemble internet of learning technique, the latest method of deploying multiple local models, built from different data sets, to develop a comprehensive global model. This approach keeps the data decentralized, which is a major boost to the security of data since the risks associated with data leakages and patients’ privacy are reduced.
In the FDEIoL system, FL enables each IoT device, such as wearable health monitoring devices or diagnostic equipment, to build the local model from the collected data. The first involves local models shared across the network, but the data is not readily transferred to other regions to protect the patient’s identity. The final component of this system is the ensemble learning component, which integrates all the local models as mentioned earlier to produce the global prediction model. It is also more powerful since it incorporates both positive and negative samples in the learning process. It can make a more accurate and sound diagnosis depending on the data. Our proposed method demonstrates exceptional performance, achieving 99. 24% accuracy on CXR images and 99% accuracy on MRI images, significantly outperforming traditional centralized approaches. This confirms the effectiveness of our proposed model in precision diagnosis within smart healthcare systems.
Processing and analysis
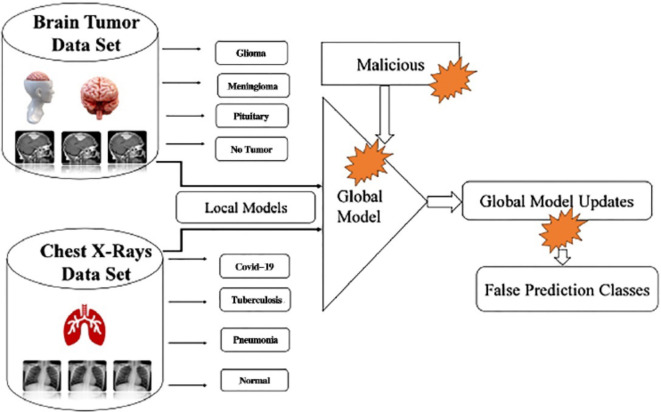
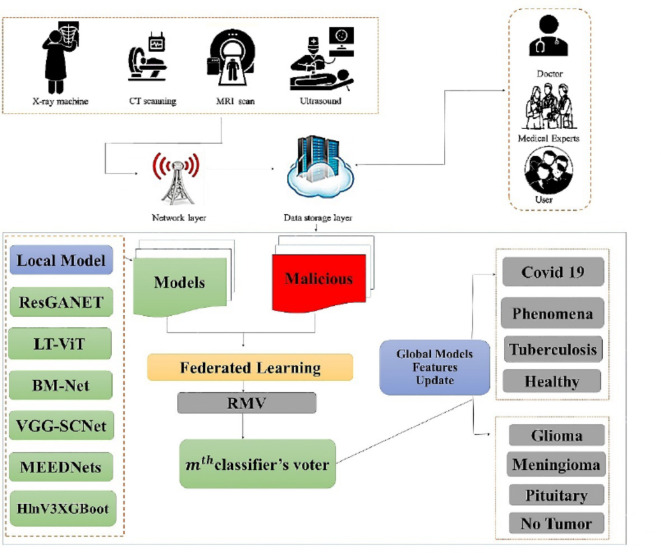
At the time of inception, the FDEIoL system model is divided into different divisions. The server, which receives medical images from IoT devices that result in false detection, is responsible for uploading both malicious and non-malicious local models, as shown in Fig. 3. First, reliability and scalability are key factors when deploying DL models in real-time IoT cloud server systems. Ensuring the receipt of accurate and security, reliable data has implications for healthcare-oriented system updates. Sometimes, the system receives an incompatible malicious local model, which might lead to unexpected run-time problems manifesting as anomalies in data receiving and resulting in false prediction. These factors arise as a consequence of the unpredictable volumes of requests for malicious local models from different IoT devices to the cloud server.
Fig. 3.
Design and implementation of an innovative Cloud-Based FL framework for enhanced medical image diagnosis: leveraging Cloud Computing technologies for efficient storage, processing, and collaboration in the analysis of medical images.
Noise elimination
The data preparation phase in this section involves meticulous procedures to refine the data, like checking the noises. For noise elimination, we use median and mean filters to eliminate noise and artifacts in the FDEIoL system model. The median and mean filtering approaches are usually employed for noise removal and effectively eliminate several types of noise, including salt and pepper, Gaussian, and random noises. Moreover, data augmentation is used with diverse and limited variations of health image data, enhancing the DL model’s resilience and mitigating overfitting. A Mean Filter (MF) replaces each pixel value in an image I (z, x) with the average value of itself and its neighboring pixels I (z + i, x + j) using Eq. (1).
 |
1 |
Where M is equal to the product of k and l, where k and l are positive odd integers.
The median filter is a type of nonlinear filter that is used to remove noise from images. Analyzing its mathematical properties can be complicated, especially when dealing with images with random noise. However, when the noise in an image follows a normal distribution with a mean of zero, the variance of the noise after applying the median filter can be approximated.
 |
2 |
The variable  in above equation represents the power of the input noise, specifically its variance. The variable n represents the size of the median filtering mask. The variable
  represents the function of the noise density. The noise variance of the average filtering is
 |
3 |
Federated ensemble internet of learning system model
Federated learning
The FDEIoL system model must be able to increase and decrease its capacity to meet latency requirements while reducing costs and resulting in accurate prediction. Moreover, system models must prioritize handling data errors as an integral feature of all local models. At this point, we utilize FL with non-linear aggregation that offers advantages in real-time systems as the primary input for automated processes that operate with health data and enable self-sustaining feature discrimination between poisoning and non-poisoning. Furthermore, FL with non-linear aggregation is a relational entity that provides a clear overview of the features associated with health local data models and malicious models. The data contains the feature and its local previous model behavior. FL with non-linear aggregation enables the distribution of weights and biases of ensemble features across local models at regular intervals to develop and update a global model that is available to all local models.
Domain adaptation
After FL with non-linear aggregation, we used domain adaptation, which supports FL, to leverage the features and weights of an existing model to adapt it for a new task70at a more advanced level. The pre-trained model has often been trained on a large labeled dataset for a related task, such as image classification. The learned features of this model provide an advantage when addressing a new related task with a smaller dataset71. Domain adaptation proves particularly beneficial when there is a limited data-based local model for the new task to update the global model. This is because the pre-trained model has already acquired useful feature representations from its original training72. To avoid the problem of vanishing gradients (VG), we use ResGANet73as the VG priority model, which tackles the problem of VG in deep networks by using residual blocks for the FL global model updates. Moreover, to enhance efficiency and accuracy, the CE-EEN-B074model family enhances efficiency and accuracy by harmonizing model depth, width, and resolution through a compound scaling strategy (CSS)75, and we use it as a CSS priority model.
FL ensembling
An ensemble system integrates multiple classification algorithms for local models to function as a unified classifier for the global model, prioritizing VG and CSS rather than relying on every single model local file as a classifier to update the global model without any priorities. The logic behind this is that ensemble DL algorithms possess greater flexibility and adaptability compared to individual algorithms and local weighted trained models. Ensemble systems surpass individual DL algorithms in local weight priority due to their superior adaptability and flexibility. All local classifiers influence the ensemble method’s outcome due to the weighted priority prediction of each algorithm utilized in the ensemble for the global model. Furthermore, a voting classifier, which is an ensemble technique, combines the predictions of multiple local models’ weights by using a majority vote. The fundamental idea is to construct a consolidated FL ensemble model instead of creating general classifier global models. The models employed in the voting FL ensemble generate reliable predictions. Using multiple models in an ensemble is more efficient and enhances its performance. In our research, we utilized the hard voting technique, which combines the predictions made by each local model. In this approach, the test samples are categorized according to the class that gets the highest number of votes and given priority to VG and CSS. It has been employed as a means of merging and is commonly known as the plurality vote, except for VG and CSS. Mathematically, it can be stated as.
 |
4 |
Whereas the term (x) represents the classification performed by the th classifier, while g (y, c) represents the operation as follows:
 |
5 |
To get the classification  using probabilistic classifiers, we can follow the step as follows:
 |
6 |
In this scenario, is used to denote the classifier, while  denotes the probability of class
  given an instance
  . A voting approach was utilized in the research to evaluate ensemble systems, and the findings consistently show that ensembles comprising many models consistently outperformed individual models in terms of performance. Similarly, the proposed approach utilizes many supplementary local models classified by including them into a unified global model, resulting in a more efficient model than individual models without voting for the global model. Our approach involved utilizing ResGANet and CE-EEN-BO Classifier local models as the core classifiers to prevent vanishing and harmonizing model depth, width, and resolution issues. We obtained the findings by employing hard and weighted voting techniques. The voting criteria can be described in the following general terms:
 |
7 |
 |
8 |
The predictions produced by CE-EEN-B0 and ResGANet are designated by the initials CE-EEN-b0 and resGANet, respectively. Further analyses are conducted in the following manner:
 |
9 |
 |
10 |
where  represents the prediction produced by the two classification algorithms (CE-EEN-B0 and ResGANet) using a majority vote approach.
  represents the estimation made by the two predictive models based on the probability of the outcomes. The proposed method, denoted as
  , calculates the ultimate prediction by combining weights
  and
and  with their respective predictions
  and
and  .
.
 |
11 |
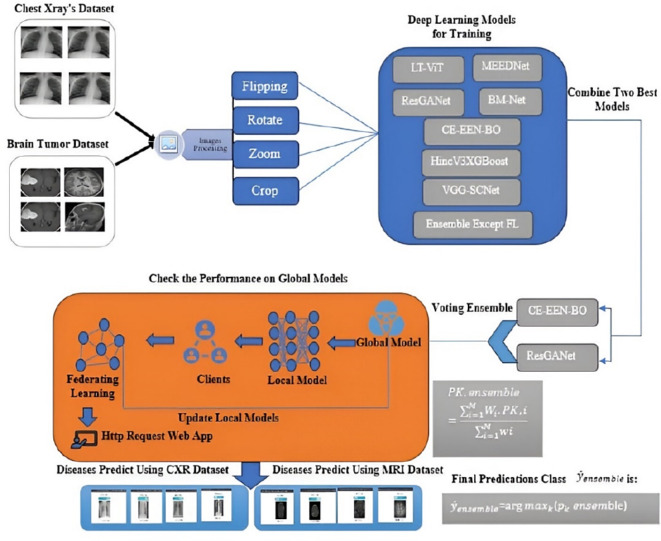
The proposed advance FL ensemble algorithm is given as Algorithm 1. The Fig. 4 shows a flowchart of the overall DL algorithms local weights employed on CXR and MRI datasets in our article to classify them correctly and precisely.
Fig. 4.
Illustration of the overall Federated Ensemble Internet of Learning models for CXR and MRI of Brain Tumor images classification.
Algorithm 1
Advance FL Ensemble Algorithm.
| The proposed Advance FL Ensemble Algorithm |
|---|
Required: Annotated trained local models 
|
| Ensure: Decision via advanced FL ensemble method |
Initialization: Assign initial weights to samples 
|
for

|
1. Train the classifier using the weighted training local sets using the weighted training local sets |
|
2. Evaluate the error
|
|
3. Determine classifier weight
|
|
4. Update sample weights:
|
|
5. Normalize Weight:
end for |
| FL Ensemble Model Decision: |
|
1. Combine local model classifiers using a non-linear aggregation rule: For each class
where
|
|
2. Assign the test sample
|
Experimental results
The FDEIoL system model underwent rigorous testing for many months, utilizing projects conducted by our research department. The main objective was to confirm the initial goal of developing a user-friendly platform that is not dependent on advanced expertise and validating its compatibility with IoT devices, ensuring that an average user can effectively utilize the entire solution without facing technical difficulties or performance degradation.
We evaluated the performance of different DL methods in recognizing four distinct classes, including Normal Lung Conditions and no tumor conditions, using CXR and MRI image datasets, respectively. We used VGG-SCNet76, MEEDNets77, HIncV3XGBoost78, SBXception79, LT-ViT80, MB-Net81, ResGANet, and CE-EEN-B0 local weights for validation and comparison of the proposed FDEIoL system model.
Experimental setting
The proposed method was implemented offline using TensorFlow support on the Python 3.7.1 platform. The experiments are carried out on a personal computer equipped with an NVIDIA GeForce RTX-3070 GPU, 32GB of RAM, Ubuntu, and the CUDA 11.0 toolkit, complemented by cuDNN v8.0. The experimental results demonstrated the effectiveness of the proposed FL ensemble method. After extensive offline experimental evaluation, the model was deployed on the server to connect the IoT device and send data from different devices for a long time to check the performance of the FDEIoL system model. Empirical findings confirm the efficacy of the proposed FDEIoL system model compared to the Local models and other general ensemble DL models.
Dataset
It is important to understand the nature and organization of the primary data collection used in our research efforts, which is shown in Tables 3 and 4. We used two different datasets to check the model’s performance using real-time evaluation parameters, i.e., the F1 score and Cohen’s Kappa. Table 3 contains medical images of the CXR dataset that depict several pulmonary disorders, specifically PNA, COVID-19, TB, and normal. Table 4 contains Brain Tumor medical images that depict several brain tumors, specifically Glioma, Meningioma, Pituitary and No tumor. 80% of images of CXR and Brain Tumor datasets are given to the training set and 20% of images are given to the testing set, as shown in Tables 3 and 4. The number of images provided to each class is carefully determined, allowing for a detailed understanding of the complexities of the dataset. The classification of images into training and testing sets is an important aspect of our experimental design, facilitating the development and assessment of DL models.
Table 3.
Detail description of the CXR dataset.
| Classes | Number of Images | Training Set | Testing Set |
|---|---|---|---|
| PNA | 1750 | 1400 | 350 |
| COVID-19 | 1750 | 1400 | 350 |
| TB | 1750 | 1400 | 350 |
| Normal | 1750 | 1400 | 350 |
| Total Images | 7000 | 5600 | 1400 |
Table 4.
Detail description of the brain tumor dataset.
| Classes | Number of Images | Training Set | Testing Set |
|---|---|---|---|
| Glioma | 1605 | 1284 | 321 |
| Meningioma | 1605 | 1284 | 321 |
| Pituitary | 1605 | 1284 | 321 |
| No tumor | 1605 | 1284 | 321 |
| Total Images | 6420 | 5136 | 1284 |
Each class is assigned specified amounts for training and testing, with a precise distribution that increases the generalization and adaptability of the local model. The systematic allocation of resources aims to address biases and issues related to datasets that lack balance, therefore enhancing the trustworthiness and applicability of our study results. Furthermore, to verify the validated model of the FDEIoL system, we use neuroimaging data particularly related to brain tumors, as shown in Table 4. This dataset is important for our study due to the effectiveness of the proposed FDEIoL system model with other datasets. The brain tumor dataset includes classes for glioma, meningioma, pituitary, and no tumors.
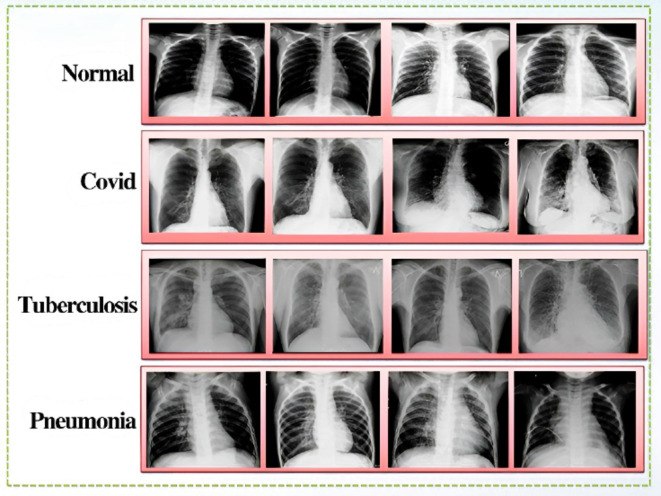
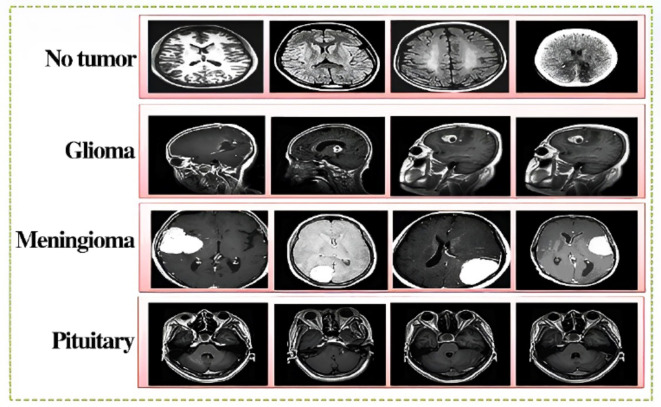
The in-depth analysis and distribution help us better understand how our DL models are trained and tested in the specific domain of brain tumor classification. Figures 5 and 6 show some sample images from CXR and Brain tumor datasets respectively.
Fig. 5.
Sample images of the four classes of the CXR dataset including Covid-19, TB, PNA and Normal.
Fig. 6.
Sample images of the four classes of the MRI dataset including Pituitary, Glioma, Meningioma.
and No tumor.
Evaluation metrics
For model performance evaluation, we focused on real-time evaluation of model performance in supervised classification tasks within medical imaging, focusing on the specific metrics used for this objective.
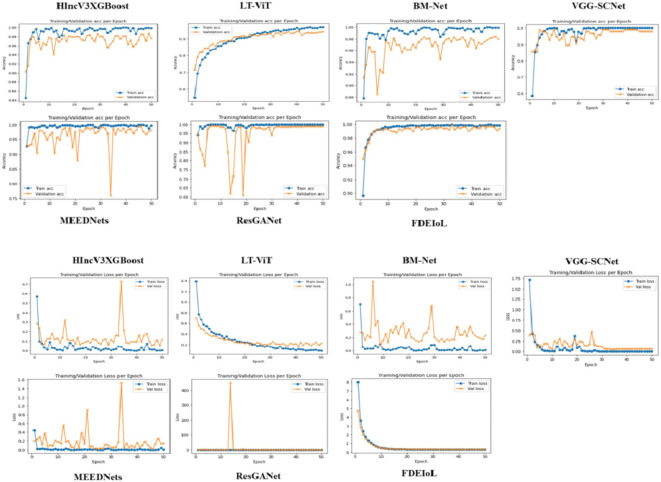
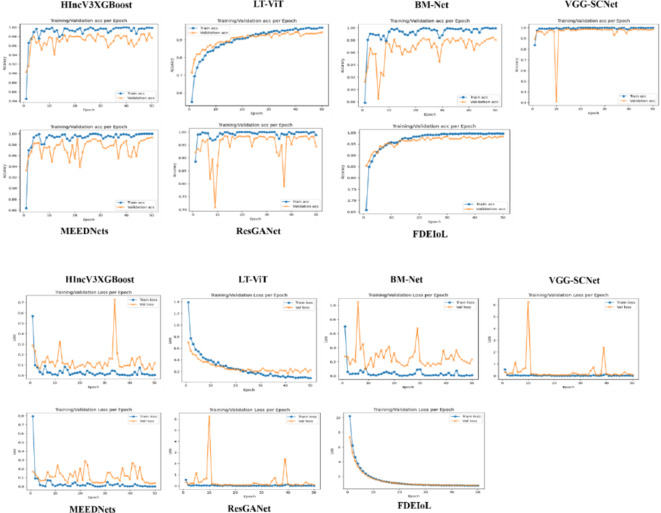
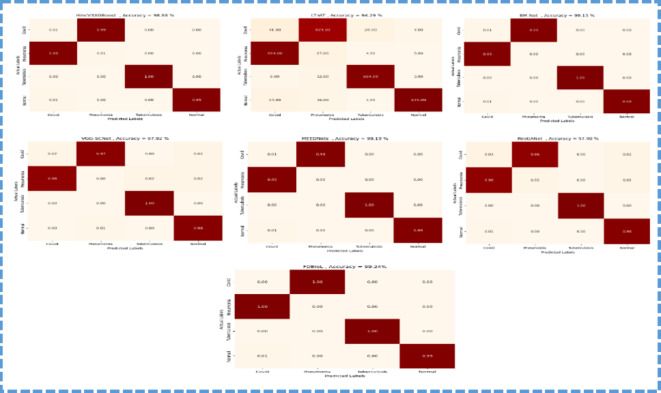
As shown in Figs. 7 and 8, it is critical to say that testing local models with malicious local model data has not previously been encountered when evaluating a trained model’s effectiveness using accuracy. The evaluation process should include several important metrics to thoroughly examine the model’s performance. These measure parameters are error rate, precision, sensitivity or recall, F1-score, specificity, overall accuracy, and Cohen’s Kappa. The confusion matrix obtains more comprehensive insights into the global model’s predictive capabilities for future occurrences. It has essential parts such as true positive (TP), true negative (TN), false positive (FP), and false negative (FN), which can be used effectively to find the complete set of real-time system model performance evaluations. Figure 9 shows the confusion matrices of different DL models using the CXR dataset, while Fig. 10 displays the confusion matrices of different DL models using the MRI dataset.
Fig. 7.
The first two rows are the accuracy of the models and the last two rows are their corresponding loss with the CXR images dataset.
Fig. 8.
The first two rows are the accuracy of the models and the last two rows are their corresponding loss with the MRI images dataset.
Fig. 9.
Confusion Matrices of CXR Dataset.
Fig. 10.
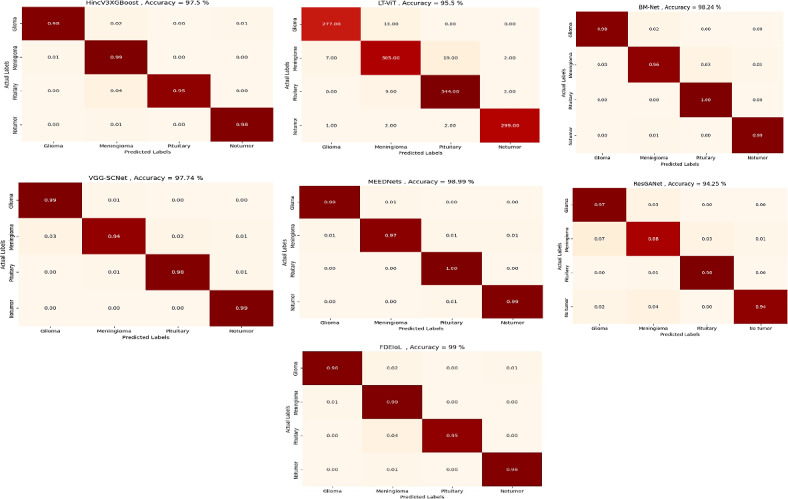
Confusion Matrices of MRI Dataset.
TP and TN represent that the model successfully predicts positive and negative results. However, FP events occur when the model makes wrong predictions of the positive class, indicating regions where its positive class predictions might be enhanced. Similarly, FN cases demonstrate errors in the global model’s predictions of the negative class, providing insight into areas that may need improvement to improve its overall predictive accuracy. The complete assessment approach ensures a detailed awareness of the model’s performance across multiple factors, enabling well-informed decision-making and possible changes to the model in advance.
The use of Eqs. 12 and 13 are used to systematically do an in-depth assessment of the accuracy and error rate of a particular test dataset. This process is explained in detail in the appropriate sections. Furthermore, it is essential to provide equations that define precision, accuracy, recall, and the F1 score to enhance the range of evaluation criteria from a more detailed perspective. Such an adjustable method enables an in-depth comprehension of the model’s performance, enabling a detailed and thorough investigation of its prediction abilities.
 |
12 |
 |
13 |
The term sensitivity, or recall, in Eq. 14 is commonly known as the TP rate. Moreover, Eq. 15 illustrates the correlation between the TN values and the FN values to find the specificity of the model.
 |
14 |
 |
15 |
Moreover, Eq. 16 evaluates the precision of the model by calculating the ratio of predicted TP results to the total number of actual positive outcomes.
 |
16 |
Cohen’s Kappa is a metric that evaluates the amount of time in which an evaluation precisely aligns with its predicted performance due to unpredictability. In short, a model will have a high Kappa score when there is a significant difference between accuracy and the null error rate, which represents the following Eq. 17:
 |
17 |
where  is the observed agreement and is equal to the sum of diagonal elements/total number of instances, while
  is the expected agreement and is given in Eq. 18;
 |
18 |
where  represents the true labels, which is calculated as the sum of the probabilities for each row in the confusion matrix divided by the total number of instances, while
  represents the predicted labels, which is calculated as the sum of the probabilities for each column in the confusion matrix divided by the total number of instances. k signifies the number of classes. Moreover, the F1 Score is a mathematical combination of precision and recall, represented by Eq. 19, and is commonly known as the F score or the F measure. When the class distribution is unequal, F1 is often more advantageous than accuracy. Accuracy is optimized when the costs of FN and FP are equal. When there is a substantial disparity in the costs associated with FP and FN, it is important to take into account both precision and recall.
 |
19 |
However, we use four-class evaluation, so it is very important to find the average F1 score for the N number of classes, which is given by the following mathematical Eq. 20:
 |
20 |
Results and discussion
In this section, we thoroughly examine the efficiency of the FDEIoL system model using two diverse datasets, CXR and MRI, with four different categories in each modality. The analysis has explained why the model works and how the designed model can perform better than the conventional mainstream DL methodology. Incorporating comparative analysis based on performance metrics, their comparison, and their implications for practical application, we comprehensively evaluate the FDEIoL system’s accuracy and time complexity advantage. The FDEIoL system model achieved an impressive average accuracy of 99.24%, an average F1 score of 99.5%, a Cohen kappa of 0.996667, and an error rate of 0.0076 for the CXR dataset. In comparison, for the MRI dataset, the proposed model achieved an accuracy of 99%, an average F1 score of 99.5%, a Cohen kappa of 97% and an error rate of 0.01. These outcomes were made possible by utilizing an innovative technique that selects VG and CSS features during the preliminary stages of deep ensemble training. These tactical feature selections came out to be essential strategies for boosting the effectiveness of the model. Among all the features extracted, only the VG and CSS were explicitly chosen to deal with the issues most frequently arising in DL models, including very shallow gradients and overtraining, which should enhance the model’s predictive capability on unseen data. To verify the effectiveness of the FDEIoL system for exclusion zones, its accuracy was compared with various other models, including VGG-SCNets, BM-Net, HIncV3XGBoost, LT-ViT, MEEDNets and ResGANet. The comparative analysis for the CXR dataset, shown in Table 5, reveals that the FDEIoL system delivers superior performance with better accuracy, F1 Score, and faster classification period for these models. However, the best performer in this category of architectures was the FDEIoL model, with a mean classification time of about 100 milliseconds. The rapidity of data processing offered by this function is especially beneficial in real-time operations, in which precise decision-making is essential, such as in a healthcare setting for automated diagnostic imaging.
Table 5.
Performance evaluation of the proposed FDEIoL using various DL models on the CXR images dataset.
| Classifiers | Evaluation Parameters | Classes |
Overall Accuracy |
Error Rate | Cohen’s Kappa | Average F1Score | |||
| Covid-19 | PNA | TB | Normal | ||||||
| HincV3XGBoost | Precision | 0.99 | 0.98 | 1.00 | 1.00 | 0.9888 | 0.0112 | 0.990001 | 0.9925 |
| Recall | 0.99 | 0.99 | 1.00 | 0.99 | |||||
| F1-Score | 0.99 | 0.99 | 1.00 | 0.99 | |||||
| Specificity | 0.99 | 0.99 | 1.00 | 1.00 | |||||
| LT-ViT | Precision | 0.90 | 0.92 | 0.96 | 0.98 | 0.9429 | 0.0571 | 0.9171 | 0.9375 |
| Recall | 0.95 | 0.89 | 0.97 | 0.94 | |||||
| F1-Score | 0.92 | 0.91 | 0.96 | 0.96 | |||||
| Specificity | 0.97 | 0.96 | 0.98 | 0.99 | |||||
| BM-Net | Precision | 0.99 | 0.98 | 1.00 | 0.99 | 0.0085 | 0.9932 | 0.99 | |
| Recall | 0.99 | 0.98 | 1.00 | 0.99 | 0.9915 | ||||
| F1-Score | 0.99 | 0.98 | 1.00 | 0.99 | |||||
| Specificity | 0.99 | 1.00 | 1.00 | 1.00 | |||||
| VGG-SCNets | Precision | 1.00 | 0.97 | 0.97 | 1.00 | 0.0208 | 0.9700 | 0.985 | |
| Recall | 1.00 | 0.97 | 0.98 | 1.00 | 0.9792 | ||||
| F1-Score | 1.00 | 0.97 | 0.97 | 1.00 | |||||
| Specificity | 0.99 | 0.99 | 0.99 | 0.98 | |||||
| MEEDNets | Precision | 0.98 | 1.00 | 1.00 | 1.00 | 0.9919 | 0.0081 | 0.9932 | 0.9925 |
| Recall | 0.99 | 0.99 | 1.00 | 0.99 | |||||
| F1-Score | 0.99 | 0.99 | 1.00 | 0.99 | |||||
| Specificity | 0.99 | 1.00 | 1.00 | 1.00 | |||||
| ResGANet | Precision | 0.96 | 0.97 | 1.00 | 0.96 | 0.021 | 0.9666 | 0.975 | |
| Recall | 0.96 | 0.96 | 1.00 | 0.98 | 0.9790 | ||||
| F1-Score | 0.96 | 0.97 | 1.00 | 0.97 | |||||
| Specificity | 0.98 | 0.99 | 1.00 | 0.98 | |||||
| Ensemble Except FL Modeling | Precision | 0.98 | 0.99 | 0.99 | 0.98 | 0.9795 | 0.0205 | 0.980002 | 0.96 |
| Recall | 0.98 | 0.96 | 1.00 | 1.00 | |||||
| F1-Score | 0.98 | 0.98 | 0.89 | 0.99 | |||||
| Specificity | 0.99 | 0.99 | 0.99 | 0.99 | |||||
| Proposed FDEIoL | Precision | 1.00 | 0.99 | 1.00 | 1.00 | 0.9924 | 0.0076 | 0.996667 | 0.995 |
| Recall | 1.00 | 1.00 | 1.00 | 0.99 | |||||
| F1-Score | 1.00 | 0.99 | 1.00 | 0.99 | |||||
| Specificity | 1.00 | 1.00 | 1.00 | 1.00 | |||||
However, as mentioned earlier, the experiments of the CXR dataset further explain the effectiveness of the FDEIoL system for treating various pathological conditions such as PNA, TB, and COVID-19. Due to the high confidence with which the model accurately classified these conditions, this work shows its potential use in clinical practice diagnosis. As can be observed in Figs. 7 and 8, the proposed model also outperforms the existing methods and provides a clear representation of the idea. A consistent and reliable performance across different conditions demonstrates the adaptability and stability of the FDEIoL system for medical image analysis. In classifying brain tumors of MRI images, the FDEIoL system proved to be highly accurate once more, with a 99% accuracy. The classification task involved four categories: glioma, meningioma, pituitary, and no tumor. In light of the problems with DL, including issues connected with the model’s depth, width, or resolution, the FDEIoL system employed VG and CSS classifier layers. As mentioned earlier, the layers played a crucial role in balancing up the model’s architecture, and the network’s depth and width did not cause performance degradation.
Another key feature of the FDEIoL system was the deep ensemble, which enhanced the feature extraction process. This approach was also beneficial because the system can capture almost all aspects of the feature from the input data, and the ensemble classifier hugely enhances the system’s ability. This means that the highest overall F1 score is 99. 5%, as presented in Table 6, which presents the effectiveness of the system in cop up with complicated and comprised datasets. In addition, when the model is used with CE-EEN-B0 and ResGANet, the FDEIoL system achieved a Cohen’s Kappa of only 97%, which is a testament to the model’s accuracy in classifying tasks. The FDEIoL system also exhibited fast computational performance for the classification and test time, which does not exceed 100 milliseconds and is conducive to real-time tasks. The comparative performance of the FDEIoL system is illustrated in the tabular form in Table 7, which points out the superiority of the FDEIoL system on different parameters. After that, the comparative analysis of the FDEIoL system with other state-of-the-art algorithms has revealed the former’s advantage in such indicators as accuracy, F1 score, Cohen’s Kappa value, and the time consumed for its work. These results indicate that the system can give highly accurate classifications almost instantly, suggesting that it might be integrated into real diagnostic systems for medical applications.
Table 6.
Performance evaluation of the proposed FDEIoL using various DL models on MRI images dataset.
| Classifiers | Evaluation Parameters | Classes |
Overall Accuracy |
Error Rate | Cohen’s Kappa | Average F1Score | |||
| Glioma | Meningioma | Pituitary | No Tumor | ||||||
| HIncV3XGBoost | Precision | 0.99 | 0.93 | 0.99 | 0.99 | 0.975 | 0.025 | 0.9667 | 0.975 |
| Recall | 0.98 | 0.99 | 0.95 | 0.98 | |||||
| F1-Score | 0.98 | 0.96 | 0.97 | 0.99 | |||||
| Specificity | 0.99 | 0.97 | 1.00 | 0.99 | |||||
| LT-ViT | Precision | 0.97 | 0.93 | 0.94 | 0.99 | 0.955 | 0.045 | 0.9879 | 0.9575 |
| Recall | 0.96 | 0.92 | 0.97 | 0.98 | |||||
| F1-Score | 0.96 | 0.92 | 0.96 | 0.99 | |||||
| Specificity | 0.99 | 0.97 | 0.97 | 0.99 | |||||
| BM-Net | Precision | 1.00 | 0.98 | 0.97 | 0.99 | 0.9824 | 0.017 | 0.9766 | 0.9825 |
| Recall | 0.98 | 0.96 | 1.00 | 0.99 | |||||
| F1-Score | 0.99 | 0.97 | 0.98 | 0.99 | |||||
| Specificity | 1.00 | 0.99 | 1.00 | 0.99 | |||||
| VGG-SCNet | Precision | 0.97 | 0.97 | 0.98 | 0.99 | 0.0226 | 0.9698 | 0.9775 | |
| Recall | 0.99 | 0.94 | 0.98 | 0.99 | 0.9774 | ||||
| F1-Score | 0.98 | 0.96 | 0.98 | 0.99 | |||||
| Specificity | 0.98 | 0.99 | 0.99 | 0.99 | |||||
| MEEDNets | Precision | 0.99 | 0.99 | 0.98 | 0.99 | 0.0101 | 0.9833 | 0.9875 | |
| Recall | 0.99 | 0.97 | 1.00 | 0.99 | 0.9899 | ||||
| F1-Score | 0.99 | 0.98 | 0.99 | 0.99 | |||||
| Specificity | 0.99 | 0.99 | 0.99 | 0.99 | |||||
| ResGANet | Precision | 0.91 | 0.92 | 0.96 | 0.98 | 0.9425 | 0.057 | 0.9235 | 0.9425 |
| Recall | 0.97 | 0.88 | 0.98 | 0.94 | |||||
| F1-Score | 0.94 | 0.90 | 0.97 | 0.96 | |||||
| Specificity | 0.96 | 0.97 | 0.98 | 0.99 | |||||
| Proposed FDEIoL | Precision | 1.00 | 0.99 | 0.99 | 1.00 | 0.99 | 0.01 | 0.97 | 0.995 |
| Recall | 1.00 | 0.99 | 1.00 | 0.99 | |||||
| F1-Score | 1.00 | 0.99 | 1.00 | 0.99 | |||||
| Specificity | 1.00 | 0.99 | 1.00 | 0.99 | |||||
Table 7.
Comparative analysis of state-of-the-art algorithms in terms of different performance metrics with our proposed approach.
| Previous Work | DL Model used for FL | Task | Dataset | Performance Measures |
|---|---|---|---|---|
| Covid-19, Pneumonia, Lung opacity and Normal X-Ray Image classification | ||||
| [82] | Lightweight Communication efficient CNN | |||
| CXR Dataset | Accuracy= 92.96% | |||
| Classify Pneumonia and Normal using CXR images | AUC = 0.9185 and Accuracy = 0.8029 | |||
| [83] | CNN | CXR Dataset | ||
| Classification of Covid-19, Pneumonia, Lung opacity and Normal X-Ray Images | ||||
| [84] | CNN and Image Augmentation | |||
| CXR Dataset | Accuracy = 89.43% | |||
| Classify MRI images into Yes -Tumors and Non-Tumor | Precision 0.91, recall 0.96 and F1 Score 0.93 for No Tumor, While Precision 0.91, recall 0.82 and F1 Score 0.86 for Yes Tumor | |||
| [85] | Vgg16, Inception V2, DenseNet 121 | MRI Dataset | ||
| [55] | FedFocus: Integrated CNN and FL | Covid-19 detection using CXR images | CXR Dataset | Accuracy = 92% |
| Accuracy = 97%, Sensitivity 98.11% and Specificity 95.89% for FL-ResNet50 while Accuracy = 94.40%, Sensitivity 96.15% and Specificity 92.66 for FL-VGG-16 | ||||
| [86] | VGG-16, ResNet50 | Screening Covid-19 using CXR | CXR Dataset | |
| [87] | MobileNet v2, ResNeXt and ResNet18 | Detection of Covid-19 using Pneumonia CXR images | ResNet18 performed best with Sensitivity = 91.26% | |
| CXR Dataset | ||||
| Classifying into COVID-19, TB, PNA, and healthy individuals using CXR images as well as Glioma, Meningioma, Pituitary and no tumor using MRI images | Accuracy = 99.24%, Error Rate = 0.0076, Cohen’s Kapp = 0.9967, and Average F1 Score = 0.995 for CXR Dataset. For MRI dataset, Accuracy = 99%, Error Rate = 0.01, Cohen’s Kapp = 0.9698 and Average F1 Score = 0.995 | |||
| Proposed Work | FDEIoL | CXR and MRI Datasets |
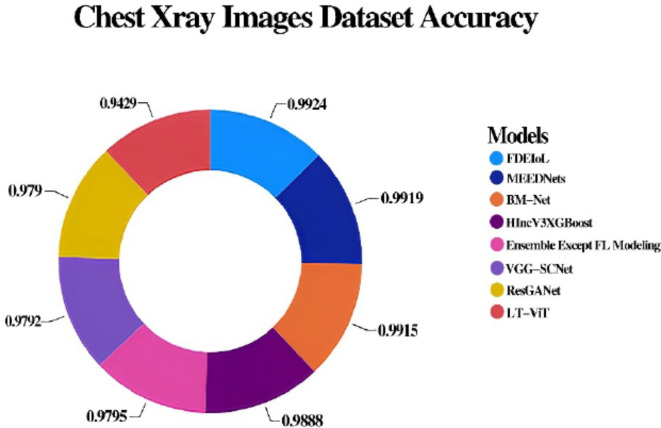
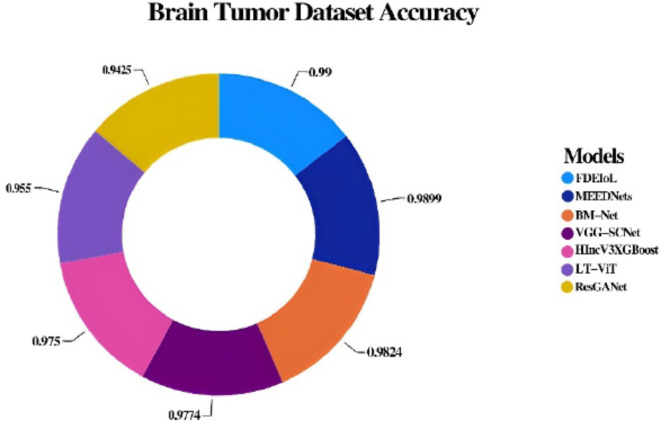
In the CXR dataset, the validation accuracy of different DL models is represented in Fig. 11, while in the MRI dataset, the same is represented in Fig. 12. These visualizations also offer a good insight into how the FDEIoL system’s performance compares to the rest of the models regarding the size of the errors. The favorable and stable results obtained from both datasets again demonstrate the efficiency and effectiveness of the FDEIoL system. Also, the evaluation was done using the preprocessed and de-noised CXR and MRI images, which does not allow the presence of noise or artifacts to affect the results, hence showing the correctness of the model.
Fig. 11.
Comparison of different models with proposed FDEIoL model accuracies for CXR images dataset.
Fig. 12.
Comparison of different models with proposed FDEIoL model accuracies for MRI images dataset.
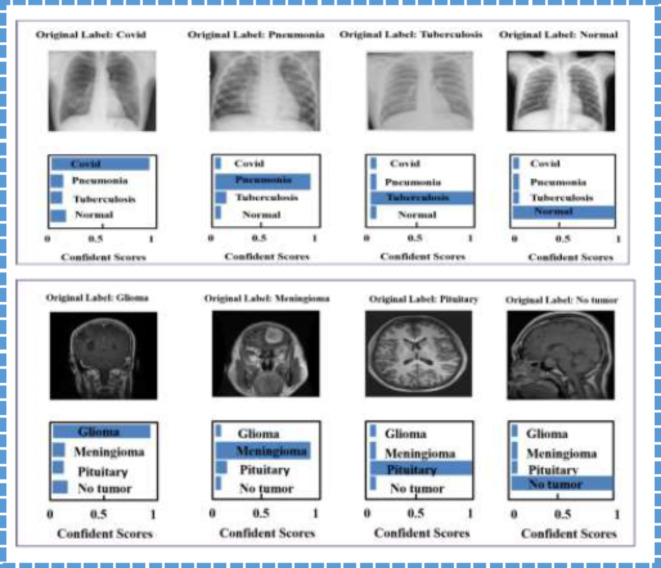
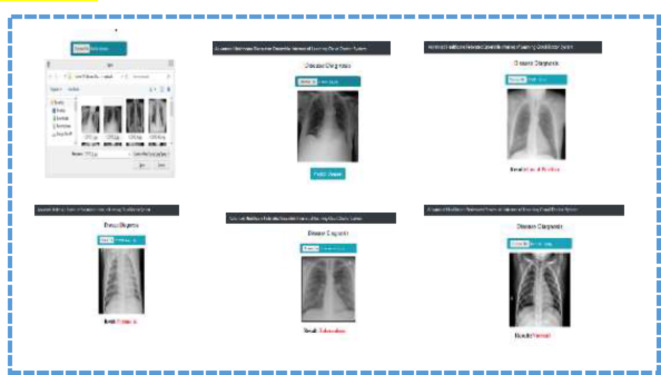
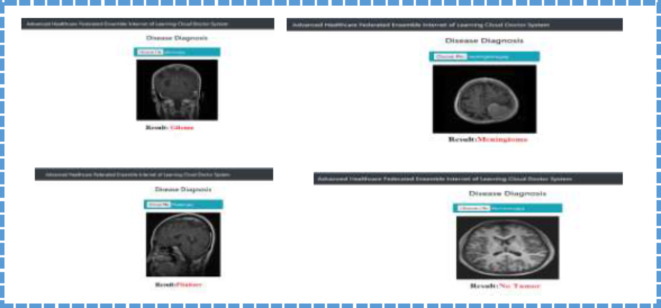
The confidence scores relating to various categories in the case of CXR and MRI are described in greater detail in Fig. 13. The first column has multiple images of chest X-ray output results that provide various diseases and a normal confidence score. More often than not, these scores measure the model’s confidence level towards the predictions it makes, and they are quite helpful in understanding how the model has come to the final decision. The second column displays confidence scores for classifying brain tumors, including glioma, meningioma, and pituitary tumors, and no tumor. Each row in Fig. 13 corresponds to the different confidence levels in the system that can be used to validate the results with actual data.
Fig. 13.
The predicted results of evaluating CXR and Brain images utilizing the FDEIoL system model. The first column shows the CXR images, while the second column shows the Brain images.
Furthermore, the breakdown of the confidence scores also supports the affirmation of the FDEIoL system model and shows that it can adequately classify effectively with high reliability. In this case, Figs. 14 and 15 illustrate how FDEIoL detects inaccuracies and confidence scores when integrated with IoT devices. Figure 14 shows that the proposed model effectively identifies COVID-19, PNA, TB, and normal conditions from the CXR images. One of the key advantages of this real-time detection possibility is the need to diagnose the patient as soon as possible, for example, in emergencies or rural areas. As pointed out in Fig. 13, the established model can identify gliomas, meningiomas, and pituitary tumors and their lack within MRI scans. Fusing the FDEIoL system with IoT devices provides a feasible and efficient approach to meeting the requirements of real-time analysis of medical images, which can result in enhanced diagnostics and therapeutics.
Fig. 14.
Real-Time detection of Covid-19, PNA, TB and Normal using CXR images based on IoT.
Fig. 15.
Real-Time detection Glioma, Meningioma, Pituitary No Tumor using Brain Tumors images based on IoT.
Limitations and practical implementations
The proposed FDEIoL system has some limitations which are as follows:
-
i.
The model is based on a FL process, which utilizes communication technology and may face issues associated with latency time and data transmission rates, especially in regions with low-quality internet connection. These factors may reduce the rate at which local model updates are incorporated into the global model in real-time, which will disrupt the general throughput of the system.
-
ii.
Although poisoning attacks are a serious concern and the FDEIoL system successfully combats them, it is not immune to other kinds of adversarial attacks, such as model inversion or data reconstruction kinds of attacks that can easily threaten patients’ privacy.
-
iii.
Since the system relies on the local model, which must be accurate and representative at least to some extent, local model imperfection could be reflected in the global model, leading to biased diagnostic results.
Moreover, the practical implementations of the proposed system are as follows:
-
i.
Better disease diagnosis: Predictive and earlier diagnostic capability of diseases such as different types of brain tumors, COVID-19, TB, and PNA.
-
ii.
Improved patient care: Evidence-based admixture Therapy and nursing care plans that deal with the specifics of patients’ conditions to improve their conditions.
-
iii.
Enhanced research: Expansion of the scope of research for new treatments and medications in a shorter period through cooperation.
-
iv.
Increased privacy: Medical data don’t go viral; therefore, the chances of hacking by other people are quite minimal.
-
v.
Efficient healthcare: Cost savings and efficiency gains for the stakeholders in the healthcare system.
Conclusion and future research directions
The healthcare field is progressing quickly, and innovations in medical technologies, including cloud technologies and IoT devices, considerably enhance diagnostic systems. This paper brings out a new concept of the FDEIoL system that will improve the analysis of medical images, which has been a challenging area of research. In particular, the system is based on the FL approach and the underlying IoT cloud infrastructure targeting medical professionals’ support in enhancing the accuracy of disease diagnosis from medical images. The FDEIoL system has offered an intelligent way of handling disease classifications from the images acquired from several medical IoT devices through the implementation of the cloud-based FL application model aimed at mitigating challenges of privacy and accuracy in the use of the cloud in medical image processing. The critical function of the FDEIoL system is to improve the security and accuracy of the image-processing servers that may reside in the cloud and be accessible to the public. This system is designed to yield high efficiency and maximum accuracy for medical imaging professionals and researchers conducting research studies. The system’s flexibility is that it can be accessed through any IoT device without the need for specialized knowledge about the technology used in the device. This accessibility is desirable in the healthcare sector, where proper identification could go a long way in effecting the changes and improvements that need to transpire. The FDEIoL system offers safeguards to reduce the frequency of misdiagnosis, a common problem that may harm the patient. The system achieves this by adopting FL ensemble approaches, combining the various local models to create a much stronger global model. This approach corrects the disease classification and generally increases the system’s reliability. To prevent model poisoning attacks that risk the diagnostic process’s accuracy, the system ensures that the global model is updated securely and consistently on all IoT devices. In addition, integrating the FDEIoL system shows a marked advancement in the receipt, processing, and tagging of medical images. The integration of FL into the IoT cloud infrastructure makes sure that the local models, which are periodically updated by the global model, remain specific to the local data and, at the same time, contribute to the enhancement of the global model’s generality and accuracy. It should be noted that this cycle of model improvement and alteration is crucial to enhance the system’s potential to give accurate preliminary diagnoses of numerous conditions. The performance of the FDEIoL system is justified by experimental results indicating that it significantly lowers the risk of misclassification and protects against security threats. Due to the design of this system, which puts into consideration the need to be accurate while at the same time being secure, the system is an essential tool in the medical imaging arena. Medical practitioners also benefit from it because they can easily upload and retrieve their documents through the site since it is secure and user-friendly. Our primary goal as a patient care provider is to ensure that the patient’s health is well taken care of and not to worry about uploading or retrieving documents since this can be done through the online platform. Additionally, the FDEIoL system introduced a significant novelty as a solution for integrating IoT and FL technologies in healthcare. In covering the twin objectives of accuracy and security in medical image processing, the system holds significant promise for the healthcare sector. This system can be accessed and worked on through cloud computing using IoT devices without requiring a high level of expertise in the IT field, which is truly useful for medical imaging personnel and researchers. With the ongoing evolution of the healthcare system, the need to advance the FDEIoL system for improved precision, security, and access to diagnostic data is evident in the ever-interconnected industry. In future work, efforts should be directed toward enhancing and implementing more dynamic security measures to defend FDEIoL against other attacks, such as model inversion and data reconstruction attacks. This could include differential privacy approaches and security-enhanced encryption to protect the patient’s data and maintain the accuracy of the diagnosis process. Another important area of study that can be explored in the future is the enhancement of FDEIoL for usage in low-bandwidth and high-latency settings. This might entail redesigning higher compression and communication of data or designing new architectures that do not require frequent interaction between the local and global models, thus making the system more accommodating and dependable in environments with restricted physical capital.
Acknowledgements
This work was supported by the National Key R&D Program of China Under Grant Number : 2022YFE0136800 ; Marine Defense Technology Innovation Fund of China Shipbuilding Research and Design Center Under Grant Number: JJ-2022-719-03; Open Topic of Microsystem Technology National Defense Science and Technology Key Laboratory Under Grant Number: 6142804230106; Open Fund of Marine Environmental Detection Technology and Application Key Laboratory, Ministry of Natural Resources Under Grant Number: MESTA-2022-A006;The new round of “Double First Class” discipline collaborative innovation achievement project in Heilongjiang Province in 2023 Under Grant Number: LJGXCG2023-066;Industrialisation and demonstration of intelligent cross-water and air medium communication machine Under Grant number: CXRC20231113756; Nanhai High-level Science and Technology Innovation Guidance Special Program of Nanhai Institute of Harbin Engineering University: Cross-domain information transmission and networking technology in deep ocean based on low-orbit satellites.
Abbreviations
- IoT
Internet of Things
- CT
Computed Tomography
- DL
Deep Learning
- CNN
Convolutional Neural Network
- FL
Federated Learning
- CXR
Chest X-Ray
- MR
Magnetic Resonance Imaging
- Covid-19
Coronavirus Disease 2019
- ML
Machine Learning
- TB
Tuberculosis
- PNA
Pneumonia
- GAN
Generative Adversarial Network
- MF
Mean Filter
- VG
Vanishing Gradients
- CSS
Compound Scaling Strategy
- TP
True Positive
- TN
True Negative
- FP
False Positive
- FN
False Negative
- END-SVM
Ensemble Deep Neural Support Vector Machine
- PDCNN
Parallel Deep Convolutional Neural Network
- CLM
Correlation Learning Mechanism
- ResGANet
Residual Group Attention Network
- BM-Net
Bilinear MobileNet
- LT-ViT
Label Token Vision Transformer
- VGG-SCNet
VGG Stacked Classifier Network
- HincV3XGBoost
Hybrid Inception V3 XGBoost
- CE-EEN-B0
Extraction Based Extended EfficientNet-B0
Author contributions
Each author in this article contributed their distinct expertise and responsibilities in a collaborative way. R.K. and S.T. were primarily responsible for formulating the study’s concepts and determining the research direction. R.K. provided methodological frameworks so that the study’s approach was rigorous and coherent. A.N. assumed responsibility for the software implementation, which is critical for data analysis and interpretation. S.T., Z.H., and A.N. collaborated to validate the findings, ensuring the strength and reliability of the conclusions reached. J.K. supervised formal analytic techniques, while R.K. and Z.K. carried out essential studies for data collection and interpretation. X.M. supervised the use of resources, while S.K. thoroughly examined the collected data. S.K. handled further modifications and editing after R.K. initially wrote the manuscript. Z.K. used data visualization to improve the presentation of significant findings. X.M. and Z.H. provided supervision throughout the study process, ensuring complete conformity to scholarly guidelines. X.M. and J.K. collaborated on project administration tasks, with X.M. leading the funding acquisition task. All authors provided input during the manuscript drafting stage.
Data availability
Data will be made available upon request from the corresponding author.The CXR Image dataset consists of 7000 samples used in the current study, encompassing 1750 Covid-19 and Normal chest X-ray samples available at the Kaggle repository, https://doi.org/10.34740/kaggle/dsv/3122958, 1750 Pneumonia chest X-ray samples available at the Kaggle repository, https://www.kaggle.com/datasets/paultimothymooney/chest-xray-pneumonia, and 1750 Tuberculosis chest X-ray samples available at the Kaggle repository, https://www.kaggle.com/tawsifurrahman/tuberculosis-tb-chest-xray-dataset.The MRI image dataset consists of 6420 samples used in the current study, encompassing 1000 Meningioma Tumor, Pituitary Tumor, and 1505 No Tumor MRI samples available at the Kaggle repository, https://www.kaggle.com/datasets/masoudnickparvar/brain-tumor-mri-dataset,1405 Glioma Tumor, and 605 Pituitary Tumor and Meningioma Tumor MRI samples available at the Science Data Bank (Science DB) repository, https://doi.org/10.57760/sciencedb.06290,and 200 Glioma Tumor and 100 No Tumor MRI samples available at the Kaggle repository, https://datasetsearch.research.google.com/search? src=0&query=brain%20tumor%20mri%20classification&docid=L2cvMTFrM2M3ZHd6dg%3D%3D.
Declarations
Competing interests
The authors declare no competing interests.
Declaration of competing interest
The authors declare that they have no known competing financial interests or personal relationships that could have appeared to influence the work reported in this paper.
Footnotes
Publisher’s note
Springer Nature remains neutral with regard to jurisdictional claims in published maps and institutional affiliations.
References
- 1.Ijaz, M. et al. Integration and applications of fog computing and cloud computing based on the internet of things for provision of healthcare services at home. Electronics. 10 (9), 1077 (2021). [Google Scholar]
- 2.Ijaz, M. et al. Intelligent fog-enabled smart healthcare system for wearable physiological parameter detection. Electronics. 9 (12), 2015 (2020). [Google Scholar]
- 3.Visca, D. et al. Tuberculosis and COVID-19 interaction: a review of biological, clinical and public health effects. Pulmonology. 27 (2), 151–165 (2021). [DOI] [PMC free article] [PubMed] [Google Scholar]
- 4.Sun, J. et al. COVID-19: epidemiology, evolution, and cross-disciplinary perspectives. Trends Mol. Med.26 (5), 483–495 (2020). [DOI] [PMC free article] [PubMed] [Google Scholar]
- 5.Hu, B., Guo, H., Zhou, P. & Shi, Z. L. Characteristics of SARS-CoV-2 and COVID-19. Nat. Rev. Microbiol.19 (3), 141–154 (2021). [DOI] [PMC free article] [PubMed] [Google Scholar]
- 6.Chen, N. et al. Epidemiological and clinical characteristics of 99 cases of 2019 novel coronavirus pneumonia in Wuhan, China: a descriptive study. Lancet. 395 (10223), 507–513 (2020). [DOI] [PMC free article] [PubMed] [Google Scholar]
- 7.Chung, M. et al. CT imaging features of 2019 novel coronavirus (2019-nCoV). Radiology. 295 (1), 202–207 (2020). [DOI] [PMC free article] [PubMed] [Google Scholar]
- 8.Arora, R. The training and practice of radiology in India: current trends. Quant. Imaging Med. Surg.4 (6), 449 (2014). [DOI] [PMC free article] [PubMed] [Google Scholar]
- 9.Ai, T. et al. Correlation of chest CT and RT-PCR testing for coronavirus disease 2019 (COVID-19) in China: a report of 1014 cases. Radiology. 296 (2), E32–E40 (2020). [DOI] [PMC free article] [PubMed] [Google Scholar]
- 10.Sullivan, S. G. et al. Where has all the influenza gone? The impact of COVID-19 on the circulation of influenza and other respiratory viruses, Australia, March to September 2020. Eurosurveillance. 25 (47), 2001847 (2020). [DOI] [PMC free article] [PubMed] [Google Scholar]
- 11.AboElenein, N. M., Piao, S., Noor, A. & Ahmed, P. N. MIRAU-Net: an improved neural network based on U-Net for gliomas segmentation. Sig. Process. Image Commun.101, 116553 (2022). [Google Scholar]
- 12.Balasundaram, A. et al. Internet of things (IoT)-based smart healthcare system for efficient diagnostics of health parameters of patients in emergency care. IEEE Internet Things J.10 (21), 18563–18570 (2023). [Google Scholar]
- 13.Dhar, T., Dey, N., Borra, S. & Sherratt, R. S. Challenges of deep learning in medical image analysis—improving explainability and trust. IEEE Trans. Technol. Soc.4 (1), 68–75 (2023). [Google Scholar]
- 14.Elaziz, M. A., Dahou, A., Mabrouk, A., Ibrahim, R. A. & Aseeri, A. O. Medical image classifications for 6G IoT-enabled smart health systems. Diagnostics. 13 (5), 834 (2023). [DOI] [PMC free article] [PubMed] [Google Scholar]
- 15.Yu, H., Zhang, Q. & Yang, L. T. An edge-cloud-aided private high-order fuzzy C-means clustering algorithm in smart healthcare. IEEE/ACM Trans. Comput. Biol. Bioinf.21 (4), 1083–1092 (2023). [DOI] [PubMed] [Google Scholar]
- 16.Ayoub, S. et al. Hyperparameter Tuned Deep Learning Model for Healthcare Monitoring System in Big Data. In 2023 International Conference on Intelligent Data Communication Technologies and Internet of Things (IDCIoT), pp. 281–287 (IEEE, 2023).
- 17.Nyachoti, D. O., Fwelo, P., Springer, A. E. & Kelder, S. H. Association between Gross National Income per capita and COVID-19 vaccination coverage: a global ecological study. BMC Public. Health. 23 (1), 2415 (2023). [DOI] [PMC free article] [PubMed] [Google Scholar]
- 18.Santosh, K. C. AI-driven tools for coronavirus outbreak: need of active learning and cross-population train/test models on multitudinal/multimodal data. J. Med. Syst.44 (5), 93 (2020). [DOI] [PMC free article] [PubMed] [Google Scholar]
- 19.Santosh, K. C. COVID-19 prediction models and unexploited data. J. Med. Syst.44 (9), 170 (2020). [DOI] [PMC free article] [PubMed] [Google Scholar]
- 20.Santosh, K. C. & Joshi, A. (eds) COVID-19: Prediction, decision-making, and its Impacts (Springer, 2021).
- 21.Aradhya, V. M., Mahmud, M., Guru, D. S., Agarwal, B. & Kaiser, M. S. One-shot cluster-based approach for the detection of COVID–19 from chest X–ray images. Cogn. Comput.13 (4), 873–881 (2021). [DOI] [PMC free article] [PubMed] [Google Scholar]
- 22.Das, D., Santosh, K. C. & Pal, U. Truncated inception net: COVID-19 outbreak screening using chest X-rays. Phys. Eng. Sci. Med.43 (3), 915–925 (2020). [DOI] [PMC free article] [PubMed] [Google Scholar]
- 23.Mukherjee, H. et al. Deep neural network to detect COVID-19: one architecture for both CT scans and chest X-rays. Appl. Intell.51, 2777–2789 (2021). [DOI] [PMC free article] [PubMed] [Google Scholar]
- 24.Mukherjee, H. et al. Shallow convolutional neural network for COVID-19 outbreak screening using chest X-rays. Cogn. Comput., 1–14 (2021). [DOI] [PMC free article] [PubMed]
- 25.Narin, A., Kaya, C. & Pamuk, Z. Automatic detection of coronavirus disease (covid-19) using x-ray images and deep convolutional neural networks. Pattern Anal. Appl.24, 1207–1220 (2021). [DOI] [PMC free article] [PubMed] [Google Scholar]
- 26.Duran-Lopez, L., Dominguez-Morales, J. P., Corral-Jaime, J., Vicente-Diaz, S. & Linares-Barranco, A. COVID-XNet: a custom deep learning system to diagnose and locate COVID-19 in chest X-ray images. Appl. Sci.10 (16), 5683 (2020). [Google Scholar]
- 27.Das, N. N., Kumar, N., Kaur, M., Kumar, V. & Singh, D. Automated deep transfer learning-based approach for detection of COVID-19 infection in chest X-rays. Irbm. 43 (2), 114–119 (2022). [DOI] [PMC free article] [PubMed] [Google Scholar]
- 28.Toğaçar, M., Ergen, B. & Cömert, Z. COVID-19 detection using deep learning models to exploit Social Mimic Optimization and structured chest X-ray images using fuzzy color and stacking approaches. Comput. Biol. Med.121, 103805 (2020). [DOI] [PMC free article] [PubMed] [Google Scholar]
- 29.Minaee, S., Kafieh, R., Sonka, M., Yazdani, S. & Soufi, G. J. Deep-COVID: Predicting COVID-19 from chest X-ray images using deep transfer learning. Med. Image. Anal.65, 101794 (2020). [DOI] [PMC free article] [PubMed] [Google Scholar]
- 30.Bassi, P. R. & Attux, R. A deep convolutional neural network for COVID-19 detection using chest X-rays. Res. Biomedical Eng., 1–10 (2021).
- 31.Ozturk, T. et al. Automated detection of COVID-19 cases using deep neural networks with X-ray images. Comput. Biol. Med.121, 103792 (2020). [DOI] [PMC free article] [PubMed] [Google Scholar]
- 32.Hussain, E. et al. CoroDet: a deep learning-based classification for COVID-19 detection using chest X-ray images. Chaos Solitons Fractals. 142, 110495 (2021). [DOI] [PMC free article] [PubMed] [Google Scholar]
- 33.Santosh, K. C. & Ghosh, S. Covid-19 imaging tools: how big data is big? J. Med. Syst.45 (7), 71 (2021). [DOI] [PMC free article] [PubMed] [Google Scholar]
- 34.Ghadi, Y. Y. et al. Integration of federated learning with IoT for smart cities applications, challenges, and solutions. PeerJ Comput. Sci.9, e1657 (2023). [DOI] [PMC free article] [PubMed] [Google Scholar]
- 35.Ghadi, Y. Y. et al. Enhancing patient healthcare with mobile edge computing and 5G: challenges and solutions for secure online health tools. J. Cloud Comput.13 (1), 93 (2024). [Google Scholar]
- 36.Vajda, S. et al. Feature selection for automatic tuberculosis screening in frontal chest radiographs. J. Med. Syst.42, 1–11 (2018). [DOI] [PubMed] [Google Scholar]
- 37.Munadi, K., Muchtar, K., Maulina, N. & Pradhan, B. Image enhancement for tuberculosis detection using deep learning. IEEE Access.8, 217897–217907 (2020). [Google Scholar]
- 38.Ayaz, M., Shaukat, F. & Raja, G. Ensemble learning based automatic detection of tuberculosis in chest X-ray images using hybrid feature descriptors. Phys. Eng. Sci. Med.44 (1), 183–194 (2021). [DOI] [PMC free article] [PubMed] [Google Scholar]
- 39.Khan, F. A. et al. Chest x-ray analysis with deep learning-based software as a triage test for pulmonary tuberculosis: a prospective study of diagnostic accuracy for culture-confirmed disease. Lancet Digit. Health. 2 (11), e573–e581 (2020). [DOI] [PubMed] [Google Scholar]
- 40.Rahman, T. et al. Reliable Tuberculosis detection using chest X-ray with deep learning, segmentation and visualization. IEEE Access.8, 191586–191601 (2020). [Google Scholar]
- 41.Lakhani, P. & Sundaram, B. Deep learning at chest radiography: automated classification of pulmonary tuberculosis by using convolutional neural networks. Radiology. 284 (2), 574–582 (2017). [DOI] [PubMed] [Google Scholar]
- 42.Haq, I. et al. Machine vision approach for diagnosing tuberculosis (TB) based on computerized tomography (CT) scan images. Symmetry. 14 (10), 1997 (2022). [Google Scholar]
- 43.Hammoudi, K. et al. Deep learning on chest X-ray images to detect and evaluate pneumonia cases at the era of COVID-19. J. Med. Syst.45 (7), 75 (2021). [DOI] [PMC free article] [PubMed] [Google Scholar]
- 44.Al-Waisy, A. COVID-DeepNet: Hybrid multimodal deep learning system for improving COVID-19 pneumonia detection in chest X-ray images. Computers, Materials and Continua 67, 2409–2429 (2021). (2021).
- 45.Tripathy, S. S. et al. An SDN-enabled fog computing framework for wban applications in the healthcare sector. Internet Things. 26, 101150 (2024). [Google Scholar]
- 46.Hashmi, M. F., Katiyar, S., Keskar, A. G., Bokde, N. D. & Geem, Z. W. Efficient pneumonia detection in chest xray images using deep transfer learning. Diagnostics. 10 (6), 417 (2020). [DOI] [PMC free article] [PubMed] [Google Scholar]
- 47.Ibrahim, A. U., Ozsoz, M., Serte, S., Al-Turjman, F. & Yakoi, P. S. Pneumonia classification using deep learning from chest X-ray images during COVID-19. Cogn. Comput.16 (4), 1589–1601 (2024). [DOI] [PMC free article] [PubMed] [Google Scholar]
- 48.158, 111588 (2024).
- 49.Ullah, H., Zhao, Y., Wu, L., Noor, A. & Zhao, L. Multi-modal Medical Image Fusion Technique to Improve Glioma Classification Accuracy. In 2021 IEEE 6th International Conference on Signal and Image Processing (ICSIP), pp. 321–325IEEE, (2021).
- 50.Tandel, G. S. et al. Role of ensemble deep learning for brain tumor classification in multiple magnetic resonance imaging sequence data. Diagnostics. 13 (3), 481 (2023). [DOI] [PMC free article] [PubMed] [Google Scholar]
- 51.Alzubi, J. A., Alzubi, O. A., Singh, A. & Ramachandran, M. Cloud-IIoT-based electronic health record privacy-preserving by CNN and blockchain-enabled federated learning. IEEE Trans. Industr. Inf.19 (1), 1080–1087 (2022). [Google Scholar]
- 52.11, 46283–46296 (2023).
- 53.Alzubi, O. A. et al. An optimal pruning algorithm of classifier ensembles: dynamic programming approach. Neural Comput. Appl.32, 16091–16107 (2020). [Google Scholar]
- 54.Movassagh, A. A. et al. Artificial neural networks training algorithm integrating invasive weed optimization with differential evolutionary model. J. Ambient Intell. Humaniz. Comput., 1–9 (2023).
- 55.Kala, R. et al. A. A Deep Neural Network for Image Classification Using Mixed Analog and Digital Infrastructure. In International Conference on Emergent Converging Technologies and Biomedical Systems, pp. 657–665 (2023).
- 56.Li, Z. et al. Integrated CNN and federated learning for COVID-19 detection on chest X-ray images. IEEE/ACM Trans. Comput. Biol. Bioinf.21 (4), 835–845 (2022). [DOI] [PubMed] [Google Scholar]
- 57.Nguyen, D. C., Ding, M., Pathirana, P. N., Seneviratne, A. & Zomaya, A. Y. Federated learning for COVID-19 detection with generative adversarial networks in edge cloud computing. IEEE Internet Things J.9 (12), 10257–10271 (2021). [Google Scholar]
- 58.Enad, H. G. & Mohammed, M. A. Cloud computing-based framework for heart disease classification using quantum machine learning approach. J. Intell. Syst.33 (1), 20230261 (2024). [Google Scholar]
- 59.Giacomello, E., Cataldo, M., Loiacono, D. & Lanzi, P. L. Distributed learning approaches for automated chest x-ray diagnosis. arXiv Preprint arXiv :211001474 (2021).
- 60.Li, Z. et al. Split Learning for Distributed Collaborative Training of Deep Learning Models in Health Informatics. In AMIA Annual Symposium Proceedings 2023, p. 1047 (2023). [PMC free article] [PubMed]
- 61.Chamikara, M. A. P., Bertok, P., Khalil, I., Liu, D. & Camtepe, S. Privacy preserving distributed machine learning with federated learning. Comput. Commun.171, 112–125 (2021). [Google Scholar]
- 62.Rapp, M., Khalili, R. & Henkel, J. Distributed learning on heterogeneous resource-constrained devices. arXiv preprint arXiv:2006.05403 (2020).
- 63.Apostolopoulos, I. D. & Mpesiana, T. A. Covid-19: automatic detection from x-ray images utilizing transfer learning with convolutional neural networks. Phys. Eng. Sci. Med.43, 635–640 (2020). [DOI] [PMC free article] [PubMed] [Google Scholar]
- 64.Shelke, A. et al. Chest X-ray classification using deep learning for automated COVID-19 screening. SN Comput. Sci.2 (4), 300 (2021). [DOI] [PMC free article] [PubMed] [Google Scholar]
- 65.Woźniak, M., Siłka, J. & Wieczorek, M. Deep neural network correlation learning mechanism for CT brain tumor detection. Neural Comput. Appl.35 (20), 14611–14626 (2023). [Google Scholar]
- 66.Obeidavi, M. R. & Maghooli, K. Tumor detection in brain MRI using residual convolutional neural networks. In 2022 International conference on machine vision and image processing (MVIP), pp. 1–5IEEE, (2022).
- 67.Anantharajan, S., Gunasekaran, S., Subramanian, T. & Venkatesh, R. MRI brain tumor detection using deep learning and machine learning approaches. Measurement: Sens.31, 101026 (2024). [Google Scholar]
- 68.Hao, R., Namdar, K., Liu, L. & Khalvati, F. A transfer learning–based active learning framework for brain tumor classification. Front. Artif. Intell.4, 635766 (2021). [DOI] [PMC free article] [PubMed] [Google Scholar]
- 69.Rahman, T. & Islam, M. S. MRI brain tumor detection and classification using parallel deep convolutional neural networks. Measurement: Sens.26, 100694 (2023). [Google Scholar]
- 70.Yamashita, R., Nishio, M., Do, R. K. G. & Togashi, K. Convolutional neural networks: an overview and application in radiology. Insights into Imaging. 9, 611–629 (2018). [DOI] [PMC free article] [PubMed] [Google Scholar]
- 71.Noor, A. et al. Y. Automated sheep facial expression classification using deep transfer learning. Comput. Electron. Agric.175, 105528 (2020). [Google Scholar]
- 72.Horry, M. J. et al. COVID-19 detection through transfer learning using multimodal imaging data. IEEE Access.8, 149808–149824 (2020). [DOI] [PMC free article] [PubMed] [Google Scholar]
- 73.76, 102313 (2022).
- 74.Mahesh, A., Banerjee, D., Saha, A., Prusty, M. R. & Balasundaram, A. CE-EEN-B0: contour extraction based extended EfficientNet-B0 for Brain Tumor classification using MRI images. Computers Mater. Continua. 74 (3), 5967–5982 (2023). [Google Scholar]
- 75.Chaudhary, Y. et al. Efficient-CovidNet: deep learning based COVID-19 detection from chest x-ray images. In 2020 IEEE international conference on e-health networking, application & services (HEALTHCOM), pp. 1–6IEEE, (2021).
- 76.Majib, M. S., Rahman, M. M., Sazzad, T. S., Khan, N. I. & Dey, S. K. Vgg-scnet: a vgg net-based deep learning framework for brain tumor detection on mri images. IEEE Access.9, 116942–116952 (2021). [Google Scholar]
- 77.Zhu, H. et al. Medical image classification via ensemble bio-inspired evolutionary DenseNets. Knowl. Based Syst.280, 111035 (2023). [Google Scholar]
- 78.Ramaneswaran, S., Srinivasan, K., Vincent, P. D. R. & Chang, C. Y. Hybrid inception v3 XGBoost model for acute lymphoblastic leukemia classification. Comput. Math. Methods Med.2021 (1), 2577375 (2021). [Google Scholar]
- 79.Mehmood, A. et al. SBXception: a shallower and broader xception architecture for efficient classification of skin lesions. Cancers. 15 (14), 3604 (2023). [DOI] [PMC free article] [PubMed] [Google Scholar]
- 80.Marikkar, U., Atito, S., Awais, M., Mahdi, A. & LT-ViT: A Vision Transformer for multi-label Chest X-ray classification. In 2023 IEEE International Conference on Image Processing (ICIP), pp. 2565–2569IEEE, (2023).
- 81.9(6), 261 (2022).
- 82.Cetinkaya, A. E., Akin, M. & Sagiroglu, S. A communication efficient federated learning approach to multi chest diseases classification. In 2021 6th International Conference on Computer Science and Engineering (UBMK), pp. 429–434IEEE, (2021).
- 83.Díaz, J. S. P. & García, Á. L. Study of the performance and scalability of federated learning for medical imaging with intermittent clients. Neurocomputing. 518, 142–154 (2023). [Google Scholar]
- 84.Cetinkaya, A. E., Akin, M. & Sagiroglu, S. Improving performance of federated learning based medical image analysis in non-iid settings using image augmentation. In 2021 International Conference on Information Security and Cryptology (ISCTURKEY), pp. 69–74IEEE, (2021).
- 85.Islam, M., Reza, M. T., Kaosar, M. & Parvez, M. Z. Effectiveness of federated learning and CNN ensemble architectures for identifying brain tumors using MRI images. Neural Process. Lett.55 (4), 3779–3809 (2023). [DOI] [PMC free article] [PubMed] [Google Scholar]
- 86.Feki, I., Ammar, S., Kessentini, Y. & Muhammad, K. Federated learning for COVID-19 screening from chest X-ray images. Appl. Soft Comput.106, 107330 (2021). [DOI] [PMC free article] [PubMed] [Google Scholar]
- 87.Liu, B., Yan, B., Zhou, Y., Yang, Y. & Zhang, Y. Experiments of federated learning for covid-19 chest x-ray images. arXiv Preprint (2020). arXiv:2007.05592.
Associated Data
This section collects any data citations, data availability statements, or supplementary materials included in this article.
Data Availability Statement
Data will be made available upon request from the corresponding author.The CXR Image dataset consists of 7000 samples used in the current study, encompassing 1750 Covid-19 and Normal chest X-ray samples available at the Kaggle repository, https://doi.org/10.34740/kaggle/dsv/3122958, 1750 Pneumonia chest X-ray samples available at the Kaggle repository, https://www.kaggle.com/datasets/paultimothymooney/chest-xray-pneumonia, and 1750 Tuberculosis chest X-ray samples available at the Kaggle repository, https://www.kaggle.com/tawsifurrahman/tuberculosis-tb-chest-xray-dataset.The MRI image dataset consists of 6420 samples used in the current study, encompassing 1000 Meningioma Tumor, Pituitary Tumor, and 1505 No Tumor MRI samples available at the Kaggle repository, https://www.kaggle.com/datasets/masoudnickparvar/brain-tumor-mri-dataset,1405 Glioma Tumor, and 605 Pituitary Tumor and Meningioma Tumor MRI samples available at the Science Data Bank (Science DB) repository, https://doi.org/10.57760/sciencedb.06290,and 200 Glioma Tumor and 100 No Tumor MRI samples available at the Kaggle repository, https://datasetsearch.research.google.com/search? src=0&query=brain%20tumor%20mri%20classification&docid=L2cvMTFrM2M3ZHd6dg%3D%3D.


