Abstract
Developing targeted and sensitive analytical techniques for drug monitoring in different specimens are of utmost importance. Herein, a first attempt was made for the determination of paroxetine (Prx+) in environmental water samples using a novel, sensitive, selective, stable, accurate and eco-friendly potentiometric sensor based on Zn–Fe layered double hydroxides/graphitic carbon nitride (Zn–Fe LDH/g-C3N4) nanomaterials with β-cyclodextrin (β-CD) as the sensing ionophore and dibutyl phthalate (DBP) as the plasticizer. The prepared nanomaterial was characterized using X-ray diffraction (XRD) and scanning electron microscopy (SEM). The surface properties of the proposed sensor were characterized by electrochemical impedance spectroscopy (EIS). The sensor exhibited an excellent Nernstian slope of 59.3 ± 0.7 mV decade−1 covering a wide linear working range of 1.0 × 10⁻⁶ to 1.0 × 10⁻² mol L−1, low detection limit of 3.0 × 10⁻⁷ mol L−1, low quantification limit of 9.9 × 10⁻⁷ mol L−1, long life time, sufficient selectivity, high chemical and thermal stability within a wide pH range of 2.0–9.0. This analytical method was successfully implemented for Prx+ determination in a pure form, pharmaceutical formulation and different water samples.
Developing targeted and sensitive analytical techniques for drug monitoring in different specimens are of utmost importance.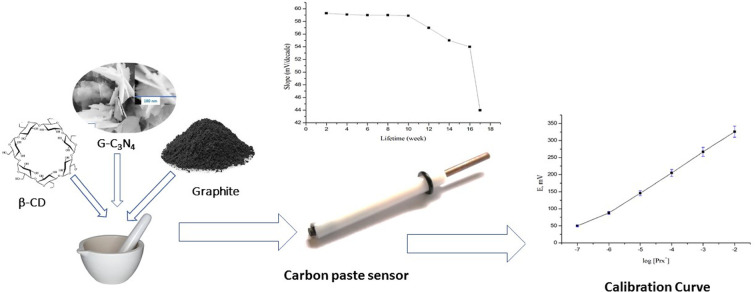
1. Introduction
Depression is routinely treated with tricyclic antidepressants (TCAs) and selectively with serotonin reuptake inhibitors(SSRIs) in psychiatry.1,2 While both medications have comparable clinical efficacies, SSRIs often have fewer side effects than TCAs.2,3 Obsessive-compulsive disorders, panic disorders, anxiety disorders, and eating disorders are illnesses for which some SSRIs are recommended.2–7 The antidepressant paroxetine [(3S-trans)-3-((1,3-benzodioxol-5-yl-oxy)methyl)-4-(4-fluorophenyl)piperidine] hydrochloride (Prx+) belongs to the class of SSRIs. The efficacy of Prx+ as a therapeutic for severe depression is assumed to be correlated with the protonation of serotonergic activity in the central nervous system due to the suppression of serotonin (5-hydroxy-tryptamine, 5-HT) neuronal reuptake. Prx+ is utilized more regularly in medical treatment than tricyclic antidepressants because it is substantially less harmful.8
Drug monitoring and medical treatment depend critically on drug analysis; therefore, the developed analytical techniques must be established to accomplish this goal,9 numerous analytical techniques for Prx+ determination have been previously reported, such as electrochemical,10–16 spectroscopic17–19 and chromatographic techniques.20–23
Although these techniques might be accurate, precise, sensitive and selective, an in-depth investigation of the published papers revealed that one or more defects, such as low sensitivity,23 poor selectivity,23 low precision,16,18 inaccuracy, laboriousness,10,16,18 high cost10,16,18 as well as a narrow concentration range23 are observed in these techniques. Therefore, the development of an easy, affordable, highly sensitive, sufficiently selective and low-cost potentiometric method for the micro-determination of Prx+ is still required.
Many scientists around the world have been drawn to potentiometric carbon paste sensors (CPSs) because of their numerous advantages including simplicity, robustness, chemical inertness, renewability, response stability, environmental friendliness, low ohmic resistance, lack of an internal solution requirement and the ability to easily regenerate the active surface of the paste.24–26
In fact, leaching into the bulk sample solution can be limited by the use of chemically modified ionophores. Due to their ability to form inclusion complexes with the target analyte, certain macromolecules, such as calixarenes, cyclodextrins, and porphyrins have constantly been found to improve the performance of electrochemical sensors.
The incorporation of a lipophilic anionic additive (NaTPB) in the paste is required to stabilize charged complexes and ensure permselectivity and electroneutrality of the paste. Furthermore, NaTPB enhances the interfacial ion-exchange kinetics and reduces the electrical resistance of the sensor matrix, causing higher ion mobility within the organic layer.
Nowadays, nanomaterials have received increasing attention from scientists due to their better qualities than single materials. Many researchers and companies are seeking insights into the applications of nanocomposites in various kinds of industries due to their remarkable chemical, physical, and mechanical properties.27 Nanocomposite materials are also anticipated to offer enhanced capacities for potentiometric chemical sensors.28–30 This behavior can greatly accelerate the electrocatalytic, repeatability, and stability features of these sensors.31
A novel class of metal-free polymeric nanomaterials known as graphitic carbon nitride was recently created by polymerizing various chemical compounds, including cyanamide, thiourea, dicyandiamide, or melamine. It is particularly different among the other materials created so far since it has a very high specific surface area and contains bonds between hydrogen, nitrogen, and carbon. It was also discovered that g-C3N4 can be easily used to build highly sensitive and selective sensors for the determination of various molecular and ionic species because of its high chemical and thermal stability, low cost, large surface area, earth-abundant nature, lack of metals, and non-toxicity.32–34
Recently, layered double hydroxides (LDHs) have attracted a lot of attention due to their high electrical conductivity and prospective uses in the domains of nanoelectronics, sensors, batteries, supercapacitors, and nanocomposites.28–30 In this study, for the first time, the fabrication and analytical uses of a potentiometric sensor based on a unique Zn–Fe LDH/g-C3N4 nanomaterial in the presence of the β-CD ionophore are described. The surface properties of the investigated sensor were characterized using EIS. The proposed sensor demonstrated high sensitivity and reasonable selectivity for Prx+ micro-detection.
2. Experimental
2.1. Reagents and materials
Analytical-grade chemicals were utilized throughout the study. The water used for all the experiments was deionized. Dibutyl phthalate (DBP) and spectroscopic graphite powder (1–2 mm) were bought from Merck. Fluka provided the sodium tetraphenylborate (NaTPB). Urea and sodium hydroxide (NaOH) were purchased from Pio-chem Co, Egypt. Zinc nitrate hexahydrate [Zn(NO3)2·6H2O], and iron(iii) nitrate [Fe(NO3)3·9H2O] with the highest available purity were supplied by SDFCL, India. BDH Company supplied the metal salts as chlorides or nitrates. Eva PHARMA Co., Cairo, Egypt, provided the pure grade Prx+. The medicinal product (Prx+ 20 mg per tablet) was bought from a local pharmacy. A precisely weighed quantity of Prx+ was used to make a standard solution by dissolving it in deionized water. The concentration range of the drug prepared was 1.0 × 10⁻⁷ to 1.0 × 10⁻² mol L−1.
Various cyclic macromolecules, including β-cyclodextrin (β-CD), 18-crown-6 (18C6) (Euromedex, France), dibenzo-18-crown-6 (DB18C6), and chitosan (CH, Bio Basic, Canada INC, with a degree of de-acetylation 96%), were investigated as sensing ionophores. Concentrated solutions of NaOH and HCl were used within the range 0.1–1.0 mol L−1 for pH adjustment of the medium.
2.2. Apparatus
Scanning electron microscopy (SEM, ZEISS, Oberkochen, Germany) and X-ray diffraction (XRD, PANalytical Pro, Almelo, The Netherlands) were used to conduct the morphology characterizations. Electrochemical impedance spectroscopy (EIS, CHI608E, USA) used to characterize the surface properties. The electrochemical system of the CPE may be represented as follows:
Carbon paste sensor/test solution//KCl salt bridge//Ag/AgCl reference electrode.
A 702 titroprocessor equipped with a 665 dosimat made by Metrohm (Switzerland) was used for the potentiometric measurements and the temperature of the tested solutions was controlled applying a mLw W20 circulator thermostat. The cross-section roughness was conducted using the Gwydion program, which assesses the degree of roughness, particle size, and 3D cross-section. The capabilities and clarity of this program are equivalent to those from AFM analysis.
2.3. G-C3N4 and Zn–Fe LDH synthesis
The preparation of g-C3N4 was carried out by the direct combustion of 10 g urea in a furnace at 550 °C for 2 h. The combustion process was performed by covering the crucible with a porcelain cover, which led to increasing the product mass of g-C3N4, which had a brownish-yellow color.
Applying a co-precipitation method, Zn–Fe LDH was prepared as follows: Zn (NO3)2 (0.4 mol L−1, 23.79 g) and Fe (NO3)3 (0.1 mol L−1, 8.08 g) with a molar ratio of 4 : 1 were dissolved in 200 mL of deionized water. NaOH (2 mol L−1) was slowly added while stirred the solution at room temperature till the pH reached 9.0. Then, the mixture was kept overnight to guarantee the complete precipitation. The precipitate was filtered, washed with deionized water until the pH of the filtrate had reached 7.0, and finally dried at 50 °C for 24 h.
2.4. Preparation of the carbon paste sensor
The ionophore (0.5% β-cyclodextrin), 0.5% NaTPB lipophilic anionic additive, 5% Zn–Fe LDH, 5% g-C3N4, 39.25% graphite powder, and 49.75% DBP plasticizer were mixed to obtain a paste, which was packed into a piston-driven Teflon holder. Gently moving the stainless-steel screw forward produced a fresh surface, which was then polished with filter paper to create a bright new surface. Prior to use, the sensor was preconditioned by soaking for 1 h in a solution containing 1.0 × 10⁻³ mol L−1 Prx+. The sensor was kept at 4 °C while not in use.
2.5. Calibration curve construction
The conditioned sensor was submerged in Prx+ solutions between 1.0 × 10⁻⁷ and 1.0 × 10⁻² mol L−1 coupled with an Ag/AgCl double junction reference electrode. While stirring the sensor and recording the e.m.f. measurements within 1 mV, the sensor was allowed to equilibrate. Regression equations for the linear portion of the mV-concentration profiles were produced and utilized for the later calculation of unknown drug concentrations.
2.6. Water layer test
A water layer test between the carbon paste and the transducer was performed. The studied sensor was conditioned in 1 × 10⁻³ mol L−1 Prx+ solution and then placed into 1 × 10⁻³ mol L−1 fluoxetine hydrochloride, nisoxetine hydrochloride, or dapoxetine hydrochloride interferent solution and then returned back into 1 × 10⁻³ mol L−1 Prx+ solution.
2.7. Selectivity
The selectivity behavior of the investigated sensor was examined applying the Bakker Protocol. The influence of some interfering species on the sensor response was studied graphically by plotting the potential against −log[concentration] of the added species.
2.8. Electrochemical impedance measurements
Electrochemical impedance spectroscopy (EIS) analysis was performed for the blank sample and β-CD/Zn–Fe LDH/g-C3N4 CPE (as the working electrodes) in (1.0 × 10⁻³ [Fe(CN)6]3−/4− containing 0.1 mol L−1 KNO3) with a potentiostat/galvanostat (Autolab PGSTAT 302 N, The Netherlands). All the EIS measurements were done in a three-electrode cell (working electrode, Ag/AgCl electrode as the reference electrode, and platinum wire as the counter electrode) at 1 V vs. Ag/AgCl within the frequency range of 100 kHz to 0.1 Hz. The system was run on a PC using Nova 1.11 software.
2.9. Prx+ micro-determination
A range of volumes (1–5 mL) of 1.0 × 10⁻² mol L−1 pure drug or pharmaceutical formulation samples were utilized for the potentiometric titrations. Small amounts of 1.0 × 10⁻² mol L−1 Prx+ solution was added using the standard addition method to 50 mL aliquot samples of various concentrations drawn from pure drug, pharmaceutical formulations, and various environmental water samples. Moreover, different environmental water samples were measured using the calibration curve method.
2.10. Greenness evaluation
A greenness evaluation of the electro-analytical method was performed according to the eco-scale, which depended on penalty point calculations for several parameters. The method achieved a result for AES of >75, meaning it can be considered an excellent green analytical method.35–38
| AES = 100 − penalty points | 1 |
where AES is the analytical eco-scale.
3. Results and discussion
3.1. Characterization of graphitic carbon nitride and LDH
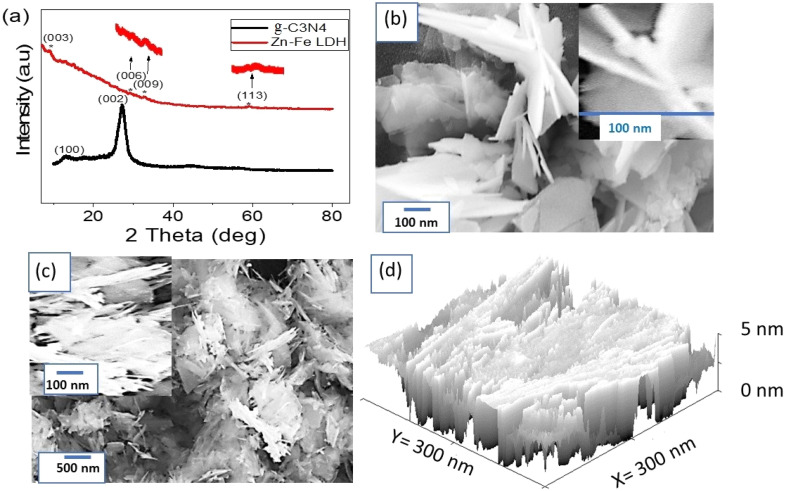
The XRD pattern for g-C3N4 is shown in Fig. 1a. The crystalline structure of g-C3N4 was confirmed through the appearance of an intense peak at the 2θ value = 27.20°. The peak for the growth direction of (002) was related to the stacking of carbon layers. This peak matched with the JCPDS card 87-1526 for g-C3N4.39 Also, the peak at 13.03° was characteristic of g-C3N4 and matched with the recent studies (JCPDS 87-1526 card).40 For calculating the crystal size (D) of g-C3N4, Scherrer's formula, as given by eqn (2),41,42 was used, in which this equation depends on the Bragg angle (θ) and the full width at half maximum (W). Moreover, it depends on the constants: dimensionless factor (k = 0.94), and the XRD wavelength (λ). From this equation, the crystalline size of g-C3N4 at the main peak (27.20°) was determined to be 16.2 nm.
| D = 0.94λ/W cos θ | 2 |
Fig. 1. (a) XRD pattern of g-C3N4 and Zn–Fe LDH. SEM images of (b) g-C3N4 and (c) Zn–Fe LDH. (d) Theoretical cross-section of Zn–Fe LDH.
The XRD pattern of Zn–Fe LDH is shown in Fig. 1a, in which four low intensity peaks could be observed, located at 9.46°, 29.38°, 33.14°, 59.48°. These peaks corresponded to the growth directions (003), (006), (009), and (113), respectively. These low intense peaks are characteristic of the formation of Zn–Fe LDH, which matched with the recent literature.43 The low intensities for the peaks were related to the formed materials being semi-uniform with low crystallinity.44 The significant peaks that highlight the characteristics of this promising synthesized material were enlarged. Notably, the crystallinity of this material matched with other studies that have reported the material as having a crystalline structure.45 From Scherrer's formula, the crystal size of the Zn–Fe LDH was 41 nm.
The morphology of the prepared g-C3N4 was determined through SEM analysis, in which the formation of 2D nanosheets could be well seen, as shown in Fig. 1b. These sheets were folded and crumpled in some parts, but they were well distributed, leading to an increase in the surface area and the active sites as well. The 2D nanosheets had an average width of 80 nm, while their average length was 170 nm.
The SEM image of Zn–Fe LDH is shown in Fig. 1c, in which it can be seen that the particle had no uniform fiber shapes and was mixed with gelatinous shapes, which was related to the behavior of the LDH. These fibers had a length of about 250 nm and a width of 30 nm. The magnified figure confirmed the formation of these fiber particles (see the insert in Fig. 1c).
The cross-section roughness in Fig. 1d demonstrates the successful intercalation of Zn–Fe LDH onto the surface of g-C3N4 sheets. This process resulted in the uniform formation of a 2D nanocomposite with a smooth surface, which is characteristic of LDH materials. The coating of LDH onto the g-C3N4 sheets was thus well-established, indicating the effective combination of the two components to form the nanocomposite. The smooth surface observed in the cross-section roughness further confirmed the homogeneous distribution of LDH on the g-C3N4, which is crucial for achieving enhanced properties and performance in various applications. Overall, the cross-section roughness provided valuable insights into the structural characteristics of the nanocomposite, validating its potential for sensing applications. This analysis was equivalent to the BET analysis,46,47 in which the results reflected a significant number of active sites and a large surface area.
3.2. Optimization of the sensor compositions
In host–guest and supramolecular chemistry, molecular recognition and inclusion complexation mechanisms are currently important, and they offer a promising approach for electrochemical sensing. To achieve high sensor performance,48 an in-depth analysis of the sensing matrix composition with regard to the nature and amount of the sensing ionophore, anionic additives, and nanomaterials was carried out.
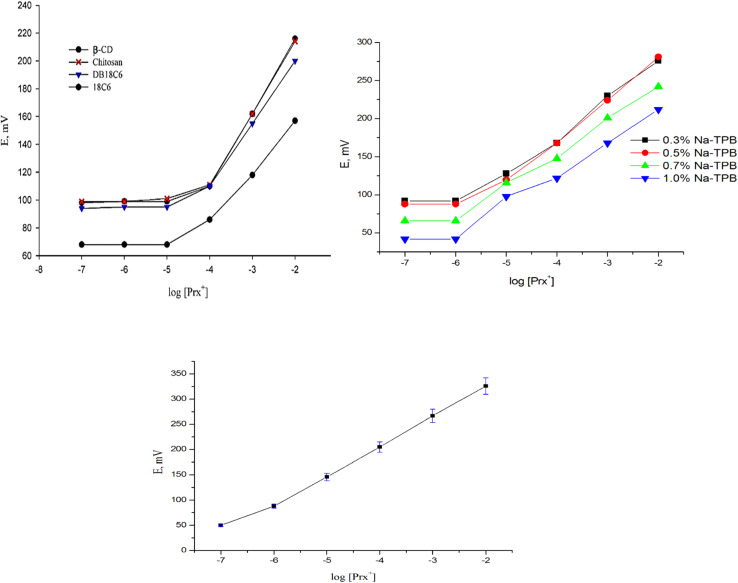
The most important sensing component in the sensor matrix is the ionophore/ion carrier. It discriminates against interfering ions while preferentially binding the target ion. Additionally, it must have sufficient lipophilicity to avoid leaching into the sample solution despite being sufficiently soluble in the sensor composition. Here, in the absence of the electroactive component, the blank sensor displayed a sensor with a weak response and little selectivity for Prx+. The incorporation of β-CD in the paste up to a value of 0.5 wt% steadily enhanced the potentiometric performances of the suggested sensors. However, when the ionophore percentage was above 0.5%, the paste became turbid and the sensors' potential responsiveness suffered. In order to offer such attributes, various sensing macrocyclic compounds, including β-cyclodextrin, dibenzo-18-crown-6, 18-crown-6, and chitosan were tested (Fig. 2). The data showed that β-CD exhibited the highest sensitivity (Nernstian slope of 51.5 mV decade−1) toward Prx+ cation (Table 1), covering a concentration range from 10−4 to 102 mol L−1.
Fig. 2. Optimization of the Prx+ sensor.
Optimization of the sensor composition and its potentiometric responsea.
| Sensor no. | Composition (%) | Slope (mV decade−1) | Sensor characteristics | ||||||||
|---|---|---|---|---|---|---|---|---|---|---|---|
| G | Ionophore | A | LDH | g-C3N4 | LR (mol L−1) | DL (mol L−1) | QL (mol L−1) | r 2 | RSD (%) | ||
| 1 | 50.00 | — | — | — | — | 33.5 ± 0.5 | 9.5 × 10⁻⁶–1.0 × 10⁻² | 7.9 × 10⁻⁶ | 2.6 × 10⁻⁵ | 0.979 | 1.49 |
| 2 | 49.85 | 0.3 β-CD | — | — | — | 41.7 ± 0.8 | 1.0 × 10⁻⁵–1.0 × 10⁻² | 4.7 × 10⁻⁶ | 1.6 × 10⁻⁵ | 0.989 | 1.91 |
| 3 | 49.75 | 0.5 β-CD | — | — | — | 53.3 ± 0.4 | 1.0 × 10− 5 –1.0 × 10⁻² | 9.4 × 10− 6 | 3.1 × 10− 5 | 0.986 | 0.56 |
| 4 | 49.65 | 0.7 β-CD | — | — | — | 38.8 ± 0.9 | 1.0 × 10⁻⁵–1.0 × 10⁻² | 3.9 × 10⁻⁶ | 1.3 × 10⁻⁵ | 0.985 | 2.32 |
| 5 | 49.55 | 0.1 β-CD | — | — | — | 31.4 ± 0.6 | 1.0 × 10⁻⁵–1.0 × 10⁻² | 6.1 × 10⁻⁶ | 2.0 × 10⁻⁵ | 0.999 | 0.93 |
| 6 | 49.75 | 0.5Chitosan | — | — | — | 42.9 ± 0.4 | 1.0 × 10⁻⁵–1.0 × 10⁻² | 2.9 × 10⁻⁶ | 9.7 × 10⁻⁶ | 0.986 | 1.09 |
| 7 | 49.75 | 0.5DB18C6 | — | — | — | 45.3 ± 0.5 | 1.0 × 10⁻⁵–1.0 × 10⁻² | 2.5 × 10⁻⁶ | 8.3 × 10⁻⁶ | 0.986 | 0.27 |
| 8 | 49.75 | 0.5 18C6 | — | — | — | 43.4 ± 0.4 | 8.8 × 10⁻⁶–1.0 × 10⁻² | 2.5 × 10⁻⁶ | 8.3 × 10⁻⁶ | 0.985 | 1.12 |
| 9 | 49.45 | 0.5 β-CD | 0.3NaTPB | — | — | 53.4 ± 0.3 | 1.1 × 10⁻⁵–1.0 × 10⁻² | 1.7 × 10⁻⁶ | 5.6 × 10⁻⁶ | 0.979 | 0.65 |
| 10 | 49.25 | 0.5 β-CD | 0.5NaTPB | — | — | 56.1 ± 0.8 | 9.5 × 10⁻⁶–1.0 × 10⁻² | 5.5 × 10⁻⁶ | 1.8 × 10⁻⁶ | 0.999 | 0.42 |
| 11 | 49.05 | 0.5 β-CD | 0.7NaTPB | — | — | 48.2 ± 0.2 | 8.8 × 10⁻⁶–1.0 × 10⁻² | 4.7 × 10⁻⁶ | 1.6 × 10⁻⁵ | 0.987 | 0.17 |
| 12 | 48.75 | 0.5 β-CD | 1.0NaTPB | — | — | 43.6 ± 0.6 | 9.9 × 10⁻⁶–1.0 × 10⁻² | 2.5 × 10⁻⁶ | 8.3 × 10⁻⁶ | 0.991 | 0.25 |
| 13 | 44.25 | 0.5 β-CD | 0.5NaTPB | 5.0 | — | 57.6 ± 0.6 | 1.0 × 10⁻⁶–1.0 × 10⁻² | 1.0 × 10⁻⁶ | 3.3 × 10⁻⁶ | 0.999 | 0.22 |
| 14 | 39.25 | 0.5 β-CD | 0.5NaTPB | 10.0 | — | 56.0 ± 0.5 | 1.0 × 10⁻⁶–1.0 × 10⁻² | 2.8 × 10⁻⁶ | 9.3 × 10⁻⁵ | 0.999 | 0.40 |
| 15 | 34.25 | 0.5 β-CD | 0.5NaTPB | 15.0 | — | 55.5 ± 0.5 | 2.3 × 10⁻⁶–1.0 × 10⁻² | 5.5 × 10⁻⁶ | 1.8 × 10⁻⁵ | 0.999 | 0.41 |
| 16 | 39.25 | 0.5 β-CD | 0.5NaTPB | 5.0 | 5.0 | 59.3 ± 0.7 | 1.0 × 10⁻⁶–1.0 × 10⁻² | 3.0 × 10⁻⁷ | 9.9 × 10⁻⁷ | 0.999 | 0.12 |
| 17 | 34.25 | 0.5 β-CD | 0.5NaTPB | 5.0 | 10.0 | 56.0 ± 0.3 | 2.9 × 10⁻⁶–1.0 × 10⁻² | 1.3 × 10⁻⁶ | 4.3 × 10⁻⁶ | 0.999 | 0.61 |
| 18 | 29.25 | 0.5 β-CD | 0.5NaTPB | 5.0 | 15.0 | 55.5 ± 0.2 | 8.9 × 10⁻⁶–1.0 × 10⁻² | 5.1 × 10⁻⁶ | 1.6 × 10⁻⁵ | 0.999 | 0.25 |
G: graphite, A: anionic additive, LR: linear range, DL: detection limit, QL: quantification limit, r2: correlation coefficient, RSD: relative standard deviation (no. of samples = 3).
The ionic mobility in the sensor matrix and the interfacial ion-exchange kinetics at the sensor surface were enhanced by the lipophilic anionic additions. Ion-selective electrodes (ISEs) with ionic sites respond differently depending on whether the inserted ionophore serves as a neutral or electrically charged carrier. Cyclodextrin acts as a neutral carrier ionophore and fulfills its role when anionic sites are present. Consequently, to reduce the ohmic resistance and improve the electrochemical properties of the potentiometric sensors, NaTPB was used as an anionic addition. Additionally, the exchange kinetics at the sample sensor contact may be accelerated.48 The data listed in Table 1 illustrated that, where it can be seen that the response of the sensors to Prx+ was significantly improved when NaTPB was incorporated into the paste, whereby the slope increased from 53.3 ± 0.4 to 56.1 ± 0.8 mV decade−1 and the detection limit decreased from 9.4 × 10⁻⁶ to 5.5 × 10⁻⁶ mol L−1 (Fig. 2). The sensor response was unaffected by further lipophilic anionic additive addition.
Additionally, the inclusion of nanoparticles in the composition of the carbon paste directly affects the sensor conductivity and increases the conversion of the chemical signal to an electrical signal. Two kinds of promising nanomaterials displayed a large surface area and sufficient adsorptivity32–34 were selected with an aim to improve the sensor performance, namely Zn–Fe LDH and graphitic carbon nitride.
The paste matrix including 0.5% β-CD ionophore, 0.5% NaTPB lipophilic anionic additive, 49.25% graphite powder, and 49.75% DBP plasticizer was mixed with various percentages of Zn–Fe LDH ranging from 5% to 15% (w/w relative to carbon powder). Also, 5% Zn–Fe LDH was added, and results showed that the Nernstian slope (57.6 mV decade−1) and linear range (1.0 × 10⁻⁶ to 1.0 × 10⁻² mol L−1) were improved and the detection limit (1.0 × 10⁻⁶ mol L−1) was decreased as well. Nevertheless, the performance of the sensor started declining with more Zn–Fe LDH addition. A new composite, –CD/Zn–Fe LDH/g-C3N4, was developed by adding various compositions of graphite carbon nitride, namely 5%, 10%, and 15% to the paste. A novel CPS with a wider concentration range (1.0 × 10⁻⁶ to 1.0 × 10⁻² mol L−1) and a lower detection limit (3.0 × 10⁻⁷ mol L−1) was presented using the paste that included 0.5% β-CD, 0.5% Na-TPB, 39.25% graphite powder, 49.75% DBP, and 5% Zn–Fe LDH (Fig. 2).
3.3. Sensor potential response characteristics
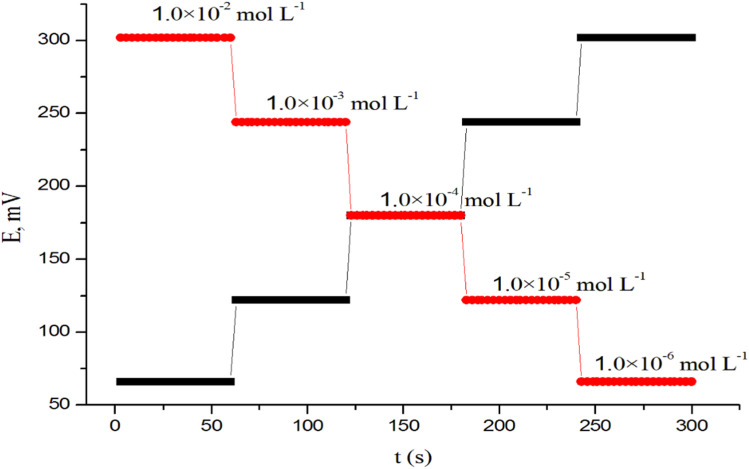
Recently, the dynamic response time has been well defined and reported.49 In fact, potentiometric responses require ion movements across nanometers at the phase boundary of the sample and the ion-selective membrane, and routine measurements are often related to how rapidly the unstirrable layer of the sample adhering to the ISE membrane may be exchanged for a fresh layer. Varying the concentration of Prx+ in solution from 1.0 × 10⁻⁶ to 1.0 × 10⁻² mol L−1, the response time was measured. In a short time (about 3 s), the sensor reached its equilibrium response (Fig. 3). The inclusion of the nanocomposite, which lowers the resistance and improves the sensor's transduction capabilities, may be responsible for the fast response of the sensor.
Fig. 3. Dynamic response time of CPS for step changes in the concentrations of Prx+ from low to high and vice versa.
By using a similar process going in the opposite direction, the reversibility of the sensors was thoroughly evaluated. The measurements were carried out in the order of high to low drug concentrations (1.0 × 10⁻² to 1.0 × 10⁻⁶ mol L−1). The results demonstrated that the sensors' response was reversible. These findings indicate the sensor response had no memory effect.
3.4. Effect of pH
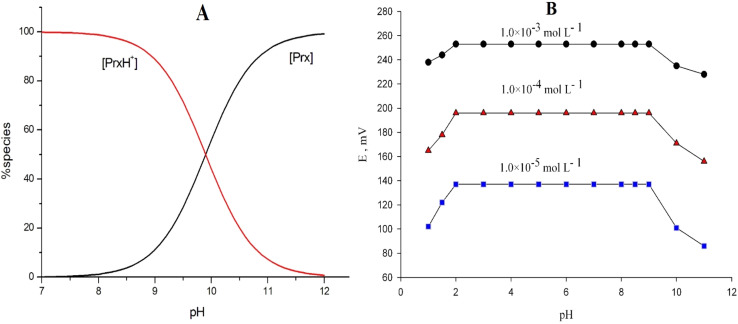
Since the ionization constant of Prx+ (pKa) was 9.9, Prx+ was almost completely ionized at pH 7.9, meaning Prx+ will be in the cationic form. The SPECIES program was used to create the concentration distribution diagram for Prx+ species (Fig. 4A).
Fig. 4. (A) Representative concentration distribution diagram for Prx+ species, (B) effect of the pH of test solutions on the potential response of CPS.
In fact, one of the most important operational parameters in applications involving potentiometric sensors is the working pH range. The effect of pH on the potential values of the examined sensor was checked for 1.0 × 10⁻⁵, 1.0 × 10⁻⁴, and 1.0 × 10⁻³ mol L−1 Prx+ solutions. As indicated in Fig. 4B, the potential response was unaffected by varying the pH in the range of pH 2.0–9.0. However, interference by the hydronium ion resulted in a drop in mV measurements at lower pH levels. On the other hand, the formation of non-protonated drug molecules may be responsible for the drop in potential above pH 9.
3.5. Water layer test
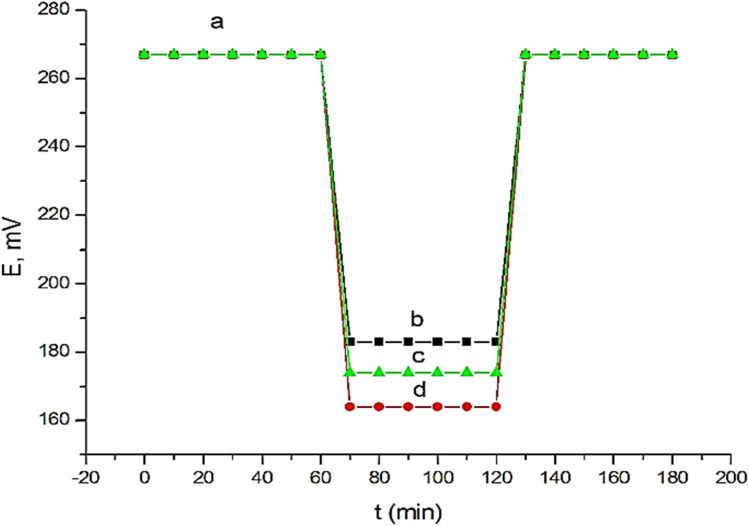
In recent years, it has been widely established that the existence of a water layer between carbon paste and the transducer affects the response of sensors based on these,50–52 which may cause O2 or CO2 to diffuse through the paste. While CO2 can change the pH of the contact, O2 can encourage redox side-reactions. The potential of the studied sensor was thus alternatively recorded after conditioning it in 1 × 10⁻³ mol L−1 Prx+ solution followed by 1 × 10⁻³ mol L−1 fluoxetine hydrochloride, nisoxetine hydrochloride, or dapoxetine hydrochloride interferent solutions and again in 1 × 10⁻³ mol L−1 Prx+ solution. No potential drift was observed (Fig. 5), indicating that no water layer was detected. This behavior may be attributed to the high hydrophobic character of the carbon paste.
Fig. 5. Water layer test for the proposed sensor. Measurements were recorded in 1.0 × 10⁻³ mol L−1 Prx+ (a) and 1.0 × 10⁻³ mol L−1 fluoxetine hydrochloride (b) or nisoxetine hydrochloride (c) or dapoxetine hydrochloride (d).
3.6. Selectivity of the sensor
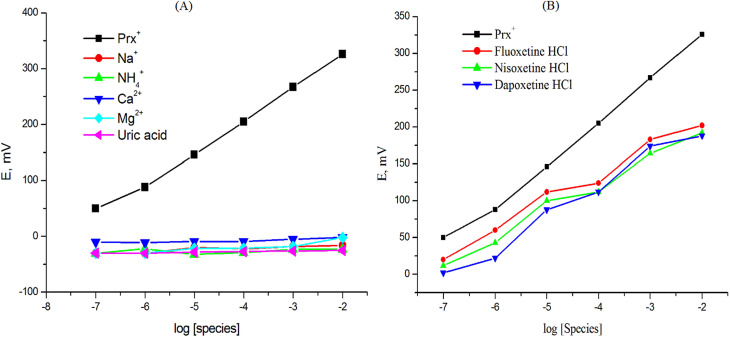
The selectivity characteristic of the potentiometric sensor is definitely one of the most significant criteria since it reflects the sensor's ability to distinguish the analyte ion from other interfering species that are present in the test solution.53 The Bakker Protocol, which was first presented by Bakker in 2002, is an excellent tool to assess purportedly unbiased selectivity.54 Calibration curves (Fig. 6A and B) were created by graphing the sensor's potential response against the logarithm of the interfering species concentrations that were examined, including for drugs with a similar formula (fluoxetine hydrochloride, nisoxetine hydrochloride, and dapoxetine hydrochloride), biologically important blood electrolytes (Na+, NH4+, Mg2+, Ca2+), as well as a major urine compound (uric acid). The results demonstrated that none of the interfering species examined exhibited a significant response, confirming the high selectivity of the selected sensor.
Fig. 6. Response to Prx+ and interfering species using the Prx+ sensor.
3.7. Thermal stability and lifespan of the sensor
Next, the investigated sensor's characteristics were studied at various temperatures ranging from 15 °C to 55 °C. The isothermal coefficient value for the suggested sensor was 0.00017 V per °C, and it demonstrated outstanding thermal stability.
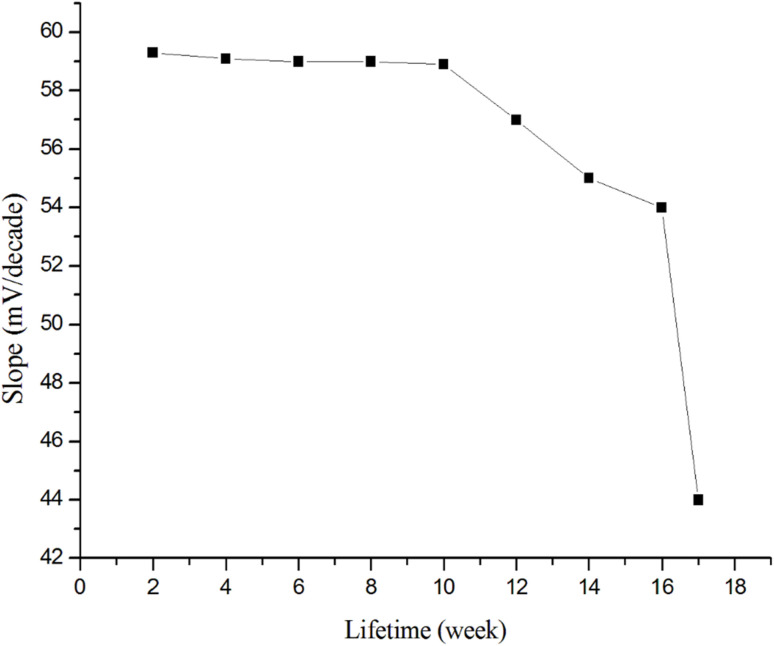
The lifespan was checked by periodically measuring the calibration curve of Prx+ standard solutions and the slope was calculated within a concentration range of 1.0 × 10⁻⁷ to 1.0 × 10⁻² mol L−1. The sensors performance was stable and reproducible within 10 weeks, indicating stable performance for a long time (Fig. 7).
Fig. 7. Lifetime of the Prx+ sensor.
3.8. Electrochemical impedance spectroscopy (EIS)
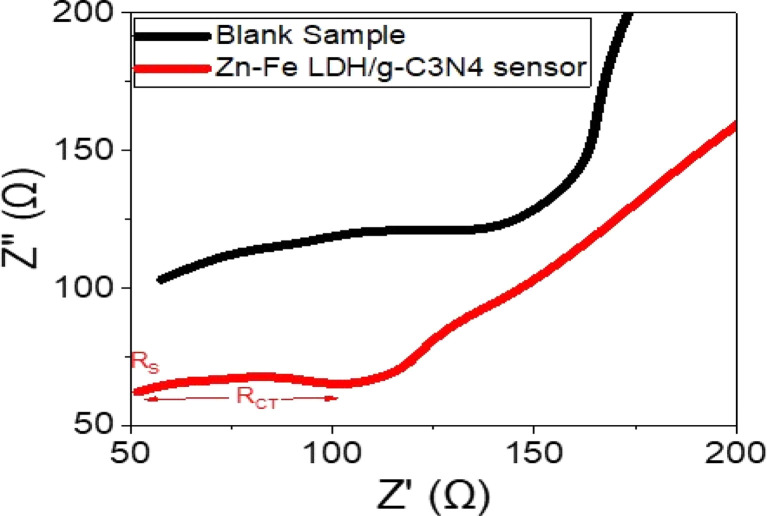
Electrochemical impedance analysis of the Zn–Fe LDH/g-C3N4 sensors was conducted through Nyquist plots, which correlate the real (Z′) and imaginary (Z′′) components (Fig. 8). Such a plot provides valuable information about the charge-transfer processes occurring at the sensor/solution interface. Here, the values of RS and RCT, corresponding to the solution resistance and charge-transfer resistance, respectively, were measured as 51 and 56 Ω for the sensor, and 48 and 80 Ω for the blank sample.
Fig. 8. Impedance of the Zn–Fe LDH/g-C3N4 sensor compared with the blank sensor.
The Nyquist plot exhibited a well-defined semi-circular shape, indicating efficient charge transfer between the solution and the sensor. This implies that the sensor had a high ability to facilitate charge transfer, showcasing its strong charge attraction characteristics. The significant reduction in the charge-transfer resistance for the Zn–Fe LDH/g-C3N4 sensor compared to the blank sample further emphasizes the improved performance of the sensor. These findings highlight the promising potential of the sensor for Prx+ sensing.
3.9. Analytical applications
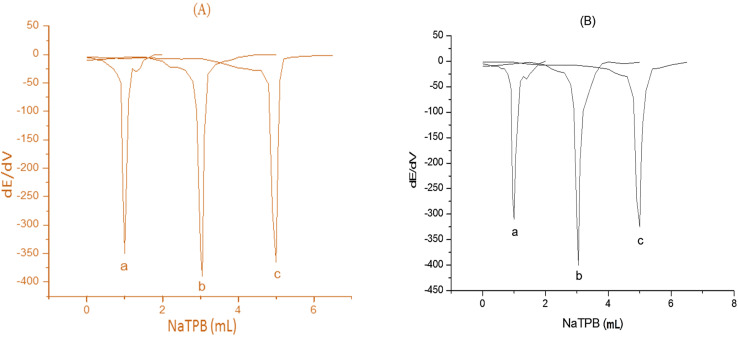
The investigated sensor was proven to be useful for the potentiometric determination of Prx+ in pure solutions, pharmaceutical preparations, and different environmental water samples (River Nile and industrial water samples) applying the potentiometric titration (Fig. 9), standard additions, and calibration curve methods at an adjusted pH of pH 5.5. The collective results are given in Tables 2 and 3. From the results, it is evident that the present sensor is very useful as a potentiometric sensor for the micro-determination of Prx+ in pure solutions, pharmaceutical preparations, and water samples. The obtained recovery values ranged from 98.25%–103.84% with RSD values of 0.02–1.89 (Tables 2 and 3).
Fig. 9. First-order derivative of the potentiometric titration curves of (a) 1, (b) 3, and (c) 5 mL of 1.0 × 10⁻² mol L−1 Prx+ (A) and paroxetine 20 mg per tablet (B) and 1.0 × 1 0−2 mol L−1 NaTPB as titrants.
Applications of the investigated sensor for monitoring Prx+ concentrations in pure and pharmaceutical formulations, as well as the statistical parameters.
| Statistical parameter | Standard addition | Potentiometric titration | ||||
|---|---|---|---|---|---|---|
| Taken (mg) | Recovery (%) | RSD (%) | Taken (mg) | Recovery (%) | RSD (%) | |
| Pure solution | 0.37 | 99.25 | 0.02 | 0.37 | 100.2 | 0.29 |
| 0.91 | 98.25 | 1.70 | 1.46 | 100.0 | 0.06 | |
| 1.46 | 99.97 | 0.26 | 1.83 | 99.30 | 0.23 | |
| Mean ± SD | 99.2 ± 0.91 | 99.8 ± 0.12 | ||||
| n | 3 | 3 | ||||
| P valuea | 0.1118 | |||||
| Paroxetine 20 mg per tablet | 0.37 | 99.83 | 0.85 | 0.37 | 98.33 | 1.39 |
| 1.46 | 103.84 | 0.03 | 1.46 | 100.55 | 1.80 | |
| 1.83 | 99.99 | 1.38 | 1.83 | 100.04 | 1.64 | |
| Mean ± SD | 101.2 ± 0.27 | 99.6 ± 0.21 | ||||
| n | 3 | 3 | ||||
| P valuea | 0.12356 | |||||
P value > 0.05 at the 95% confidence level.
Applications of the investigated sensor for the determination of Prx+ in different environmental water samples, and the statistical parameters.
| Statistical parameter | Taken (mg) | Standard addition | Calibration curve | ||
|---|---|---|---|---|---|
| Recovery (%) | RSD (%) | Recovery (%) | RSD (%) | ||
| River Nile water sample | 0.37 | 100.8 | 1.28 | 100.3 | 0.57 |
| 0.91 | 100.2 | 1.12 | 100.0 | 0.35 | |
| 1.46 | 100.9 | 1.52 | 99.6 | 0.49 | |
| Mean ± SD | 100.6 ± 0.38 | 100.0 ± 0.35 | |||
| n | 3 | 3 | |||
| P valuea | 0.0924 | ||||
| Industrial water sample | 0.37 | 100.05 | 1.1 | 99.6 | 0.32 |
| 0.91 | 101.3 | 1.6 | 100.5 | 1.36 | |
| 1.46 | 100.6 | 0.38 | 100.7 | 1.17 | |
| Mean ± SD | 100.7 ± 0.52 | 100.3 ± 0.58 | |||
| n | 3 | 3 | |||
| P valuea | 0.289 | ||||
P value > 0.05 at 95% confidence level.
To assess the intra- and inter-day precisions, RSD values were acquired within the same day and over five days, respectively. The RSD values were low, indicating high precision. The % recovery values of the quality control (LQC, MQC, and HQC) samples, on the other hand, revealed that the data reported in Table 4 demonstrate the outstanding accuracy of the proposed technique.
Evaluation of the accuracy and precision (intra- and inter-day) of the investigated sensor.
| Drug | Taken (mg) | Intra-day | Inter-day | ||
|---|---|---|---|---|---|
| Recovery (%) | RSD (%) | Recovery (%) | RSD (%) | ||
| Pure solution | 0.37a | 100.4 | 1.17 | 99.97 | 0.26 |
| 1.46b | 100.2 | 0.99 | 99.89 | 1.09 | |
| 1.83c | 99.48 | 1.05 | 100.2 | 1.82 | |
| Paroxetine 20 mg per tablet | 0.37 | 100.2 | 1.82 | 99.62 | 1.03 |
| 1.46 | 99.71 | 1.22 | 99.92 | 1.13 | |
| 1.83 | 99.88 | 0.97 | 99.71 | 0.89 | |
Low quality control (LQC).
Medium quality control (MQC).
High quality control (HQC).
3.10. Comparison with reported methods
The findings from the present work were compared with the previously the published data. The proposed method has advantages over other detection techniques; for instance the linear range (1.0 × 10⁻⁶ to 1.0 × 10⁻² mol L−1) is wider than the reported data in Table 5 and the detection limit (3.0 × 10⁻⁷ mol L−1) is lower than the spectrophotometric,19 HPLC,20,22 and the voltammetric14 techniques. In addition, it is less expensive, simpler, and faster than the reported techniques. The given data in Table 5 indicate that the examined sensor is applicable for the determination of [Prx+] ions in the pure drug and pharmaceutical formulations with high accuracy and precision.
Comparison of the proposed Prx+ ion-selective electrode method with published methodsa.
| Method | LR | DL | pH range | Recovery (%) | RSD | r 2 | Ref. |
|---|---|---|---|---|---|---|---|
| Spectrophotometry | 6.07 × 10⁻⁴–1.8 × 10⁻³ | 2.58 × 10⁻⁴ | — | 103.25–106.64 | <2% | 0.999 | 19 |
| High-performance liquid chromatography (HPLC) | 3.8 × 10⁻⁴–2.3 × 10⁻³ | 5.3 × 10⁻⁷ | — | 100.6 | 1.4 | — | 20 |
| Reversed-phase (RP-HPLC) | 1.5 × 10⁻⁵–7.6 × 10⁻⁵ | 2.27 × 10⁻⁶ | — | — | — | — | 22 |
| Adsorptive differential pulse voltammetry (AdDPV) | 5.0 × 10⁻⁹–2.2 × 10⁻⁶ | 7.0 × 10⁻¹⁰ | 8 | 98.1–101.1 | 3.61 | 0.9996 | 10 |
| Differential pulse voltammetry | 8.0 × 10⁻⁹–1.0 × 10⁻⁶ | 9.0 × 10⁻¹⁰ | 7.0 | 97.6–101.3 | 2.4 | 0.998 | 12 |
| Differential pulse voltammetry | 1.0 × 10⁻⁵–2.5 × 10⁻⁶ | 2.6 × 10⁻⁶ | 6.5 | 87–106 | 4.1 | 0.998 | 14 |
| Voltammetry (boron-doped diamond electrode) | 3.5 × 10⁻⁶–7.0 × 10⁻⁷ | 6.95 × 10⁻⁹ | 99.58 | 0.77 | 0.9994 | 15 | |
| Zn–Fe LDH/g-C3N4 sensor | 1.0 × 10⁻⁶–1.0 × 10⁻² | 3.0 × 10⁻⁷ | 2.0–9.0 | 99.2–101.2 | 0.12 | 0.999 | [P.W] |
P.W: present work.
3.11. Eco-scale greenness assessment of the proposed analytical method
Ideal green analysis is defined as having a value of 100 according to the analytical eco-scale (AES).44 The amount of reagents, energy, risks, and waste can all be used to calculate the greenness value. If the result deviates from the ideal green analysis, penalty points are added. The AES technique rated the proposed method as an excellent green analytical method, as demonstrated by the data in Table 6.
Details of the proposed technique's penalty points under AES.
| Risk factors | Values | Hazardous (pictograms × hazard) | Penalty points |
|---|---|---|---|
| Reagents and solvents | |||
| Graphite powder | <10 mL g−1 | 2 × 1 | 2 |
| Dibutyl phthalate | <10 mL g−1 | 4 × 1 | 4 |
| Instruments | |||
| Energy | <0.1 kW h per sample | 0 | 0 |
| Waste | <10 mL | 5 | 5 |
| Heater | Non | 0 | 0 |
| Occupational hazards | Non | 0 | 0 |
| pH of the sample | 2–12 | 0 | 0 |
| Sample filtration | Non | 0 | 0 |
| Total penalty points | 11 | ||
| AES score | 100 − 11 = 89 | ||
4. Conclusions
The current study describes the construction of a novel potentiometric sensor focused on βCD as a sensing ionophore for Prx+ determination. The sensor exhibited sufficient selectivity and high sensitivity toward Prx+ with a Nernstian slope of 59.3 ± 0.7 mV decade−1, fast response time (3 s), long operational lifetime (10 weeks) and wide pH range of pH 2.0–9.0. The modification with nanomaterials promoted electron-transfer processes and improved the stability of the potential reading and response time of the investigated sensor. The constructed sensor could be implemented for Prx+ determination in pure drug, pharmaceutical formulation, and different environmental water samples. Despite the fact that the examined sensor successfully determined Prx+ in all its forms, our future objective is to increase the sensor sensitivity through the use of alternative methodologies and measurements.
Data availability
The data can be obtained from the corresponding author upon reasonable request.
Conflicts of interest
There are no conflicts to declare.
Biographies
Biography
Ahmed Ashry.

Ahmed Ashry received his BSc and MSc degrees in Chemistry from the Faculty of Science, Beni-Suef University, Egypt. He is a PhD candidate at the Department of Chemistry, Faculty of Science, Beni-Suef University, Egypt. His research is focused on ion-selective electrodes.
Biography
M. Rabia.

Mohamed Rabia received his M.Sc. degree from Beni-Suef University in 2015. He is currently a lecturer at the Department of Chemistry, Faculty of Science, Beni-Suef University. His research interests are electrochemical sensors, gas sensors, functional polymer materials, solar cells, and hydrogen generation.
Biography
S. M. Mostafa.

Sahar Mahmoud Mostafa received her PhD degree in Analytical Chemistry from the Faculty of Science, Beni-Suef University, Egypt in 2021. She is a lecturer of analytical chemistry at the Department of Chemistry, Faculty of Science, Beni-Suef University, Egypt. Her research work is focused on ion-selective electrodes.
Biography
Mohamed Ali Korany.

Mohamed Ali Korany received his BSc and MSc degrees in Chemistry from the Faculty of Science, Beni-Suef University, Egypt. He received his PhD from the Department of Chemistry, Faculty of Science, Beni-Suef University, Egypt. His research is focused on ion-selective electrodes.
Biography
A. A. Farghali.

Prof. Dr. Ahmed Ali Farghali received his PhD in Physical Chemistry from Beni-Suef University, Egypt. He is a professor of materials science and nanotechnology and the Dean of PSAS, Beni-Suef University. His research work is focused on nanomaterial preparation, characterization and its application in the environmental field.
Biography
M. M. Khalil.

Mohamed Magdy Khalil received his PhD degree in Analytical Chemistry from the Polytechnical Institute, Bucharest, Romania in 1984. He is a professor of Analytical Chemistry at the Department of Chemistry, Faculty of Science, Beni-Suef University, Egypt. His research work is focused on ion-selective electrodes. He is also interested in complexation equilibria and determination of the stability constants of binary and ternary complexes involving biologically active ligands.
References
- Dunbar G. C. Cohn J. B. Fabre L. F. Feighner J. P. Fieve R. R. Mendels J. Shrivastava R. K. Br. J. Psychiatry. 1991;150:394–398. doi: 10.1192/bjp.159.3.394. [DOI] [PubMed] [Google Scholar]
- Mourilhe P. Stokes P. E. Drug Saf. 1998;18:57–82. doi: 10.2165/00002018-199818010-00005. [DOI] [PubMed] [Google Scholar]
- Preskorn S. H. J. Clin. Psychiatry Suppl. A. 1994;55:6–22. [PubMed] [Google Scholar]
- Lane R. Baldwin D. Preskorn S. J. Psychopharmacol. 1995;9:163–178. doi: 10.1177/0269881195009002011. [DOI] [PubMed] [Google Scholar]
- Fux M. Taub M. Zohar J. Acta Psychiatr. Scand. 1993;88:235–237. doi: 10.1111/j.1600-0447.1993.tb03448.x. [DOI] [PubMed] [Google Scholar]
- Grimsley S. R. Jann M. W. Clin. Pharm. 1992;11:930–957. [PubMed] [Google Scholar]
- Gunasekara N. S. Noble S. Benfield P. Drugs. 1998;55:85–120. doi: 10.2165/00003495-199855010-00007. [DOI] [PubMed] [Google Scholar]
- Caccia S. Clin. Pharmacokinet. 1998;34:281–302. doi: 10.2165/00003088-199834040-00002. [DOI] [PubMed] [Google Scholar]
- Siddiqui M. R. Alothman Z. A. Rahman N. Arab. J. Chem. 2017;10:S1409–S1421. [Google Scholar]
- Oghli A. H. Soleymanpour A. Sens. Actuators, B. 2021;344:130215. [Google Scholar]
- Wichitnithad W. Nantaphol S. Vicheantawatchai P. Kiatkumjorn T. Wangkangwan W. Rojsitthisak P. Pharmaceuticals. 2020;13:21–34. doi: 10.3390/ph13020021. [DOI] [PMC free article] [PubMed] [Google Scholar]
- Hassan Oghli A. Soleymanpour A. Mater. Sci. Eng., C. 2020;108:110407–110441. doi: 10.1016/j.msec.2019.110407. [DOI] [PubMed] [Google Scholar]
- Erk N. Biryol I. Pharm. An Int. J. Pharm. Sci. 2003;58:699–704. [PubMed] [Google Scholar]
- Piech R. Rumin M. Paczosa-Bator B. Int. J. Electrochem. Sci. 2014;9:7528–7539. [Google Scholar]
- Brycht M. Skrzypek S. Karadas-Bakirhan N. Smarzewska S. Bozal-Palabiyik B. Ozkan S. A. Uslu B. Ionics. 2015;21:2345–2354. [Google Scholar]
- Nouws H. P. Delerue-Matos C. Barros A. A. Rodrigues J. A. J. Pharm. Biomed. Anal. 2006;42:341–346. doi: 10.1016/j.jpba.2006.04.015. [DOI] [PubMed] [Google Scholar]
- Ajayi R. F. Nxusani E. Douman S. F. Jonnas A. Baker P. G. L. Iwuoha E. I. J. Nano Res. 2016;44:208–228. [Google Scholar]
- Alarfaj N. Razeq S. A. Sultan M. Chem. Pharm. Bull. 2006;54:564–566. doi: 10.1248/cpb.54.564. [DOI] [PubMed] [Google Scholar]
- Reddy L. Rajkumar T. Evangiline D. Chem. Sci. Trans. 2017;6:679–684. [Google Scholar]
- Geetharam Y. Praveen S. Int. J. Pharm. 2014;4:448–457. [Google Scholar]
- Agrawal N. Esteve-Romero J. Dubey N. P. Durgbanshi A. Bose D. Peris Vicente J. Carda-Broch S. Open Anal. Chem. J. 2013;7:1–5. [Google Scholar]
- Marella V. Lalitha K. Pravallika M. Nalluri B. N. Pharm. Methods. 2018;9:45–48. [Google Scholar]
- Vergi-Athanasiou N. Atta-Politou J. Koupparis M. Spyropoulos J. J. Liq. Chromatogr. Relat. Technol. 2007;30:1641–1655. [Google Scholar]
- Özbek O. Altunoluk O. C. Sens. Int. 2023;4:100224. [Google Scholar]
- Haghgouei H. Alizadeh N. Microchem. J. 2024;200:110434. [Google Scholar]
- Topcu C. Aydin S. Atasoy B. H. Yilmaz R. R. Coldur F. Caglar B. Microchem. J. 2024:111390. doi: 10.1016/j.microc.2024.111390. [DOI] [Google Scholar]
- Özbek O. Altunoluk O. C. Adv. Sens. Energy Mater. 2024;3:100087–100092. [Google Scholar]
- Mostafa S. M. Farghali A. A. Khalil M. M. Electroanalysis. 2021;33:1194–1204. [Google Scholar]
- Khalil M. M. Farghali A. A. El Rouby W. M. A. Abd-Elgawad I. H. Sci. Rep. 2020;10:8607–8615. doi: 10.1038/s41598-020-65592-y. [DOI] [PMC free article] [PubMed] [Google Scholar]
- Abd el-Hadi Ahmed A. Korany M. A. Khalil M. M. Microchem. J. 2020;157:104909–104918. [Google Scholar]
- Yang Q. Wang S. Chen F. Luo K. Sun J. Gong C. Yao F. Wang X. Wu J. Li X. et al. . Catal. Commun. 2017;99:15–19. [Google Scholar]
- Alizadeh T. Rafiei F. Akhoundian M. Talanta. 2022;237:122895. doi: 10.1016/j.talanta.2021.122895. [DOI] [PubMed] [Google Scholar]
- Idris A. O. Oseghe E. O. Msagati T. A. M. Kuvarega A. T. Feleni U. Mamba B. Sensors. 2020;20:5743–5770. doi: 10.3390/s20205743. [DOI] [PMC free article] [PubMed] [Google Scholar]
- Alizadeha T. Nayeri S. Habibi-Yangjeh A. Sens. Actuators, B. 2019;279:245–254. [Google Scholar]
- Raccary B. Loubet P. Peres C. Sonnemann G. Trends Anal. Chem. 2022;147:116525–116550. [Google Scholar]
- Tobiszewski M. Mare M. Galuszka A. Namiesnik J. Molecules. 2015;20:10928–10946. doi: 10.3390/molecules200610928. [DOI] [PMC free article] [PubMed] [Google Scholar]
- Kumar Chanduluru H. Sugumaran A. RSC Adv. 2022;12:6683–6703. doi: 10.1039/d1ra08858k. [DOI] [PMC free article] [PubMed] [Google Scholar]
- Sakur A. A. Nashed D. Noureldin I. Talanta Open. 2022;5:100116–100121. [Google Scholar]
- Kumar A. Kumar P. Joshi C. Manchanda M. Boukherroub R. Jain S. L. Nanomaterials. 2016;6:59–72. doi: 10.3390/nano6040059. [DOI] [PMC free article] [PubMed] [Google Scholar]
- Azizi-Toupkanloo H. Karimi-Nazarabad M. Shakeri M. Eftekhari M. Environ. Sci. Pollut. Res. 2019;26:30941–30953. doi: 10.1007/s11356-019-06274-9. [DOI] [PubMed] [Google Scholar]
- Elsayed A. M. Rabia M. Shaban M. Aly A. H. Ahmed A. M. Sci. Rep. 2021;11:17572–17584. doi: 10.1038/s41598-021-96200-2. [DOI] [PMC free article] [PubMed] [Google Scholar]
- Ahmed A. M. Rabia M. Shaban M. RSC Adv. 2020;10:14458–14470. doi: 10.1039/c9ra11042a. [DOI] [PMC free article] [PubMed] [Google Scholar]
- Abo El-Reesh G. Y. Farghali A. A. Taha M. Mahmoud R. Sci. Rep. 2020;10:587–607. doi: 10.1038/s41598-020-57519-4. [DOI] [PMC free article] [PubMed] [Google Scholar]
- Yang Q. Wang S. Chen F. Luo K. Sun J. Gong C. Yao F. Wang X. Wu J. Li X. et al. . Catal. Commun. 2017;99:15–19. [Google Scholar]
- Wang Y. Zhou S. Zhao G. Li C. Liu L. Jiao F. J. Mater. Sci.: Mater. Electron. 2023;31:12269–12281. [Google Scholar]
- Elsayed A. M. Alkallas F. H. Trabelsi A. B. G. Rabia M. Micromachines. 2023;14:1694–1706. doi: 10.3390/mi14091694. [DOI] [PMC free article] [PubMed] [Google Scholar]
- Aldosari E. Rabia M. Abdelazeez A. Green Process. Synth. 2024;13:1–12. [Google Scholar]
- Wardak C. Int. J. Environ. Anal. Chem. 2009;89:735–748. [Google Scholar]
- Khalil M. M. Abed El-aziz G. M. Electroanalysis. 2017;29:566–577. [Google Scholar]
- Magdy N. Sobaih A. E. Hussein L. A. Mahmoud A. M. Electroanalysis. 2023;35 doi: 10.1002/elan.202200119. [DOI] [Google Scholar]
- Grygolowicz-Pawlak E. Crespo G. A. Afshar M. G. Mistlberger G. Bakker E. Anal. Chem. 2013;85:6208–6212. doi: 10.1021/ac400470n. [DOI] [PubMed] [Google Scholar]
- Han T. Kalinichev A. V. Mousavi Z. Mikhelson K. N. Bobacka J. Sens. Actuators, B. 2022;357:131416–131425. [Google Scholar]
- Alizadeh T. Nayeri S. Mirzaee S. A. Talanta. 2019;192:103–111. doi: 10.1016/j.talanta.2018.08.027. [DOI] [PubMed] [Google Scholar]
- Bakker E. Pretsch E. Anal. Chem. 2002;74:420A–426A. doi: 10.1016/j.trac.2006.10.006. [DOI] [PMC free article] [PubMed] [Google Scholar]
Associated Data
This section collects any data citations, data availability statements, or supplementary materials included in this article.
Data Availability Statement
The data can be obtained from the corresponding author upon reasonable request.


