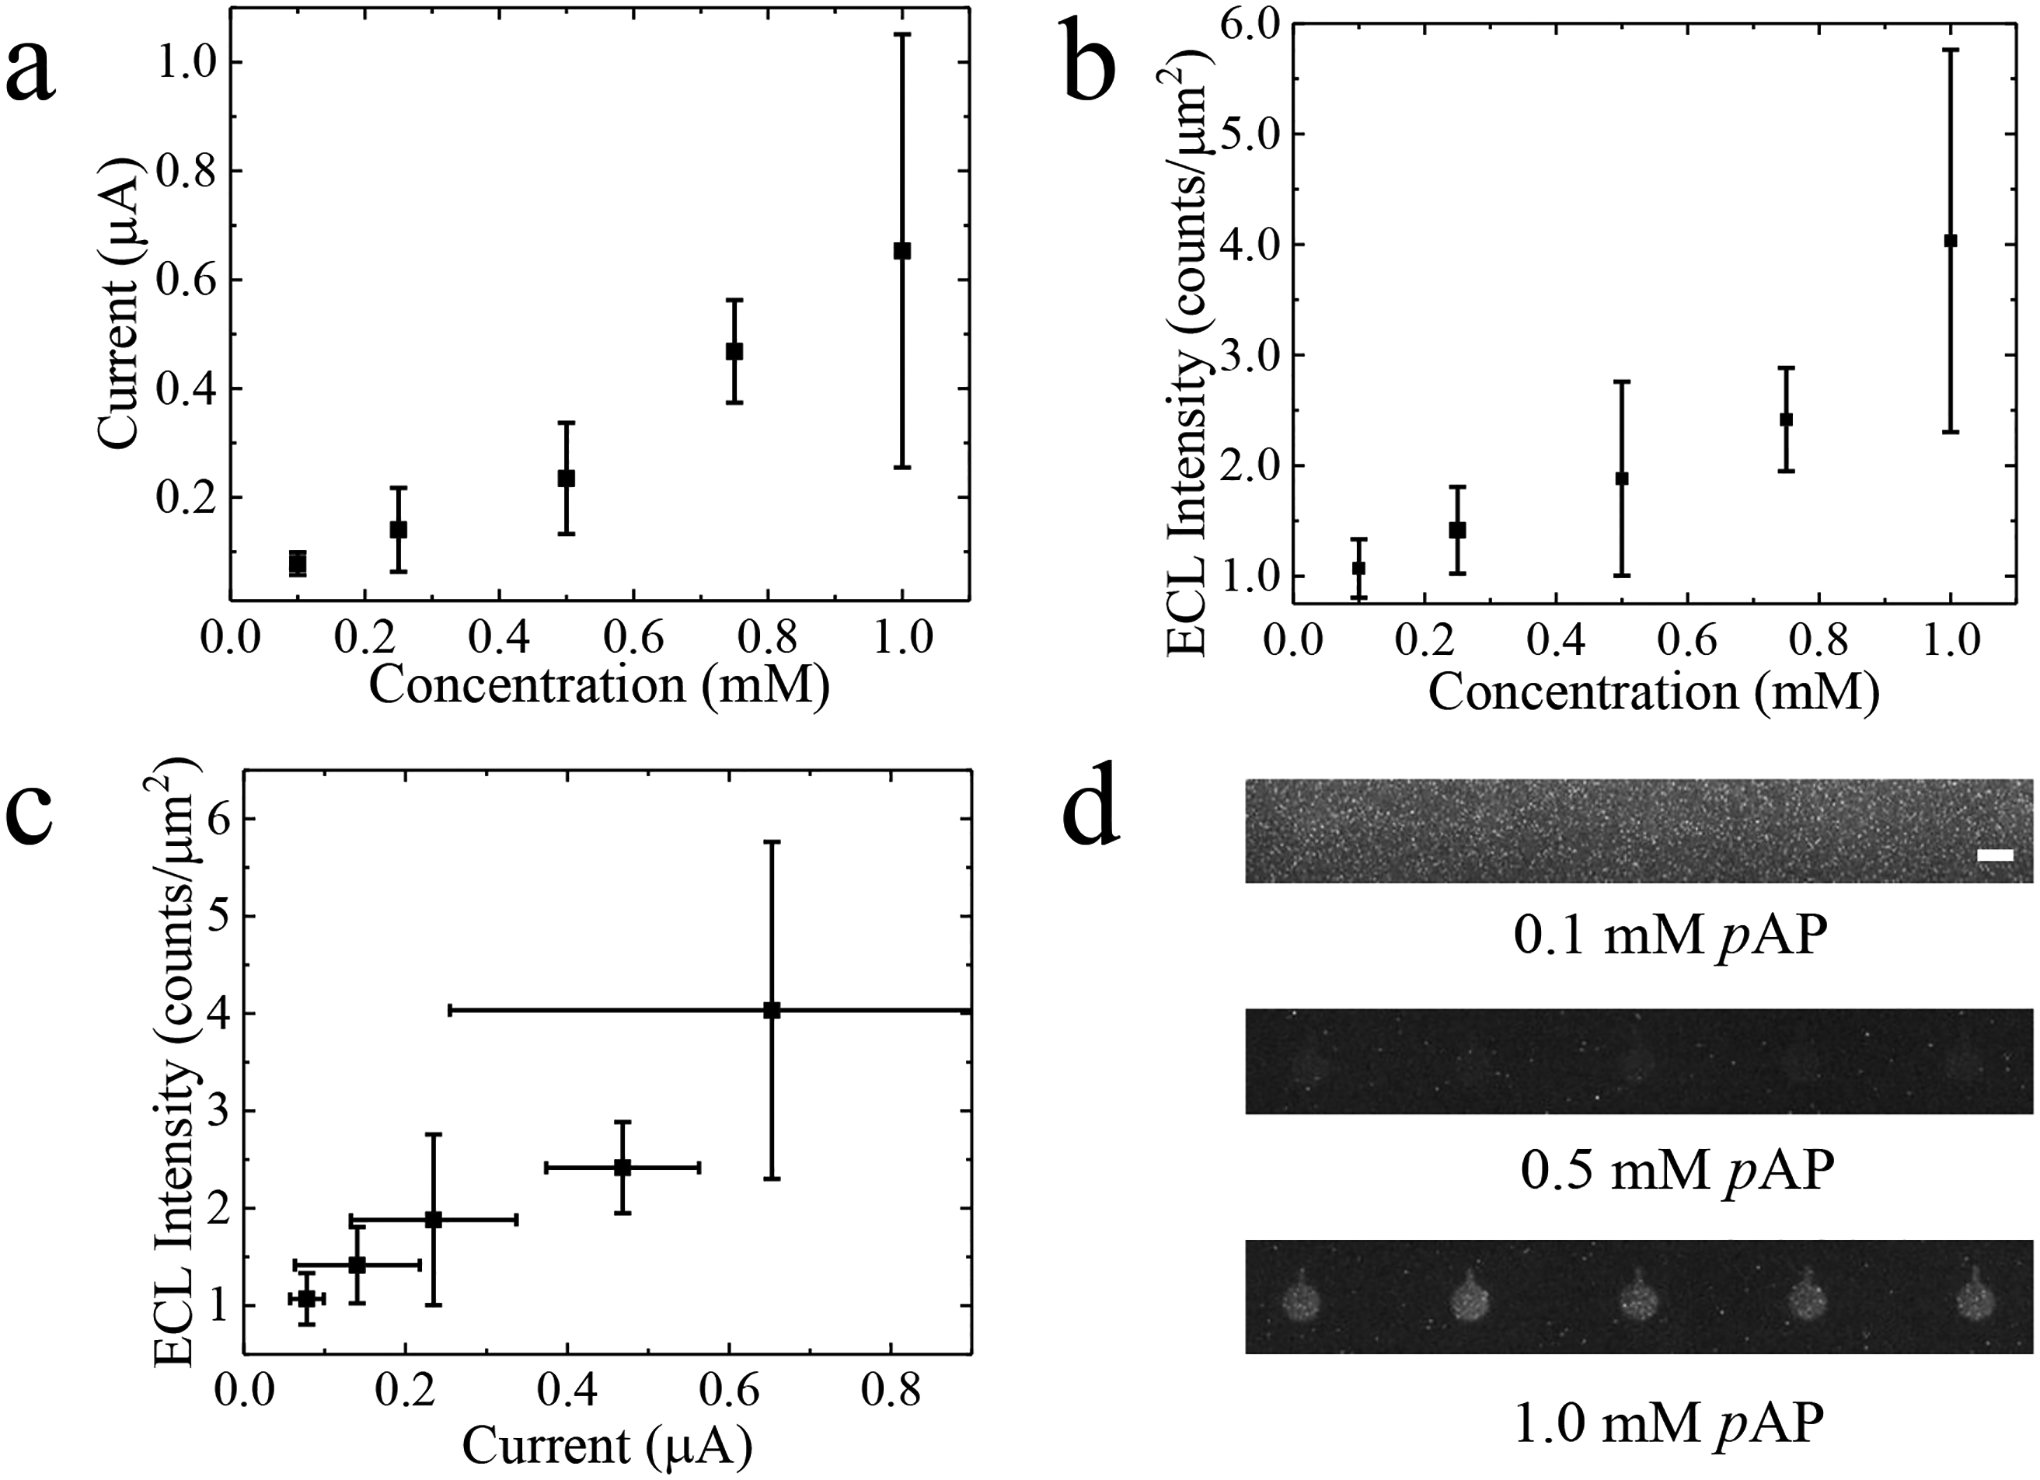
Figure 1.

Plot of (a) current measured at the driving electrodes and (b) ECL intensity versus concentration for five concentrations of pAP (0.1, 0.25, 0.5, 0.75, or 1.0 mM) under an applied voltage of +1.73 V. (c) Current versus ECL intensity plot for the same results reported in (a) and (b). (d) Brightfield micrographs of the ECL response when 0.1, 0.5-, or 1.0-mM pAP is in the sensing channel. Scale bar, 100 m.
