

Abstract
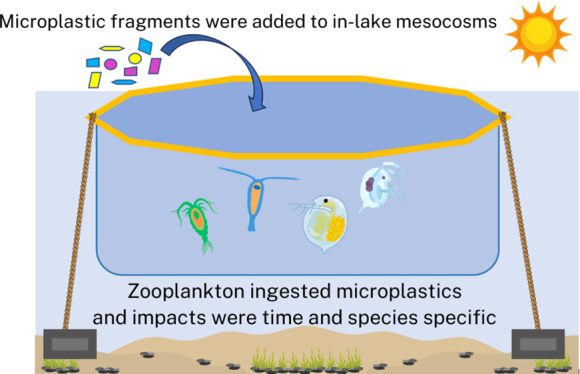
To assess the potential risks of contemporary levels of plastic pollution in freshwater ecosystems, a large-scale experiment was conducted over 10 weeks in a boreal lake at the IISD-Experimental Lakes Area (Ontario, Canada). Fragments of common polymers (polyethylene, polystyrene, and polyethylene terephthalate), each with distinct colors and buoyancies, were added as a single pulse to seven in-lake mesocosms in equal contributions in a range of environmentally relevant nominal concentrations (6–29,240 particles/L). Two additional mesocosms with no added microplastics were used as controls. Zooplankton ingested low levels of microplastics (mean of 0.06 particles/individual ± SD 0.07) and generally their total abundance and community composition were not negatively impacted. Temporary changes were however observed; total zooplankton abundance and abundance of calanoid copepods were temporarily stimulated by increasing nominal microplastic concentrations, and modest, short-term reductions in egg production of the cyclopoid copepod Tropocyclops extensus and abundance of copepod nauplii occurred. Collectively, these results suggest that microplastics could have complex impacts on zooplankton communities, stimulating some species while negatively impacting others.
Keywords: food web, ingestion, polymers, reproduction, ecotoxicity, phytoplankton, contaminants
Short abstract
We investigated the response of a pelagic zooplankton community to a large range of microplastic concentrations using in-lake mesocosms, including monitoring changes in abundance, community structure and reproduction.
Introduction
Zooplankton are an important link between primary producers and higher trophic level organisms and play an essential role in nutrient cycling and ecosystem structure and functioning. Microplastics (plastic particles <5 mm in size) are bioavailable to a wide range of organisms including zooplankton but their impacts are poorly understood, especially in freshwater systems.1−4 Due to fragmentation and resistance to complete degradation, microplastic concentrations are increasing in the environment5,6 and have been detected in surface waters across the world.5 Concentrations found in natural water bodies are variable, with reported concentrations as high as 76,000 particles/L detected in a coastal lagoon.7 Zooplankton have been found to ingest microplastics in the laboratory8−10 and in the natural environment,11−13 but ecotoxicological risks in situ remain uncertain.14−16 In some laboratory studies, exposure to high concentrations of microplastics results in decreased zooplankton growth, reproduction, and mortality.17−20 Alternatively, when microplastics are covered with biofilm, they can have a positive effect on the growth of zooplankton, possibly by providing an additional nutrition source.21−23
Our current understanding of how microplastics may impact zooplankton is largely based on laboratory studies, most of which have used high unrealistic concentrations of only one type of polymer.1 Few studies have examined community level effects of microplastics on zooplankton and minimal to no impacts were observed.24−27 In natural environments, zooplankton are exposed to a complex mixture of microplastics that vary in composition, size, morphology, and chemical additives.28 Indirect effects mediated through the food web may also be important.29−31 Even if microplastics are not acutely toxic to zooplankton, they may influence their community structure by altering pathways of energy flow, behavior, and predation.32
The goal of this study was to investigate the direction and magnitude of microplastic effects on zooplankton communities across a range of environmentally relevant microplastic concentrations (6 to 29,240 particles/L). The study was undertaken using large (10 m diameter) mesocosms within a natural boreal lake. Zooplankton were monitored for 10 weeks (68 days) to examine potential effects on community dynamics including the following:
-
1.
Ingestion of microplastics by different zooplankton taxa;
-
2.
Effects of microplastics on total zooplankton abundance and abundance of different taxonomic groups;
-
3.
Effects of microplastics on zooplankton reproduction; and
-
4.
Effects of microplastics on species composition and community diversity.
While we hypothesized that most species of zooplankton would ingest microplastics, we expected cladocerans (which are nondiscriminate feeders33,34) to ingest and accumulate higher levels of microplastics than copepods. We also hypothesized that zooplankton would primarily ingest positively and neutrally buoyant polymers, compared to dense polymers that would be less available in the water column due to higher sedimentation rates. We hypothesized that reductions in reproductive outputs and subtle changes in community composition and diversity by the end of the experiment due to species-specific responses from ingesting microplastics17−20 would result in an overall decrease in total zooplankton abundance. The scale of this experiment is the largest in-lake mesocosm study on microplastics to date and aims to improve our understanding of the environmentally relevant risks microplastics pose for freshwater zooplankton communities.
Materials and Methods
Experimental Design
The study was conducted in a small, oligotrophic boreal lake (Lake 378) at the International Institute for Sustainable Development Experimental Lakes Area (IISD-ELA) located in northwestern Ontario, Canada (49°40′N, 93°44′W). The zooplankton data were collected as part of a larger experiment to assess the fate and effects of microplastics in freshwater systems and the experimental design is described in detail in Rochman et al. (2024).35 In May 2021, nine 10 m diameter by 2 m deep closed-bottomed nonpermeable mesocosms were deployed in Lake 378 and filled with ∼150,000 L of lake water, which included the natural microbial, phytoplankton and zooplankton communities, using a fire hose connected to a trash pump. To offset potential zooplankton mortality caused by pumping, we augmented zooplankton communities 2 weeks prior to the addition of microplastics and then allowed the mesocosms to equilibrate. Zooplankton collected from 15 10 m vertical hauls from Lake 378 using a 0.5 m diameter net with a 150 μm mesh were added to each mesocosm. Prior to the addition of microplastics, each mesocosm was also stocked with 25 young of the year yellow perch (Perca flavescens), a common omnivorous fish species found in Lake 378. Although efforts were made to augment zooplankton, abundances were lower in mesocosms than in the surrounding lake, so fish diets were supplemented with additions of frozen Mysis, a freshwater shrimp, every 3 days to reduce predation pressure on the zooplankton community. Background levels of microplastics in Lake 378 are very low (0.2 particles/L in surface waters) consisting mostly of polyester and acrylic fibers.36
On June 2nd, 2021 (day 0), an equal mixture (by count) of three types of widely abundant plastic polymers (polyethylene, PE; polystyrene, PS; and polyethylene terephthalate, PET) were added to the water surface of seven mesocosms as a single pulse. A regression approach was used because it is more statistically powerful than ANOVA designs with low numbers of replicates and it allows for the detection of nonlinear responses.37,38 Experimental treatments were randomly assigned and included two controls with no added microplastics and seven treatments where microplastics were added to generate nominal initial concentrations of 6, 24, 100, 414, 1710, 7071, and 29,240 particles/L that followed an approximate logarithmic scale. The lower end of the range encompasses concentrations reported in freshwater ecosystems and values relevant to risk39,40 and the highest concentrations are more typical of those reported in wastewater effluent and coastal lagoons.7,41
The PE was positively buoyant (0.93 g/cm3) and ranged in size from 37 to 1086 μm (average: ∼209 μm). The PS was neutrally buoyant (1 g/cm3) and ranged in size from 48 to 1408 μm (average: ∼197 μm). The PET was negatively buoyant (1.4 g/cm3) and ranged in size from 52 to 1408 μm (average: ∼232 μm). Size distributions of particles for each polymer are shown in Figure S1. Each polymer contained its own suite of chemical additives (Table S1). See Rochman et al. (2024)35 for more information about the plastics as well as how we determined a mass-to-count ratio to achieve our nominal concentrations.
We did not expect all microplastics to remain suspended in the water column throughout the experiment and their fate is described in Rochman et al. (2024).35 In effect, the initial nominal concentrations can be viewed as loading amounts. Microplastic concentrations measured from the water column of 3 mesocosms were much lower than the nominal treatment concentrations and were, in general, 2 orders of magnitude lower than would be expected if the microplastics remained fully mixed in the water column throughout the experiment. Average concentrations across time and depth were 246 (±202) particles/L for the 29,240 particles/L treatment, 13 (±8) particles/L for the 414 particles/L treatment, and 12 (±14) particles/L for the 6 particles/L treatment. The PE and PS particles were the most abundant polymers in the water column while PET sank rapidly, as expected. Most microplastics either were on the bottom (PET) or water surface (PE) based on visual observation, and only about 1% of microplastics added were in the water column.35 Although observed concentrations in the water column were generally far below nominal concentrations, concentrations in the mesocosm receiving the highest treatment were still relatively high compared to natural systems5,39,42 and concentrations relevant to risk management.40
Water Quality, Chemistry, Phytoplankton, and Fish
Water chemistry parameters including dissolved and particulate nutrients were collected 1 week prior to microplastic additions on May 24th (day −9) and on 2 occasions afterward on June 14th (day 12) and August 9th (day 68), and water quality parameters, including temperature, conductivity, dissolved oxygen, turbidity and photosynthetically active radiation (PAR) were monitored weekly (see Rochman et al., 2024 for more details on how these parameters were measured).35 Phytoplankton samples from unfiltered mesocosm water were preserved in Lugol’s solution and enumerated using methods described in Findlay and Kling (2003)43 to estimate biomass. Yellow perch abundances were recorded at the end of the experiment when fish were retrieved using a large seine net. Final yellow perch densities were highly variable, but not related to microplastic treatment, with the largest variation in final densities observed between the two controls (Table S2).
Zooplankton Sample Collection
Zooplankton samples were collected from all mesocosms prior to microplastic additions on June 1st (day −1) and then at weekly intervals for 10 weeks (68 days) using a Wisconsin plankton net with a 0.25 m diameter opening and 53 μm mesh, attached to a long pole to access the center of the mesocosms. Mesocosms were sampled in ascending order to limit cross-contamination (i.e., controls were sampled first, followed by increasing treatment concentrations). Two 1.5 m vertical net hauls were collected from opposite sides of each mesocosm and then combined to provide a representative sample of the zooplankton community for each mesocosm (total sample volume of 147 L). Samples were preserved in 5% sugar-formalin44 after narcotization in methanol.45 The plankton net was rinsed with lake water between mesocosms and thoroughly washed and dried between sampling periods.
Zooplankton were identified and counted to the lowest possible taxonomic level using light microscopy.46−48 Copepod nauplii and stage CI to CIII copepodites were not identified to species. Eggs attached to copepod females or contained within the brood pouch of cladocerans were directly counted during species identification to determine the reproductive rates of abundant zooplankton taxa.49 Loose copepod eggs were apportioned to copepod females based on the relative abundance of adult females in each sample. Diversity was calculated using the inverse Simpson index (D2), which is a measure of the effective number of species.
Microplastic Ingestion
Ingestion of microplastics by common zooplankton taxa was assessed by picking animals from random subsamples collected for zooplankton taxonomy on day 68 of the experiment. Subsamples were suspended in tap water and individuals were picked with fine metal tweezers under a microscope and placed into clean glass vials. Zooplankton were visually inspected for microplastics attached to the carapace and appendages, and only visually “clean” zooplankton were used (i.e., our objective was to measure microplastics only inside the organisms). Nauplii and stage CI–III copepodites were not included due to their small size. Only abundant species were picked, including Diaptomus minutus, Diaphanosoma birgei, Tropocyclops extensus, Eubosmina sp., and Mesocyclops edax. Where possible, pooled samples including up to 100 individuals of each species were picked from one control (0 particles/L), and the lowest (6 particles/L), medium (414 particles/L), and highest concentration (29,240 particles/L) treatments. The number of individuals picked of each species was recorded to determine the number of microplastic particles ingested per individual zooplankton for each taxon.
Zooplankton were rinsed into clean polypropylene cups and were digested using 40 mL of 30% H2O2 (hydrogen peroxide) solution for 24 h in a temperature-controlled (45 °C) oven.50 Two laboratory blanks were run following the same methods and no procedural contamination was detected. After digestion, microplastics were sorted into size fractions using metal sieves (>212, 106–212, and 53–106 μm). For each size fraction, samples were examined under a microscope, and each particle was picked, photographed, and measured, as well as analyzed using Raman Spectroscopy to confirm polymer type.51 Only the three distinct polymers added to mesocosms were quantified (PE, PS, and PET). For more detailed information on extraction, counting, spectroscopy and quality assurance methods see Rochman et al. (2024).35
Statistical Analysis
Statistical analyses and data visualization were conducted in R version 4.1.352 using the packages vegan (version 2.6–4)53 and ggplot2 (3.4.0).54 Zooplankton abundance, diversity, and reproduction (eggs per female and nauplii per copepod female) were linearly regressed against nominal microplastic treatment concentration for individual time points on the assumption that exposure was correlated with nominal concentrations. Even if microplastics did not remain in the water column, zooplankton were exposed for some time to the microplastics added at the experiment’s initiation. Microplastic treatment concentrations were log10 transformed after the addition of a small constant (+ 0.001) to deal with zero values. Quantile-quantile plots and scatterplots were used to assess normality and homoscedasticity. Where necessary, dependent variables were log10 transformed to meet model assumptions and improve model fit. A critical alpha level of 0.05 was used to determine significance.
Principal response curves (PRC) were used to determine zooplankton community responses to microplastics.55 PRCs are a method of constrained ordination in which Redundancy Analysis (RDA) is used to determine treatment differences in a community over time, contrasted against a control treatment.55 The outputs include the canonical coefficients (Cdt), which represent the magnitude and direction of the effect on the community relative to the control at a given time, and the taxon weights (bk), which represent the affinity of each taxon with the overall community response.55Cdt values closer to 1 or −1 indicate a strong response while values closer to zero indicate a weak or no response. When Cdt and bk share the same sign, that taxon is more abundant in the treatment than the control and when Cdt and bk have different signs, that taxon is less abundant in the treatment than the control.56 Data were log10 transformed abundances (numbers/L) of different zooplankton taxonomic groups. A permutation test (999 permutations) was used to determine whether treatments significantly differed from controls over time. The PRC analysis was conducted using the prc() function from the vegan package in R.
Results and Discussion
Microplastic Ingestion by Zooplankton
In zooplankton collected at the end of the experiment (day 68), we observed mean amounts of microplastics per individual of 0.01 (±0.01) across taxa for the 6 particles/L treatment, 0.07 (±0.08) for the 414 particles/L treatment, and 0.06 ± (0.07) for the 29,240 particles/L treatment (Figure 1). This is within the range of what has been detected in natural systems.11−13 The highest occurrence of ingested microplastics was 0.2 particles/individual, observed in cladocerans Diaphanosoma birgei in the 414 particles/L treatment and Eubosmina sp. in the 29,240 particles/L treatment. Aside from one PET particle detected in Eubosmina sp. from the control treatment, zooplankton exclusively ingested PS and PE particles. The PET particles were negatively buoyant and typically detected at very low concentrations in the water column, so this polymer was largely unavailable to grazing zooplankton, as expected. Presumably, microplastics detected in zooplankton from the control mesocosm for D. minutus, D. birgei, and Eubosmina sp. were introduced via cross-contamination or transport from treated mesocosms by wind and waves.35 It is likely that the low numbers of ingested microplastics found in zooplankton were due to low exposure, avoidance, and rapid egestion of microplastics, particularly given that sampling for microplastic ingestion occurred only at the end of the experiment when realized microplastic concentrations in the water column were lowest.35 The data indicate that zooplankton ingested microplastics but there was no evidence of food dilution as reported in some laboratory studies where high concentrations were used.9,17 Microplastic ingestion was likely higher earlier on in the experiment soon after microplastics were added.
Figure 1.

Microplastic ingestion (particles per individual) for common zooplankton taxa on day 68 of the experiment for polyethylene (PE), polystyrene (PS), and polyethylene terephthalate (PET) in the control (0 particles/L), 6, 414, and 29,240 particles/L nominal microplastic treatments.
Though cladocerans appeared to ingest more microplastics on average across treatments (0.06 particles/L ± SD 0.07) than copepods (0.02 particles/L ± SD 0.04), differences in the mean ingestion between taxonomic groups were not statistically significant (Welch Two Sample t test; t = 1.42, p = 0.19). Copepods are generally considered to be more discriminate feeders than cladocerans.34,57 For example, Klasios and Tseng (2023)13 found lower ingestion of microplastics by freshwater calanoids versus cladocerans, and some marine calanoids have been shown to avoid ingesting microplastics.33 Large-bodied cladocerans such as Daphnia were found to ingest more microplastics than smaller-bodied zooplankton species in a similar mesocosm experiment.24 Large-bodied zooplankton were generally not found in our mesocosms likely due to fish predation, which could be another reason why ingestion of microplastics was low.
The size of ingested microplastics ranged from 18 to 261 μm (mean of 67.8 μm ± SD 50.8) for width and 29 to 1014 μm (mean of 145 μm ± SD 171) for length across zooplankton taxa and treatment (Table 1). Large microplastic particles have been previously observed to be ingested by Daphniids (1430 μm long fibers58) but it is likely that most ingested particles would fall below 100 μm due to the upper size limit for ingestion of some small-bodied species.59−61 Fibrous microplastics can also be twisted and folded into smaller shapes, making them more readily ingestible.12 Since the average size of our microplastics (∼200 μm) was greater than what is readily ingested by most zooplankton, this can help explain the low uptake of microplastics by zooplankton in this study. Additionally, our methods for analyzing the smallest size microplastic fraction (<53 μm) are still under development, so the full size range of ingested particles may be greater than that reported here.
Table 1. Mean Width and Length of Ingested Microplastics for Common Zooplankton Taxa Across Treatments on Day 68 of the Mesocosm Experiment.
| species | mean (±SD) width of ingested MPs (μm) | mean (±SD) length of ingested MPs (μm) |
|---|---|---|
| Diaphanosoma birgei | 53 (±29) | 122 (±148) |
| Diaptomus minutus | 136 (±89) | 345 (±301) |
| Eubosmina sp. | 58 (±34) | 85 (±34) |
| Mesocyclops edax | 73 (±51) | 169 (±185) |
| Tropocyclops extensus | 57 (±19) | 120 (±76) |
Zooplankton Abundance & Community Response
There was a significant positive relationship between total zooplankton abundance (excluding nauplii) and nominal microplastic treatment concentration on day 33 (R2 = 0.6, p = 0.014; Figure 2). Abundances of total cladocerans or cyclopoid copepods had no significant relationships with microplastics on any study day (p > 0.05; Figures S2 and S3), but a significant positive relationship was observed between nominal microplastic treatment and calanoid copepods on days 19 (R2 = 0.49, p = 0.04) and 33 (R2 = 0.7, p = 0.005; Figure 3). Regressions with calanoids and nominal microplastic treatment on other days were not statistically significant, however, calanoid copepod abundance generally followed a positive trend with nominal microplastic concentration throughout the experiment. The calanoid copepods in this study were almost exclusively Diaptomus minutus (see Figure S4 for species abundances).
Figure 2.

Total zooplankton abundance, excluding nauplii, versus nominal microplastic treatment for seven time points during the experiment. Significant regressions are indicated by black lines and light gray lines indicate a nonsignificant regression. 95% confidence intervals are indicated by shaded regions.
Figure 3.

Calanoid copepod abundance (number per L) versus nominal microplastic treatment (particles per L) for seven time points during the mesocosm experiment. Significant regressions are indicated by black lines and shaded 95% confidence intervals, while light gray lines indicate a nonsignificant regression.
Positive relationships between microplastics and calanoid copepod abundance may have arisen because of biofilm growth on the added microplastics. Amariei et al. (2022)21 found that microplastics containing a biofilm coating had a positive effect on zooplankton, while pristine microplastics had negative effects. Initial biofilm formation begins within hours of microplastic addition62 but can take weeks to accumulate a substantial coating,21 which may explain why no positive effects were observed until day 33. Zooplankton may also selectively ingest aged microplastics with biofilm development.23,34 After day 33 and beyond, there was no longer a positive relationship between microplastic treatment concentration and calanoid copepod abundance, suggesting that this may be only a temporary response. Alternatively, given the multiple comparisons involved in our study, it is possible that the significance of positive relationships with microplastics we observed for total zooplankton and calanoids simply occurred by chance.
The PRC for abundance-based zooplankton community composition was not significantly related to nominal microplastic concentration over time (p = 0.97; Figure 4). Additionally, the Cdt values were very low (−0.2 < Cdt < + 0.2) further indicating that microplastics did not influence community structure (Cdt values closer to 1 or −1 indicate a strong community response while values closer to 0 indicate little to no effect on a community). Overall, CI to CIII calanoid copepods and D. minutus had relatively large positive taxa weights (bk) indicating that they were more abundant with microplastics while Eubosmina sp. had the most negative bk indicating lower abundance with microplastics. Similarly, there were no statistically significant relationships between zooplankton diversity and nominal microplastic treatment concentration throughout the study (p > 0.05; Figure S5). These results mirror those of similar but smaller-scale mesocosm studies, which also found no effect of microplastics on zooplankton species composition.24−26
Figure 4.

Principal response curve (PRC) for abundance-based zooplankton community composition. The community response (Cdt) for each microplastic treatment is displayed on the left and taxa weights (bk) on the right. The solid black horizontal line represents the mean of the control treatments, and the dashed vertical line represents the day of microplastic addition (day 0).
Zooplankton Reproduction
We were only able to evaluate zooplankton reproduction (i.e., the number of eggs per female) for three zooplankton taxa (Eubosmina sp., Diaptomus minutus, and Tropocyclops extensus) because no other taxa had sufficient egg counts. There were no significant relationships between the number of eggs per female and nominal microplastic concentration for Eubosmina sp. or D. minutus, on any study day (p > 0.05; Figures S6 and S7). Linear regressions between eggs per female and microplastic treatment for T. extensus were also nonsignificant, except on day 19, when a negative relationship was observed (R2 = 0.51, p = 0.031; Figure 5). As discussed above, it is possible this result was a false positive resulting from the large number of statistical tests. While strong negative effects on egg production were not generally observed, the hatching success of eggs was not evaluated. Cole et al. (2015)17 found that microplastics did not affect egg production but negatively affected the hatching success of marine calanoid copepods. Similarly, Lee et al. (2013)19 suggested that microplastics may inhibit the fertilization of copepod eggs. Therefore, future work should consider the hatching success within similar experiments to explore the potential effects more fully on zooplankton reproduction from microplastic exposure.
Figure 5.

Eggs per female for the cyclopoid copepod Tropocyclops extensus regressed against nominal microplastic treatment concentration for various days of the study. Significant regressions are indicated by black lines and light gray lines indicate a nonsignificant regression. 95% confidence intervals are indicated by shaded regions.
The abundance of copepod nauplii initially increased after microplastic additions for controls and all treatments, followed by a sharp decline, and then nauplii abundances remained low for the remainder of the experiment (Figure S8). Linear regression analysis indicated a statistically significant negative relationship on day 54 between nauplii per copepod female and microplastic treatment concentration (R2 = 0.5, p = 0.034; Figure S9). This pattern may reflect the reduction in T. extensus eggs on day 19. On other dates, the relationship between microplastic concentration and nauplii per female copepod was consistently negative, but not statistically significant due to high variation among controls and treatments. While the impacts to zooplankton reproduction in our experiment were minimal, our results suggest that further study of microplastic impacts on zooplankton reproduction is warranted.
Confounding Variables
Water quality and chemistry parameters varied with time but not consistently with nominal microplastic concentrations, except for light penetration (PAR), which was positively correlated with microplastic concentration at multiple time points,35 and chlorophyll-a, which was negatively correlated with microplastic concentration on day 12 (Figure S10). The phytoplankton community was initially dominated by chrysophytes, followed by an increase of diatoms in all treatments on day 35 (Figure S11). There was no statistically significant impact of microplastics on phytoplankton biomass or community composition (Figures S12 and S13).
Final yellow perch densities were not correlated with nominal microplastic concentrations (Figure S14). Phytoplankton biomass was strongly negatively correlated with final perch densities (r = −0.9, p = 0.002), however zooplankton abundance was not correlated with perch densities or with phytoplankton biomass (Figure S14). The lack of a significant relationship between perch and zooplankton abundance suggests that the negative relationship between perch and phytoplankton did not result from a trophic cascade. Rather, it is more likely that the decomposition of dead fish or unconsumed Mysis contributed to nutrients (i.e., “bottom-up” effects) that enhanced phytoplankton growth, which could explain why there was higher phytoplankton biomass in mesocosms with fewer fish. Because fish were sampled only at the end of the experiment, the timing of fish mortalities is unknown, and relationships between fish and zooplankton or phytoplankton on other dates cannot be assessed.
Limitations & Future Directions
The mesocosms used in this study contained natural zooplankton communities and were more realistic than laboratory studies; however, they still differ from natural ecosystems. While our mesocosms allowed for indirect food web interactions in the plankton community, they were closed-bottomed and lacked a natural benthic habitat. Since most microplastics are expected to sink, benthic invertebrates may be disproportionately exposed to higher concentrations, and may be at risk of adverse effects.63,64 Additionally, the mesocosms themselves were constructed of plastic and the proximity of the walls likely altered the planktonic communities by encouraging epiphytic species. While the study duration was long compared to most laboratory studies, it was not long enough to allow for many long-term indirect effects such as changes to fish populations and seasonal effects.
Microplastics did not mix homogeneously and settled quickly from the water column since they were only added as a single pulse. Water column concentrations were much lower than expectations based on complete mixing but the highest treatments were still well within the upper range of microplastic concentrations observed in natural water bodies.5,42 Because microplastic concentrations were assessed in only a subset of mesocosms, our conclusions are based on the assumption that actual concentrations of microplastics were correlated with nominal concentrations. This study only examined 3 types of polymers (PE, PS, and PET) with a restricted size range (37–1408 μm) of fragments. Other types of polymers (e.g., PVC), morphologies (e.g., fibers) and sizes (e.g., <1 μm) may prove to be more harmful for plankton communities and deserve further attention. Finally, the study lake (Lake 378) is a small oligotrophic lake located in the boreal shield. Other lakes or water bodies with different environmental conditions such as eutrophic lakes or turbid rivers may respond differently to microplastic additions.
Our results are among the first to bridge the gap between laboratory studies and real-world conditions using an experimental approach. Our findings are consistent with those of other mesocosm studies to date examining the effects of microplastics on plankton communities.24−27 All of these previous studies were conducted in much smaller mesocosms and used a more limited range of exposures than ours. Our results confirm the speculations of Marchant et al. (2023)25 and Klasios et al. (2024)26 that rapid settling of added microplastics may be an important mechanism limiting exposure for zooplankton communities. More field-based experiments using complete food webs and realistic microplastic exposure conditions are needed to better understand the potential impacts of microplastics on natural aquatic communities.
Acknowledgments
This is contribution #5 of the pELAstic project (https://thepelasticproject.com/). Thanks to those who helped in the field (S. Graves, T. Rodriguez, C. Currie, A. Ross, W. Dombroskie), the research staff at IISD-ELA (especially L. Hayhurst and L. Hrenchuk) and the chemistry laboratory at IISD-ELA (especially S. Havens and B Cooney), and the staff and students in the Rochman Lab that helped quantify the microplastics. Thanks to David Findlay (Plankton R’ Us, Winnipeg, MB, Canada) for providing the phytoplankton community data.
Supporting Information Available
The Supporting Information is available free of charge at https://pubs.acs.org/doi/10.1021/acs.est.4c05327.
Supplementary tables and figures; supplementary zooplankton community composition and ingestion data (PDF)
This project was supported by a National Contaminants Advisory Group grant (Fisheries and Oceans Canada) and funding from Loblaws, the National Sciences and Engineering Research Council of Canada (NSERC) and the IISD-ELA Graduate Fellowship Fund.
The authors declare no competing financial interest.
Notes
This work has been used in part in the lead author’s thesis where they hold the sole copyright to the work (DOI: 10.34991/NSR9-TG75).
Supplementary Material
References
- Bucci K.; Tulio M.; Rochman C. M. What Is Known and Unknown about the Effects of Plastic Pollution: A Meta-analysis and Systematic Review. Ecol. Appl. 2020, 30 (2), e02044 10.1002/eap.2044. [DOI] [PubMed] [Google Scholar]
- Blettler M. C. M.; Abrial E.; Khan F. R.; Sivri N.; Espinola L. A. Freshwater Plastic Pollution: Recognizing Research Biases and Identifying Knowledge Gaps. Water Res. 2018, 143, 416–424. 10.1016/j.watres.2018.06.015. [DOI] [PubMed] [Google Scholar]
- de Sá L. C.; Oliveira M.; Ribeiro F.; Rocha T. L.; Futter M. N. Studies of the Effects of Microplastics on Aquatic Organisms: What Do We Know and Where Should We Focus Our Efforts in the Future?. Sci. Total Environ. 2018, 645, 1029–1039. 10.1016/j.scitotenv.2018.07.207. [DOI] [PubMed] [Google Scholar]
- Au S. Y.; Lee C. M.; Weinstein J. E.; van den Hurk P.; Klaine S. J. Trophic Transfer of Microplastics in Aquatic Ecosystems: Identifying Critical Research Needs. Integr. Environ. Assess. Manag. 2017, 13 (3), 505–509. 10.1002/ieam.1907. [DOI] [PubMed] [Google Scholar]
- Eerkes-Medrano D.; Thompson R. C.; Aldridge D. C. Microplastics in Freshwater Systems: A Review of the Emerging Threats, Identification of Knowledge Gaps and Prioritisation of Research Needs. Water Res. 2015, 75, 63–82. 10.1016/j.watres.2015.02.012. [DOI] [PubMed] [Google Scholar]
- Horton A. A.; Walton A.; Spurgeon D. J.; Lahive E.; Svendsen C. Microplastics in Freshwater and Terrestrial Environments: Evaluating the Current Understanding to Identify the Knowledge Gaps and Future Research Priorities. Sci. Total Environ. 2017, 586, 127–141. 10.1016/j.scitotenv.2017.01.190. [DOI] [PubMed] [Google Scholar]
- Badylak S.; Phlips E.; Batich C.; Jackson M.; Wachnicka A. Polystyrene Microplastic Contamination versus Microplankton Abundances in Two Lagoons of the Florida Keys. Sci. Rep. 2021, 11 (1), 6029. 10.1038/s41598-021-85388-y. [DOI] [PMC free article] [PubMed] [Google Scholar]
- Egbeocha C.; Malek S.; Emenike C.; Milow P. Feasting on Microplastics: Ingestion by and Effects on Marine Organisms. Aquat. Biol. 2018, 27, 93–106. 10.3354/ab00701. [DOI] [Google Scholar]
- Cole M.; Lindeque P.; Fileman E.; Halsband C.; Goodhead R.; Moger J.; Galloway T. S. Microplastic Ingestion by Zooplankton. Environ. Sci. Technol. 2013, 47 (12), 6646–6655. 10.1021/es400663f. [DOI] [PubMed] [Google Scholar]
- Frydkjær C. K.; Iversen N.; Roslev P. Ingestion and Egestion of Microplastics by the Cladoceran Daphnia Magna: Effects of Regular and Irregular Shaped Plastic and Sorbed Phenanthrene. Bull. Environ. Contam. Toxicol. 2017, 99 (6), 655–661. 10.1007/s00128-017-2186-3. [DOI] [PubMed] [Google Scholar]
- Aytan U.; Esensoy F. B.; Senturk Y. Microplastic Ingestion and Egestion by Copepods in the Black Sea. Sci. Total Environ. 2022, 806, 150921 10.1016/j.scitotenv.2021.150921. [DOI] [PubMed] [Google Scholar]
- Desforges J.-P. W.; Galbraith M.; Ross P. S. Ingestion of Microplastics by Zooplankton in the Northeast Pacific Ocean. Arch. Environ. Contam. Toxicol. 2015, 69 (3), 320–330. 10.1007/s00244-015-0172-5. [DOI] [PubMed] [Google Scholar]
- Klasios N.; Tseng M. Microplastics in Subsurface Water and Zooplankton from Eight Lakes in British Columbia. Can. J. Fish. Aquat. Sci. 2023, 80 (8), 1248–1267. 10.1139/cjfas-2022-0293. [DOI] [Google Scholar]
- Scherer C.; Weber A.; Lambert S.; Wagner M. Interactions of Microplastics with Freshwater Biota. Handb. Environ. Chem. 2018, 58, 153–180. 10.1007/978-3-319-61615-5_8. [DOI] [Google Scholar]
- Zimmermann L.; Göttlich S.; Oehlmann J.; Wagner M.; Völker C. What Are the Drivers of Microplastic Toxicity? Comparing the Toxicity of Plastic Chemicals and Particles to Daphnia Magna. Environ. Pollut. 2020, 267, 115392 10.1016/j.envpol.2020.115392. [DOI] [PubMed] [Google Scholar]
- Botterell Z. L. R.; Beaumont N.; Dorrington T.; Steinke M.; Thompson R. C.; Lindeque P. K. Bioavailability and Effects of Microplastics on Marine Zooplankton: A Review. Environ. Pollut. 2019, 245, 98–110. 10.1016/j.envpol.2018.10.065. [DOI] [PubMed] [Google Scholar]
- Cole M.; Lindeque P.; Fileman E.; Halsband C.; Galloway T. S. The Impact of Polystyrene Microplastics on Feeding, Function and Fecundity in the Marine Copepod Calanus Helgolandicus. Environ. Sci. Technol. 2015, 49 (2), 1130–1137. 10.1021/es504525u. [DOI] [PubMed] [Google Scholar]
- Ogonowski M.; Schür C.; Jarsén Å.; Gorokhova E. The Effects of Natural and Anthropogenic Microparticles on Individual Fitness in Daphnia Magna. PLoS One 2016, 11 (5), e0155063 10.1371/journal.pone.0155063. [DOI] [PMC free article] [PubMed] [Google Scholar]
- Lee K.-W.; Shim W. J.; Kwon O. Y.; Kang J.-H. Size-Dependent Effects of Micro Polystyrene Particles in the Marine Copepod Tigriopus Japonicus. Environ. Sci. Technol. 2013, 47 (19), 11278–11283. 10.1021/es401932b. [DOI] [PubMed] [Google Scholar]
- Moyo S. An Enigma: A Meta-Analysis Reveals the Effect of Ubiquitous Microplastics on Different Taxa in Aquatic Systems. Front. Environ. Sci. 2022, 10, 999349 10.3389/fenvs.2022.999349. [DOI] [Google Scholar]
- Amariei G.; Rosal R.; Fernández-Piñas F.; Koelmans A. A. Negative Food Dilution and Positive Biofilm Carrier Effects of Microplastic Ingestion by D. Magna Cause Tipping Points at the Population Level. Environ. Pollut. 2022, 294, 118622 10.1016/j.envpol.2021.118622. [DOI] [PubMed] [Google Scholar]
- Canniff P. M.; Hoang T. C. Microplastic Ingestion by Daphnia Magna and Its Enhancement on Algal Growth. Sci. Total Environ. 2018, 633, 500–507. 10.1016/j.scitotenv.2018.03.176. [DOI] [PubMed] [Google Scholar]
- Vroom R. J. E.; Koelmans A. A.; Besseling E.; Halsband C. Aging of Microplastics Promotes Their Ingestion by Marine Zooplankton. Environ. Pollut. 2017, 231, 987–996. 10.1016/j.envpol.2017.08.088. [DOI] [PubMed] [Google Scholar]
- Yildiz D.; Yalçın G.; Jovanović B.; Boukal D. S.; Vebrová L.; Riha D.; Stanković J.; Savić-Zdraković D.; Metin M.; Akyürek Y. N.; Balkanlı D.; Filiz N.; Milošević D.; Feuchtmayr H.; Richardson J. A.; Beklioğlu M. Effects of a Microplastic Mixture Differ across Trophic Levels and Taxa in a Freshwater Food Web: In Situ Mesocosm Experiment. Sci. Total Environ. 2022, 836, 155407 10.1016/j.scitotenv.2022.155407. [DOI] [PubMed] [Google Scholar]
- Marchant D. J.; Martínez Rodríguez A.; Francelle P.; Jones J. I.; Kratina P. Contrasting the Effects of Microplastic Types, Concentrations and Nutrient Enrichment on Freshwater Communities and Ecosystem Functioning. Ecotoxicol. Environ. Saf. 2023, 255, 114834 10.1016/j.ecoenv.2023.114834. [DOI] [PubMed] [Google Scholar]
- Klasios N.; Kim J. O.; Tseng M. No Effect of Realistic Concentrations of Polyester Microplastic Fibers on Freshwater Zooplankton Communities. Environ. Toxicol. Chem. 2024, 43 (2), 418–428. 10.1002/etc.5797. [DOI] [PubMed] [Google Scholar]
- Ebbesen L. G.; Strange M. V.; Gunaalan K.; Paulsen M. L.; Herrera A.; Nielsen T. G.; Shashoua Y.; Lindegren M.; Almeda R. Do Weathered Microplastics Impact the Planktonic Community? A Mesocosm Approach in the Baltic Sea. Water Res. 2024, 255, 121500 10.1016/j.watres.2024.121500. [DOI] [PubMed] [Google Scholar]
- Rochman C. M.; Brookson C.; Bikker J.; Djuric N.; Earn A.; Bucci K.; Athey S.; Huntington A.; McIlwraith H.; Munno K.; De Frond H.; Kolomijeca A.; Erdle L.; Grbic J.; Bayoumi M.; Borrelle S. B.; Wu T.; Santoro S.; Werbowski L. M.; Zhu X.; Giles R. K.; Hamilton B. M.; Thaysen C.; Kaura A.; Klasios N.; Ead L.; Kim J.; Sherlock C.; Ho A.; Hung C. Rethinking Microplastics as a Diverse Contaminant Suite. Environ. Toxicol. Chem. 2019, 38 (4), 703–711. 10.1002/etc.4371. [DOI] [PubMed] [Google Scholar]
- Fleeger J. W.; Carman K. R.; Nisbet R. M. Indirect Effects of Contaminants in Aquatic Ecosystems. Sci. Total Environ. 2003, 317 (1–3), 207–233. 10.1016/S0048-9697(03)00141-4. [DOI] [PubMed] [Google Scholar]
- Kong X.; Koelmans A. A. Modeling Decreased Resilience of Shallow Lake Ecosystems toward Eutrophication Due to Microplastic Ingestion across the Food Web. Environ. Sci. Technol. 2019, 53 (23), 13822–13831. 10.1021/acs.est.9b03905. [DOI] [PubMed] [Google Scholar]
- Pan Y.; Long Y.; Hui J.; Xiao W.; Yin J.; Li Y.; Liu D.; Tian Q.; Chen L. Microplastics Can Affect the Trophic Cascade Strength and Stability of Plankton Ecosystems via Behavior-Mediated Indirect Interactions. J. Hazard. Mater. 2022, 430, 128415 10.1016/j.jhazmat.2022.128415. [DOI] [PubMed] [Google Scholar]
- Tanentzap A. J. Plastics as Non-Toxic Disruptors of Aquatic Ecosystems. Limnol. Oceanogr. Bull. 2023, 32 (4), 125–128. 10.1002/lob.10597. [DOI] [Google Scholar]
- Xu J.; Rodríguez-Torres R.; Rist S.; Nielsen T. G.; Hartmann N. B.; Brun P.; Li D.; Almeda R. Unpalatable Plastic: Efficient Taste Discrimination of Microplastics in Planktonic Copepods. Environ. Sci. Technol. 2022, 56 (10), 6455–6465. 10.1021/acs.est.2c00322. [DOI] [PubMed] [Google Scholar]
- Demott W. R. The Role of Taste in Food Selection by Freshwater Zooplankton. Oecologia (Berlin) 1986, 69, 334–340. 10.1007/BF00377053. [DOI] [PubMed] [Google Scholar]
- Rochman C. M.; Bucci K.; Langenfeld D.; McNamee R.; Veneruzzo C.; Covernton G. A.; Gao G. H. Y.; Ghosh M.; Cable R. N.; Hermabessiere L.; Lazcano R.; Paterson M. J.; Rennie M. D.; Rooney R. C.; Helm P.; Duhaime M. B.; Hoellein T.; Jeffries K. M.; Hoffman M. J.; Orihel D. M.; Provencher J. F. Informing the Exposure Landscape: The Fate of Microplastics in a Large Pelagic In-Lake Mesocosm Experiment. Environ. Sci. Technol. 2024, 58, 7998. 10.1021/acs.est.3c08990. [DOI] [PMC free article] [PubMed] [Google Scholar]
- McIlwraith H. K.; Dias M.; Orihel D. M.; Rennie M. D.; Harrison A. L.; Hoffman M. J.; Provencher J. F.; Rochman C. M. A Multicompartment Assessment of Microplastic Contamination in Semi-remote Boreal Lakes. Environ. Toxicol. Chem. 2024, 43 (5), 999–1011. 10.1002/etc.5832. [DOI] [PubMed] [Google Scholar]
- Cottingham K. L.; Lennon J. T.; Brown B. L. Knowing When to Draw the Line: Designing More Informative Ecological Experiments. Front. Ecol. Environ. 2005, 3 (3), 145. 10.2307/3868542. [DOI] [Google Scholar]
- Kreyling J.; Schweiger A. H.; Bahn M.; Ineson P.; Migliavacca M.; Morel-Journel T.; Christiansen J. R.; Schtickzelle N.; Larsen K. S. To Replicate, or Not to Replicate – That Is the Question: How to Tackle Nonlinear Responses in Ecological Experiments. Ecol. Lett. 2018, 21 (11), 1629–1638. 10.1111/ele.13134. [DOI] [PubMed] [Google Scholar]
- Hataley E. K.; McIlwraith H. K.; Roy D.; Rochman C. M. Towards a Management Strategy for Microplastic Pollution in the Laurentian Great Lakes—Ecological Risk Assessment and Management (Part 2). Can. J. Fish. Aquat. Sci. 2023, 80 (10), 1669–1678. 10.1139/cjfas-2023-0023. [DOI] [Google Scholar]
- Mehinto A. C.; Coffin S.; Koelmans A. A.; Brander S. M.; Wagner M.; Thornton Hampton L. M.; Burton A. G.; Miller E.; Gouin T.; Weisberg S. B.; Rochman C. M. Risk-Based Management Framework for Microplastics in Aquatic Ecosystems. Microplastics and Nanoplastics 2022, 2 (1), 17. 10.1186/s43591-022-00033-3. [DOI] [Google Scholar]
- Uogintė I.; Pleskytė S.; Pauraitė J.; Lujanienė G. Seasonal Variation and Complex Analysis of Microplastic Distribution in Different WWTP Treatment Stages in Lithuania. Environ. Monit. Assess. 2022, 194 (11), 829. 10.1007/s10661-022-10478-x. [DOI] [PMC free article] [PubMed] [Google Scholar]
- Schell T.; Rico A.; Vighi M.; Occurrence, Fate and Fluxes of Plastics and Microplastics in Terrestrial and Freshwater Ecosystems. In Reviews of environmental contamination and toxicology; Springer, 2020; Vol. 250, pp 1–43. 10.1007/398_2019_40. [DOI] [PubMed] [Google Scholar]
- Findlay D. L.; Kling H. J.. Protocols for Measuring Biodiversity: Phytoplankton in Freshwater; Winnipeg: Manitoba, Canada, 2003. https://www.researchgate.net/publication/264881321_Protocols_for_measuring_biodiversity_Phytoplankton_in_freshwater (accessed 2022–01–18). [Google Scholar]
- Prepas E. Sugar-Frosted Daphnia: An Improved Fixation Technique for Cladocera. Limnol. Oceanogr. 1978, 23 (3), 557–559. 10.4319/lo.1978.23.3.0557. [DOI] [Google Scholar]
- Gannon S. A.; Gannon J. E. Observations on the Narcotization of Crustacean Zooplankton. Crustaceana 1975, 28 (2), 220–224. 10.1163/156854075X00775. [DOI] [Google Scholar]
- Witty L. M.Practical Guide to Identifying Freshwater Crustacean Zooplankton, 2nd ed.; Coopertive Freshwater Ecology Unit, Laurentian University: Sudbury, Ontario, Canada, 2004. [Google Scholar]
- Smith K.; Fernando C. H.. A Guide to the Freshwater Calanoid and Cyclopoid Copepod Crustacea of Ontario. University of Waterloo. Department of Biology; 1978; p Ser. No. 18. [Google Scholar]
- Balcer M. D.; Korda N. L.; Dodson S. I.. Zooplankton of the Great Lakes - A Guide to the Identification and Ecology of Common Crustacean Species; University of Wisconsin Press, 1984 [Google Scholar]
- Taylor B. E. Analyzing Population Dynamics of Zooplankton. Limnol. Oceanogr. 1988, 33 (6), 1266–1273. 10.4319/lo.1988.33.6.1266. [DOI] [Google Scholar]
- Alfonso M. B.; Takashima K.; Yamaguchi S.; Tanaka M.; Isobe A. Microplastics on Plankton Samples: Multiple Digestion Techniques Assessment Based on Weight, Size, and FTIR Spectroscopy Analyses. Mar. Pollut. Bull. 2021, 173, 113027 10.1016/j.marpolbul.2021.113027. [DOI] [PubMed] [Google Scholar]
- Lenz R.; Enders K.; Stedmon C. A.; Mackenzie D. M. A.; Nielsen T. G. A Critical Assessment of Visual Identification of Marine Microplastic Using Raman Spectroscopy for Analysis Improvement. Mar. Pollut. Bull. 2015, 100 (1), 82–91. 10.1016/j.marpolbul.2015.09.026. [DOI] [PubMed] [Google Scholar]
- Team R. C.R: A Language and Environment for Statistical Computing. R Foundation for Statistical Computing: Vienna, Austria, 2022. https://www.r-project.org/. [Google Scholar]
- Oksanen J.; Simpson G. L.; Blanchet F. G.; Kindt R.; Legendre P.; Minchin P. R.; O’Hara R. B.; Solymos P.; Stevens M. H. H.; Szoecs E.; Wagner H.; Barbour M.; Bedward M.; Bolker B.; Borcard D.; Carvalho G.; Chirico M.; De Caceres M.; Durand S.; Evangelista H. B. A.; FitzJohn R.; Friendly M.; Furneaux B.; Hannigan G.; Hill M. O.; Lahti L.; McGlinn D.; Ouellette M.-H.; Cunha E. R.; Smith T.; Stier A.; Braak Ter; C J. F.; Weedon J.. Vegan: Community Ecology Package. R package version 2.6–4. 2022. https://cran.r-project.org/package=vegan.
- Wickham H.Ggplot2: Elegant Graphics for Data Analysis. Springer-Verlag: New York, 2016. https://ggplot2.tidyverse.org. [Google Scholar]
- Van den Brink P. J.; Braak C. J. F. T. Principal Response Curves: Analysis of Time-Dependent Multivariate Responses of Biological Community to Stress. Environ. Toxicol. Chem. 1999, 18 (2), 138–148. 10.1002/etc.5620180207. [DOI] [Google Scholar]
- Auber A.; Travers-Trolet M.; Villanueva M. C.; Ernande B. A New Application of Principal Response Curves for Summarizing Abrupt and Cyclic Shifts of Communities over Space. Ecosphere 2017, 8 (12), e02023 10.1002/ecs2.2023. [DOI] [Google Scholar]
- Sodré E. de O.; Bozelli R. L. How Planktonic Microcrustaceans Respond to Environment and Affect Ecosystem: A Functional Trait Perspective. Int. Aquat. Res. 2019, 11 (3), 207–223. 10.1007/s40071-019-0233-x. [DOI] [Google Scholar]
- Jemec A.; Horvat P.; Kunej U.; Bele M.; Kržan A. Uptake and Effects of Microplastic Textile Fibers on Freshwater Crustacean Daphnia Magna. Environ. Pollut. 2016, 219, 201–209. 10.1016/j.envpol.2016.10.037. [DOI] [PubMed] [Google Scholar]
- Kokalj A. J.; Kunej U.; Skalar T. Screening Study of Four Environmentally Relevant Microplastic Pollutants: Uptake and Effects on Daphnia Magna and Artemia Franciscana. Chemosphere 2018, 208, 522–529. 10.1016/j.chemosphere.2018.05.172. [DOI] [PubMed] [Google Scholar]
- Burns C. W. The Relationship between Body Size of Filter-Feeding Cladocera and the Maximum Size of Particle Ingested. Limnol. Oceanogr. 1968, 13 (4), 675–678. 10.4319/lo.1968.13.4.0675. [DOI] [Google Scholar]
- Scherer C.; Brennholt N.; Reifferscheid G.; Wagner M. Feeding Type and Development Drive the Ingestion of Microplastics by Freshwater Invertebrates. Sci. Rep. 2017, 7 (1), 17006. 10.1038/s41598-017-17191-7. [DOI] [PMC free article] [PubMed] [Google Scholar]
- Rummel C. D.; Jahnke A.; Gorokhova E.; Kühnel D.; Schmitt-Jansen M. Impacts of Biofilm Formation on the Fate and Potential Effects of Microplastic in the Aquatic Environment. Environ. Sci. Technol. Lett. 2017, 4 (7), 258–267. 10.1021/acs.estlett.7b00164. [DOI] [Google Scholar]
- Redondo-Hasselerharm P. E.; Gort G.; Peeters E. T. H. M.; Koelmans A. A. Nano- and Microplastics Affect the Composition of Freshwater Benthic Communities in the Long Term. Sci. Adv. 2020, 6 (5), eaay4054 10.1126/sciadv.aay4054. [DOI] [PMC free article] [PubMed] [Google Scholar]
- Rauchschwalbe M.-T.; Höss S.; Haegerbaeumer A.; Traunspurger W. Long-Term Exposure of a Free-Living Freshwater Micro- and Meiobenthos Community to Microplastic Mixtures in Microcosms. Sci. Total Environ. 2022, 827, 154207 10.1016/j.scitotenv.2022.154207. [DOI] [PubMed] [Google Scholar]
Associated Data
This section collects any data citations, data availability statements, or supplementary materials included in this article.