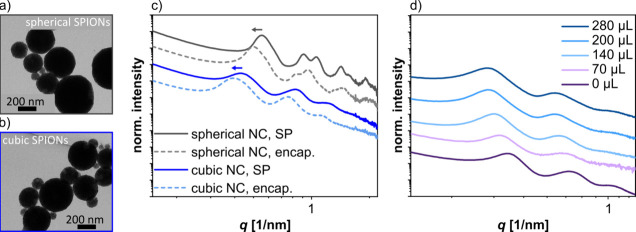
Figure 7.
(a) TEM images of SPs from ∼12 nm sized spherical nanocrystals and (b) cubic nanocrystals. (c) SAXS curves of SPs from spherical (gray curves) and cubic (blue curves) SPIONs measured before (solid lines) and after (dashed lines) the encapsulation using 70 μL monomer (styrene/DVB). The arrows indicate the shift of the SAXS signals after the encapsulation. The data was measured using dried SPs on Kapton foil. (d) SAXS curves of dispersed SPs in DTAB solution before the encapsulation (0 μL) and after encapsulation using monomer volumes between 70 and 280 μL, as indicated.

